Cities with the Highest Percentage of African Population in Maryland
RELATED REPORTS & OPTIONS
African
Maryland
Compare Cities
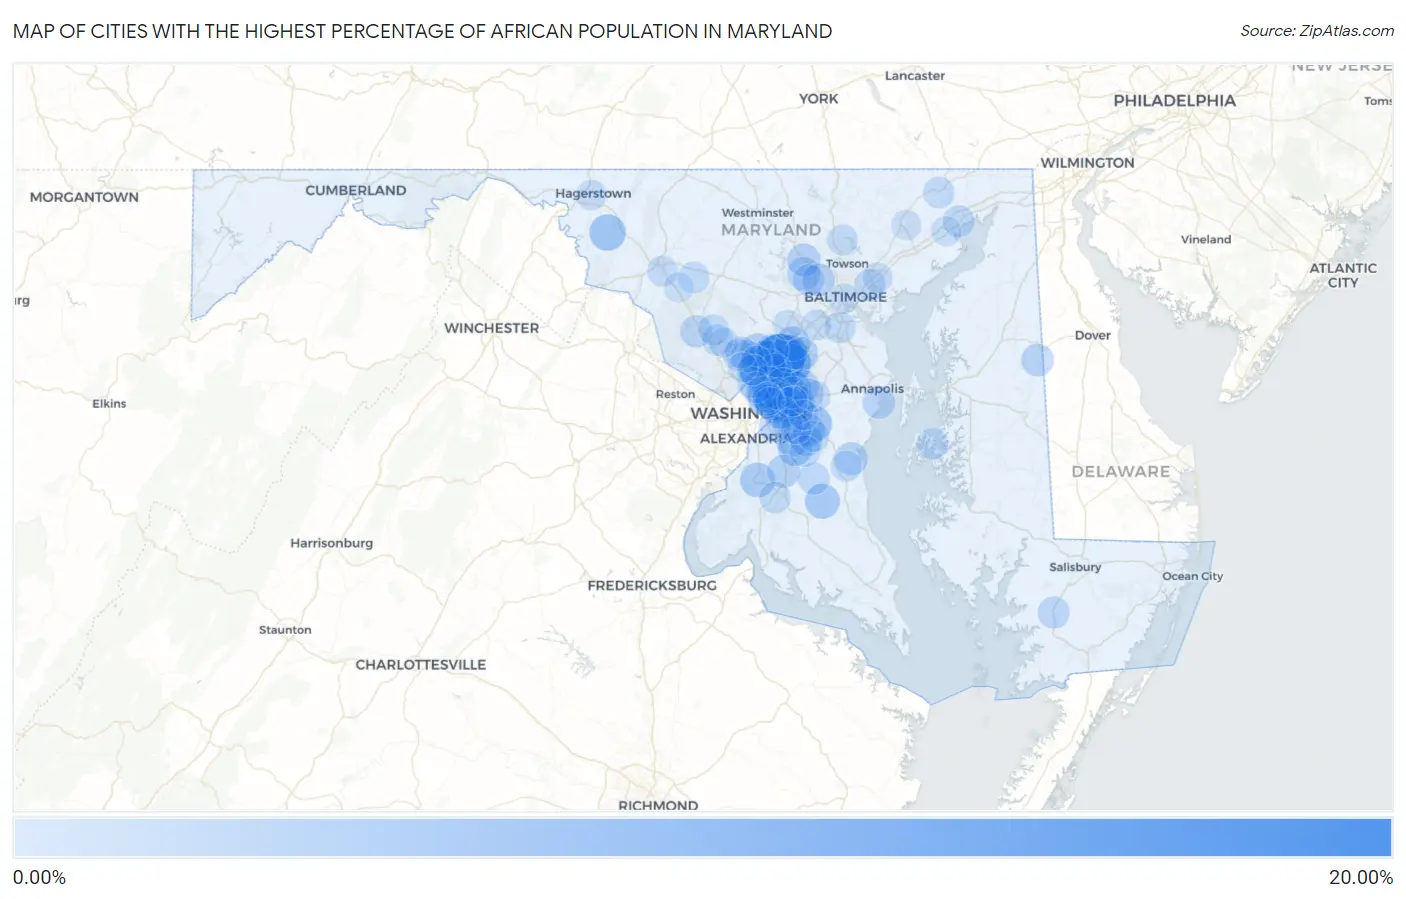
Map of Cities with the Highest Percentage of African Population in Maryland
0.00%
20.00%
Cities with the Highest Percentage of African Population in Maryland
| City | African | vs State | vs National | |
| 1. | Konterra | 15.79% | 1.47%(+14.3)#1 | 0.57%(+15.2)#52 |
| 2. | Bladensburg | 10.70% | 1.47%(+9.23)#2 | 0.57%(+10.1)#93 |
| 3. | White Oak | 9.83% | 1.47%(+8.36)#3 | 0.57%(+9.26)#107 |
| 4. | New Carrollton | 8.60% | 1.47%(+7.13)#4 | 0.57%(+8.04)#132 |
| 5. | South Laurel | 8.28% | 1.47%(+6.82)#5 | 0.57%(+7.72)#142 |
| 6. | Fairland | 8.10% | 1.47%(+6.63)#6 | 0.57%(+7.53)#148 |
| 7. | Seabrook | 6.80% | 1.47%(+5.33)#7 | 0.57%(+6.23)#205 |
| 8. | Laurel | 6.54% | 1.47%(+5.07)#8 | 0.57%(+5.98)#215 |
| 9. | Landover | 6.47% | 1.47%(+5.00)#9 | 0.57%(+5.91)#218 |
| 10. | Brock Hall | 5.94% | 1.47%(+4.47)#10 | 0.57%(+5.37)#245 |
| 11. | Boonsboro | 5.92% | 1.47%(+4.45)#11 | 0.57%(+5.35)#246 |
| 12. | Adelphi | 5.34% | 1.47%(+3.87)#12 | 0.57%(+4.78)#290 |
| 13. | Lake Arbor | 5.26% | 1.47%(+3.79)#13 | 0.57%(+4.70)#296 |
| 14. | Aquasco | 4.99% | 1.47%(+3.53)#14 | 0.57%(+4.43)#324 |
| 15. | Summerfield | 4.99% | 1.47%(+3.52)#15 | 0.57%(+4.42)#325 |
| 16. | Accokeek | 4.79% | 1.47%(+3.33)#16 | 0.57%(+4.23)#338 |
| 17. | North Laurel | 4.79% | 1.47%(+3.32)#17 | 0.57%(+4.23)#339 |
| 18. | Edmonston | 4.51% | 1.47%(+3.04)#18 | 0.57%(+3.95)#374 |
| 19. | Rosaryville | 4.51% | 1.47%(+3.04)#19 | 0.57%(+3.94)#375 |
| 20. | Mount Rainier | 4.45% | 1.47%(+2.99)#20 | 0.57%(+3.89)#382 |
| 21. | Calverton | 4.43% | 1.47%(+2.96)#21 | 0.57%(+3.87)#385 |
| 22. | Maryland City | 4.15% | 1.47%(+2.68)#22 | 0.57%(+3.58)#421 |
| 23. | Brown Station | 4.08% | 1.47%(+2.62)#23 | 0.57%(+3.52)#428 |
| 24. | Melwood | 3.93% | 1.47%(+2.46)#24 | 0.57%(+3.36)#443 |
| 25. | Glenn Dale | 3.92% | 1.47%(+2.45)#25 | 0.57%(+3.35)#446 |
| 26. | Cloverly | 3.77% | 1.47%(+2.30)#26 | 0.57%(+3.20)#461 |
| 27. | Chillum | 3.74% | 1.47%(+2.27)#27 | 0.57%(+3.17)#467 |
| 28. | Randallstown | 3.71% | 1.47%(+2.24)#28 | 0.57%(+3.14)#469 |
| 29. | Friendship | 3.68% | 1.47%(+2.21)#29 | 0.57%(+3.12)#474 |
| 30. | Owings Mills | 3.68% | 1.47%(+2.21)#30 | 0.57%(+3.11)#476 |
| 31. | Mitchellville | 3.68% | 1.47%(+2.21)#31 | 0.57%(+3.11)#477 |
| 32. | Beltsville | 3.56% | 1.47%(+2.10)#32 | 0.57%(+3.00)#496 |
| 33. | Brandywine | 3.55% | 1.47%(+2.08)#33 | 0.57%(+2.98)#497 |
| 34. | Lochearn | 3.53% | 1.47%(+2.07)#34 | 0.57%(+2.97)#501 |
| 35. | Peppermill Village | 3.50% | 1.47%(+2.03)#35 | 0.57%(+2.93)#510 |
| 36. | Landover Hills | 3.45% | 1.47%(+1.98)#36 | 0.57%(+2.88)#517 |
| 37. | Marlboro Village | 3.41% | 1.47%(+1.94)#37 | 0.57%(+2.84)#521 |
| 38. | Henderson | 3.36% | 1.47%(+1.89)#38 | 0.57%(+2.79)#532 |
| 39. | Queensland | 3.34% | 1.47%(+1.88)#39 | 0.57%(+2.78)#534 |
| 40. | Burtonsville | 3.25% | 1.47%(+1.78)#40 | 0.57%(+2.68)#553 |
| 41. | Highland Beach | 3.23% | 1.47%(+1.76)#41 | 0.57%(+2.66)#561 |
| 42. | Seat Pleasant | 3.19% | 1.47%(+1.72)#42 | 0.57%(+2.63)#572 |
| 43. | Layhill | 3.12% | 1.47%(+1.65)#43 | 0.57%(+2.56)#593 |
| 44. | Germantown | 3.06% | 1.47%(+1.59)#44 | 0.57%(+2.49)#608 |
| 45. | Largo | 2.98% | 1.47%(+1.51)#45 | 0.57%(+2.41)#636 |
| 46. | Princess Anne | 2.88% | 1.47%(+1.41)#46 | 0.57%(+2.31)#663 |
| 47. | Aspen Hill | 2.86% | 1.47%(+1.39)#47 | 0.57%(+2.30)#667 |
| 48. | Suitland | 2.86% | 1.47%(+1.39)#48 | 0.57%(+2.29)#669 |
| 49. | Hyattsville | 2.84% | 1.47%(+1.38)#49 | 0.57%(+2.28)#673 |
| 50. | Leisure World | 2.75% | 1.47%(+1.28)#50 | 0.57%(+2.19)#699 |
| 51. | Havre De Grace | 2.70% | 1.47%(+1.23)#51 | 0.57%(+2.13)#714 |
| 52. | Lanham | 2.69% | 1.47%(+1.22)#52 | 0.57%(+2.13)#716 |
| 53. | Baden | 2.68% | 1.47%(+1.21)#53 | 0.57%(+2.12)#720 |
| 54. | Milford Mill | 2.60% | 1.47%(+1.13)#54 | 0.57%(+2.04)#744 |
| 55. | East Riverdale | 2.57% | 1.47%(+1.10)#55 | 0.57%(+2.00)#758 |
| 56. | St Michaels | 2.56% | 1.47%(+1.09)#56 | 0.57%(+2.00)#761 |
| 57. | Rosedale | 2.55% | 1.47%(+1.09)#57 | 0.57%(+1.99)#763 |
| 58. | Monrovia | 2.55% | 1.47%(+1.08)#58 | 0.57%(+1.98)#766 |
| 59. | Darlington | 2.51% | 1.47%(+1.04)#59 | 0.57%(+1.95)#781 |
| 60. | Greenbelt | 2.50% | 1.47%(+1.03)#60 | 0.57%(+1.93)#790 |
| 61. | Silver Spring | 2.47% | 1.47%(+1.01)#61 | 0.57%(+1.91)#799 |
| 62. | Marlton | 2.44% | 1.47%(+0.971)#62 | 0.57%(+1.87)#811 |
| 63. | Ferndale | 2.36% | 1.47%(+0.896)#63 | 0.57%(+1.80)#837 |
| 64. | Waldorf | 2.34% | 1.47%(+0.875)#64 | 0.57%(+1.78)#845 |
| 65. | Cottage City | 2.33% | 1.47%(+0.864)#65 | 0.57%(+1.77)#850 |
| 66. | Washington Grove | 2.32% | 1.47%(+0.850)#66 | 0.57%(+1.75)#860 |
| 67. | Owings | 2.31% | 1.47%(+0.847)#67 | 0.57%(+1.75)#861 |
| 68. | Bowie | 2.31% | 1.47%(+0.842)#68 | 0.57%(+1.74)#864 |
| 69. | Upper Marlboro | 2.24% | 1.47%(+0.772)#69 | 0.57%(+1.67)#888 |
| 70. | Montgomery Village | 2.20% | 1.47%(+0.731)#70 | 0.57%(+1.63)#914 |
| 71. | Colesville | 2.19% | 1.47%(+0.722)#71 | 0.57%(+1.62)#922 |
| 72. | Ballenger Creek | 2.16% | 1.47%(+0.691)#72 | 0.57%(+1.59)#938 |
| 73. | Woodlawn Cdp Baltimore County | 2.14% | 1.47%(+0.677)#73 | 0.57%(+1.58)#942 |
| 74. | Takoma Park | 2.14% | 1.47%(+0.670)#74 | 0.57%(+1.57)#945 |
| 75. | Cockeysville | 2.10% | 1.47%(+0.632)#75 | 0.57%(+1.53)#970 |
| 76. | Kemp Mill | 2.06% | 1.47%(+0.597)#76 | 0.57%(+1.50)#986 |
| 77. | Glenarden | 2.00% | 1.47%(+0.537)#77 | 0.57%(+1.44)#1,025 |
| 78. | Burnt Mills | 1.97% | 1.47%(+0.499)#78 | 0.57%(+1.40)#1,044 |
| 79. | Flower Hill | 1.94% | 1.47%(+0.474)#79 | 0.57%(+1.38)#1,063 |
| 80. | Elkridge | 1.92% | 1.47%(+0.453)#80 | 0.57%(+1.36)#1,077 |
| 81. | Fairwood | 1.89% | 1.47%(+0.427)#81 | 0.57%(+1.33)#1,092 |
| 82. | Hagerstown | 1.88% | 1.47%(+0.409)#82 | 0.57%(+1.31)#1,104 |
| 83. | Brentwood | 1.82% | 1.47%(+0.357)#83 | 0.57%(+1.26)#1,134 |
| 84. | Westphalia | 1.82% | 1.47%(+0.353)#84 | 0.57%(+1.26)#1,136 |
| 85. | Colmar Manor | 1.78% | 1.47%(+0.313)#85 | 0.57%(+1.22)#1,163 |
| 86. | Forestville | 1.75% | 1.47%(+0.282)#86 | 0.57%(+1.18)#1,183 |
| 87. | Wildewood | 1.73% | 1.47%(+0.267)#87 | 0.57%(+1.17)#1,195 |
| 88. | Baltimore | 1.71% | 1.47%(+0.245)#88 | 0.57%(+1.15)#1,212 |
| 89. | Rossville | 1.71% | 1.47%(+0.242)#89 | 0.57%(+1.14)#1,216 |
| 90. | Romancoke | 1.70% | 1.47%(+0.236)#90 | 0.57%(+1.14)#1,220 |
| 91. | Abingdon | 1.68% | 1.47%(+0.215)#91 | 0.57%(+1.12)#1,241 |
| 92. | Kettering | 1.66% | 1.47%(+0.190)#92 | 0.57%(+1.09)#1,264 |
| 93. | Columbia | 1.65% | 1.47%(+0.184)#93 | 0.57%(+1.09)#1,274 |
| 94. | Ten Mile Creek | 1.64% | 1.47%(+0.176)#94 | 0.57%(+1.08)#1,283 |
| 95. | Wheaton | 1.61% | 1.47%(+0.145)#95 | 0.57%(+1.05)#1,314 |
| 96. | Aberdeen | 1.58% | 1.47%(+0.110)#96 | 0.57%(+1.01)#1,344 |
| 97. | Springdale | 1.54% | 1.47%(+0.068)#97 | 0.57%(+0.970)#1,372 |
| 98. | Bel Air | 1.53% | 1.47%(+0.066)#98 | 0.57%(+0.968)#1,375 |
| 99. | Urbana | 1.53% | 1.47%(+0.058)#99 | 0.57%(+0.960)#1,382 |
| 100. | Redland | 1.50% | 1.47%(+0.031)#100 | 0.57%(+0.934)#1,408 |
Common Questions
What are the Top 10 Cities with the Highest Percentage of African Population in Maryland?
Top 10 Cities with the Highest Percentage of African Population in Maryland are:
#1
15.79%
#2
10.70%
#3
9.83%
#4
8.60%
#5
8.28%
#6
8.10%
#7
6.80%
#8
6.54%
#9
6.47%
#10
5.94%
What city has the Highest Percentage of African Population in Maryland?
Konterra has the Highest Percentage of African Population in Maryland with 15.79%.
What is the Percentage of African Population in the State of Maryland?
Percentage of African Population in Maryland is 1.47%.
What is the Percentage of African Population in the United States?
Percentage of African Population in the United States is 0.57%.