Temescal Valley, CA Map & Demographics
Temescal Valley Map
Temescal Valley Overview
$49,432
PER CAPITA INCOME
$131,303
AVG FAMILY INCOME
$116,672
AVG HOUSEHOLD INCOME
37.0%
WAGE / INCOME GAP [ % ]
63.0¢/ $1
WAGE / INCOME GAP [ $ ]
0.45
INEQUALITY / GINI INDEX
28,227
TOTAL POPULATION
13,957
MALE POPULATION
14,270
FEMALE POPULATION
97.81
MALES / 100 FEMALES
102.24
FEMALES / 100 MALES
39.7
MEDIAN AGE
3.6
AVG FAMILY SIZE
3.1
AVG HOUSEHOLD SIZE
13,591
LABOR FORCE [ PEOPLE ]
61.9%
PERCENT IN LABOR FORCE
5.1%
UNEMPLOYMENT RATE
Temescal Valley Area Codes
Income in Temescal Valley
Income Overview in Temescal Valley
Per Capita Income in Temescal Valley is $49,432, while median incomes of families and households are $131,303 and $116,672 respectively.
| Characteristic | Number | Measure |
| Per Capita Income | 28,227 | $49,432 |
| Median Family Income | 6,904 | $131,303 |
| Mean Family Income | 6,904 | $168,062 |
| Median Household Income | 9,000 | $116,672 |
| Mean Household Income | 9,000 | $150,656 |
| Income Deficit | 6,904 | $0 |
| Wage / Income Gap (%) | 28,227 | 36.98% |
| Wage / Income Gap ($) | 28,227 | 63.02¢ per $1 |
| Gini / Inequality Index | 28,227 | 0.45 |
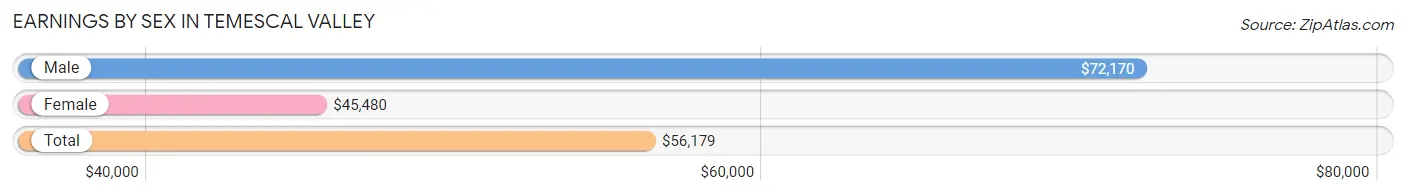
Earnings by Sex in Temescal Valley
Average Earnings in Temescal Valley are $56,179, $72,170 for men and $45,480 for women, a difference of 37.0%.
| Sex | Number | Average Earnings |
| Male | 7,604 (55.8%) | $72,170 |
| Female | 6,028 (44.2%) | $45,480 |
| Total | 13,632 (100.0%) | $56,179 |
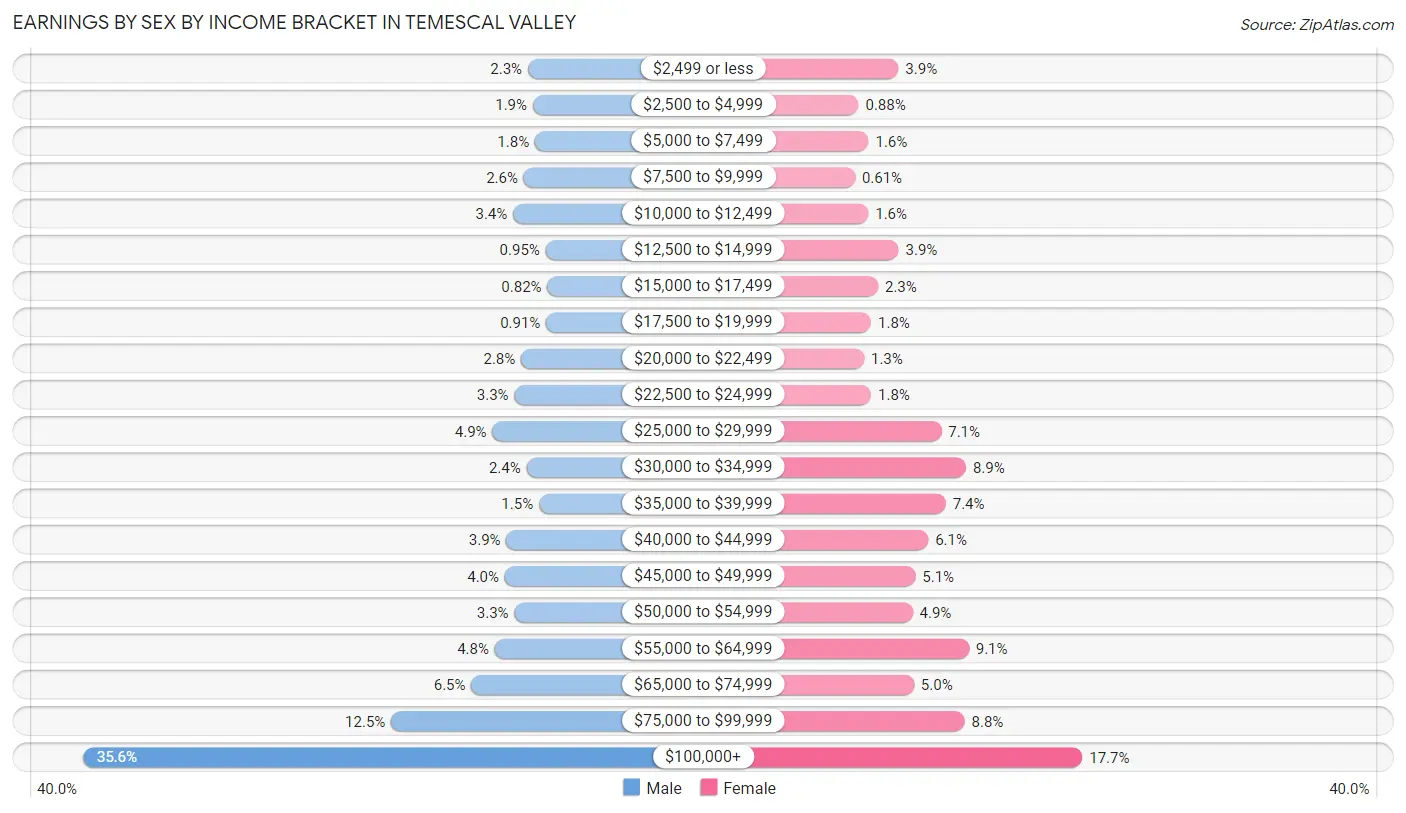
Earnings by Sex by Income Bracket in Temescal Valley
The most common earnings brackets in Temescal Valley are $100,000+ for men (2,704 | 35.6%) and $100,000+ for women (1,064 | 17.6%).
| Income | Male | Female |
| $2,499 or less | 173 (2.3%) | 233 (3.9%) |
| $2,500 to $4,999 | 145 (1.9%) | 53 (0.9%) |
| $5,000 to $7,499 | 133 (1.8%) | 98 (1.6%) |
| $7,500 to $9,999 | 197 (2.6%) | 37 (0.6%) |
| $10,000 to $12,499 | 258 (3.4%) | 97 (1.6%) |
| $12,500 to $14,999 | 72 (0.9%) | 234 (3.9%) |
| $15,000 to $17,499 | 62 (0.8%) | 141 (2.3%) |
| $17,500 to $19,999 | 69 (0.9%) | 110 (1.8%) |
| $20,000 to $22,499 | 212 (2.8%) | 78 (1.3%) |
| $22,500 to $24,999 | 250 (3.3%) | 110 (1.8%) |
| $25,000 to $29,999 | 376 (4.9%) | 427 (7.1%) |
| $30,000 to $34,999 | 181 (2.4%) | 538 (8.9%) |
| $35,000 to $39,999 | 110 (1.5%) | 447 (7.4%) |
| $40,000 to $44,999 | 296 (3.9%) | 368 (6.1%) |
| $45,000 to $49,999 | 305 (4.0%) | 310 (5.1%) |
| $50,000 to $54,999 | 250 (3.3%) | 297 (4.9%) |
| $55,000 to $64,999 | 362 (4.8%) | 551 (9.1%) |
| $65,000 to $74,999 | 496 (6.5%) | 303 (5.0%) |
| $75,000 to $99,999 | 953 (12.5%) | 532 (8.8%) |
| $100,000+ | 2,704 (35.6%) | 1,064 (17.6%) |
| Total | 7,604 (100.0%) | 6,028 (100.0%) |
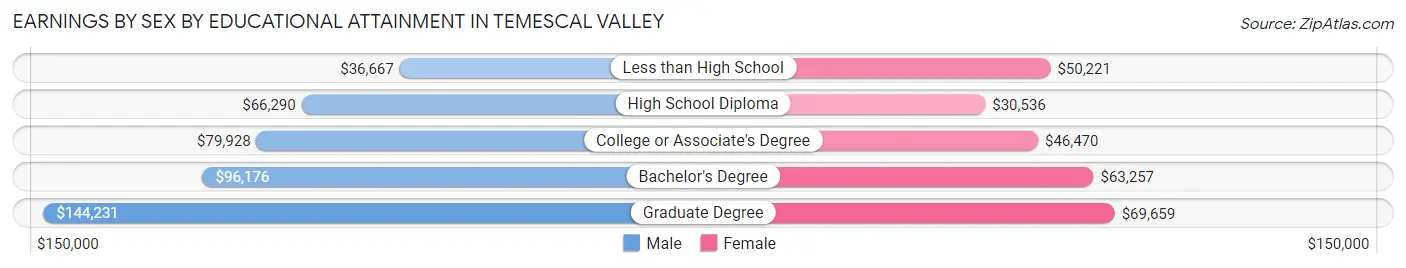
Earnings by Sex by Educational Attainment in Temescal Valley
Average earnings in Temescal Valley are $79,118 for men and $50,096 for women, a difference of 36.7%. Men with an educational attainment of graduate degree enjoy the highest average annual earnings of $144,231, while those with less than high school education earn the least with $36,667. Women with an educational attainment of graduate degree earn the most with the average annual earnings of $69,659, while those with high school diploma education have the smallest earnings of $30,536.
| Educational Attainment | Male Income | Female Income |
| Less than High School | $36,667 | $50,221 |
| High School Diploma | $66,290 | $30,536 |
| College or Associate's Degree | $79,928 | $46,470 |
| Bachelor's Degree | $96,176 | $63,257 |
| Graduate Degree | $144,231 | $69,659 |
| Total | $79,118 | $50,096 |
Family Income in Temescal Valley
Family Income Brackets in Temescal Valley
According to the Temescal Valley family income data, there are 1,712 families falling into the $100,000 to $149,999 income range, which is the most common income bracket and makes up 24.8% of all families. Conversely, the less than $10,000 income bracket is the least frequent group with only 69 families (1.0%) belonging to this category.
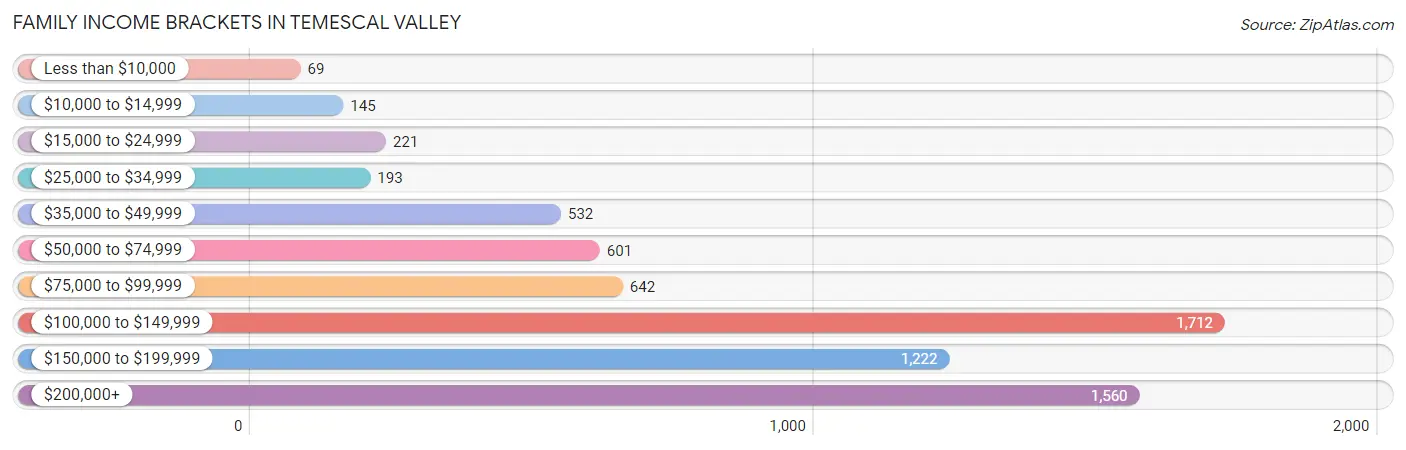
| Income Bracket | # Families | % Families |
| Less than $10,000 | 69 | 1.0% |
| $10,000 to $14,999 | 145 | 2.1% |
| $15,000 to $24,999 | 221 | 3.2% |
| $25,000 to $34,999 | 193 | 2.8% |
| $35,000 to $49,999 | 532 | 7.7% |
| $50,000 to $74,999 | 601 | 8.7% |
| $75,000 to $99,999 | 642 | 9.3% |
| $100,000 to $149,999 | 1,712 | 24.8% |
| $150,000 to $199,999 | 1,222 | 17.7% |
| $200,000+ | 1,560 | 22.6% |
Family Income by Famaliy Size in Temescal Valley
6-person families (253 | 3.7%) account for the highest median family income in Temescal Valley with $250,001 per family, while 2-person families (2,458 | 35.6%) have the highest median income of $57,746 per family member.
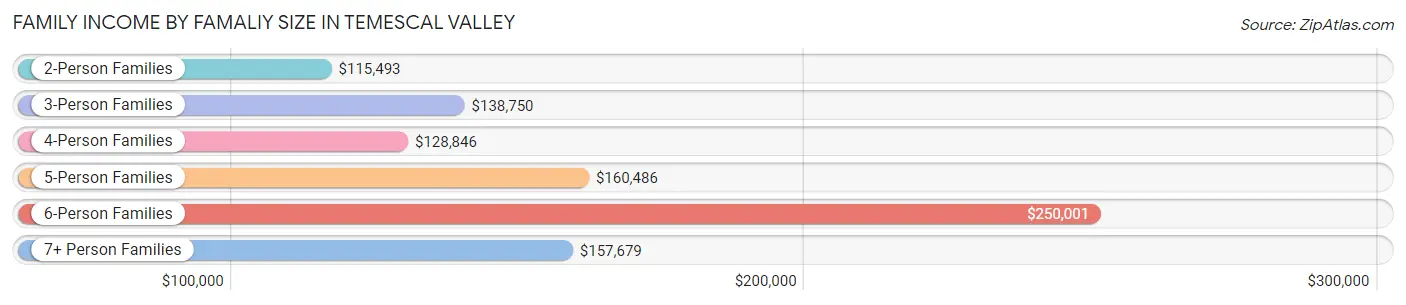
| Income Bracket | # Families | Median Income |
| 2-Person Families | 2,458 (35.6%) | $115,493 |
| 3-Person Families | 1,398 (20.3%) | $138,750 |
| 4-Person Families | 1,846 (26.7%) | $128,846 |
| 5-Person Families | 673 (9.8%) | $160,486 |
| 6-Person Families | 253 (3.7%) | $250,001 |
| 7+ Person Families | 276 (4.0%) | $157,679 |
| Total | 6,904 (100.0%) | $131,303 |
Family Income by Number of Earners in Temescal Valley
The median family income in Temescal Valley is $131,303, with families comprising 3+ earners (947) having the highest median family income of $179,323, while families with no earners (1,035) have the lowest median family income of $61,875, accounting for 13.7% and 15.0% of families, respectively.
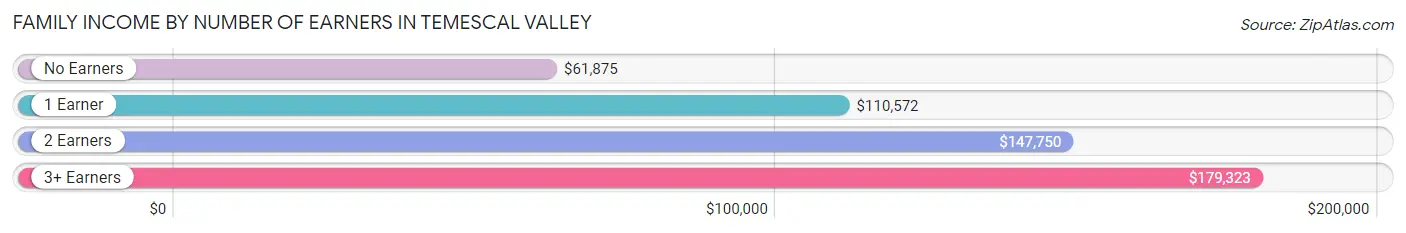
| Number of Earners | # Families | Median Income |
| No Earners | 1,035 (15.0%) | $61,875 |
| 1 Earner | 1,899 (27.5%) | $110,572 |
| 2 Earners | 3,023 (43.8%) | $147,750 |
| 3+ Earners | 947 (13.7%) | $179,323 |
| Total | 6,904 (100.0%) | $131,303 |
Household Income in Temescal Valley
Household Income Brackets in Temescal Valley
With 2,259 households falling in the category, the $100,000 to $149,999 income range is the most frequent in Temescal Valley, accounting for 25.1% of all households. In contrast, only 171 households (1.9%) fall into the $10,000 to $14,999 income bracket, making it the least populous group.
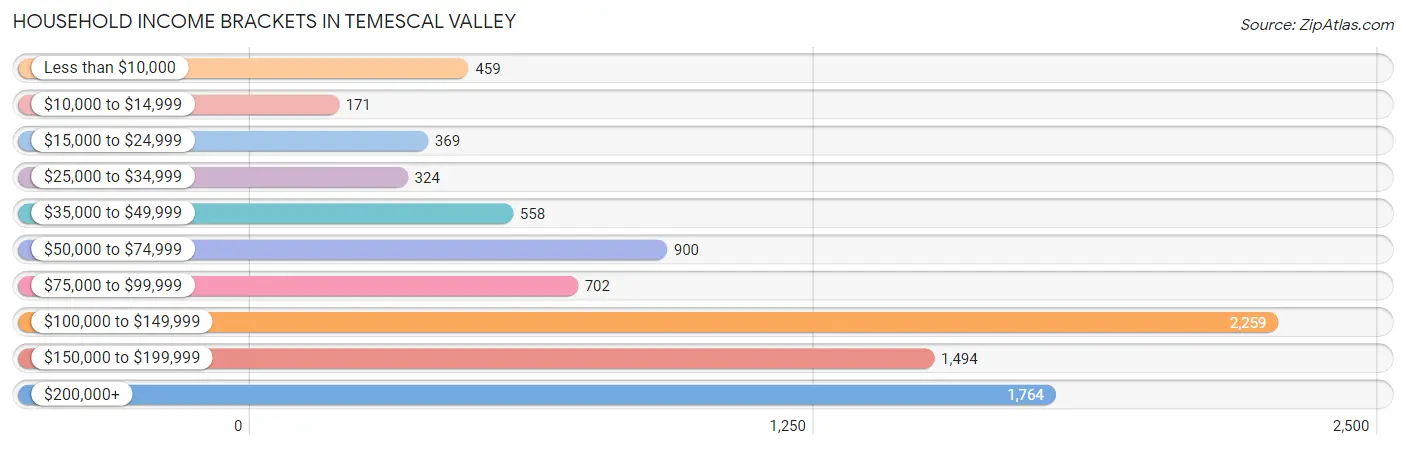
| Income Bracket | # Households | % Households |
| Less than $10,000 | 459 | 5.1% |
| $10,000 to $14,999 | 171 | 1.9% |
| $15,000 to $24,999 | 369 | 4.1% |
| $25,000 to $34,999 | 324 | 3.6% |
| $35,000 to $49,999 | 558 | 6.2% |
| $50,000 to $74,999 | 900 | 10.0% |
| $75,000 to $99,999 | 702 | 7.8% |
| $100,000 to $149,999 | 2,259 | 25.1% |
| $150,000 to $199,999 | 1,494 | 16.6% |
| $200,000+ | 1,764 | 19.6% |
Household Income by Householder Age in Temescal Valley
The median household income in Temescal Valley is $116,672, with the highest median household income of $134,360 found in the 25 to 44 years age bracket for the primary householder. A total of 2,264 households (25.2%) fall into this category. Meanwhile, the 15 to 24 years age bracket for the primary householder has the lowest median household income of $0, with 44 households (0.5%) in this group.
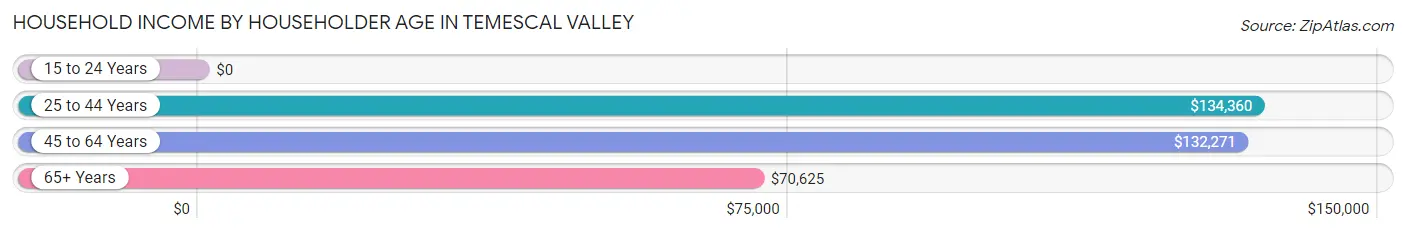
| Income Bracket | # Households | Median Income |
| 15 to 24 Years | 44 (0.5%) | $0 |
| 25 to 44 Years | 2,264 (25.2%) | $134,360 |
| 45 to 64 Years | 4,273 (47.5%) | $132,271 |
| 65+ Years | 2,419 (26.9%) | $70,625 |
| Total | 9,000 (100.0%) | $116,672 |
Poverty in Temescal Valley
Income Below Poverty by Sex and Age in Temescal Valley
With 7.6% poverty level for males and 5.3% for females among the residents of Temescal Valley, 75 year old and over males and 15 year old females are the most vulnerable to poverty, with 275 males (26.3%) and 21 females (18.6%) in their respective age groups living below the poverty level.
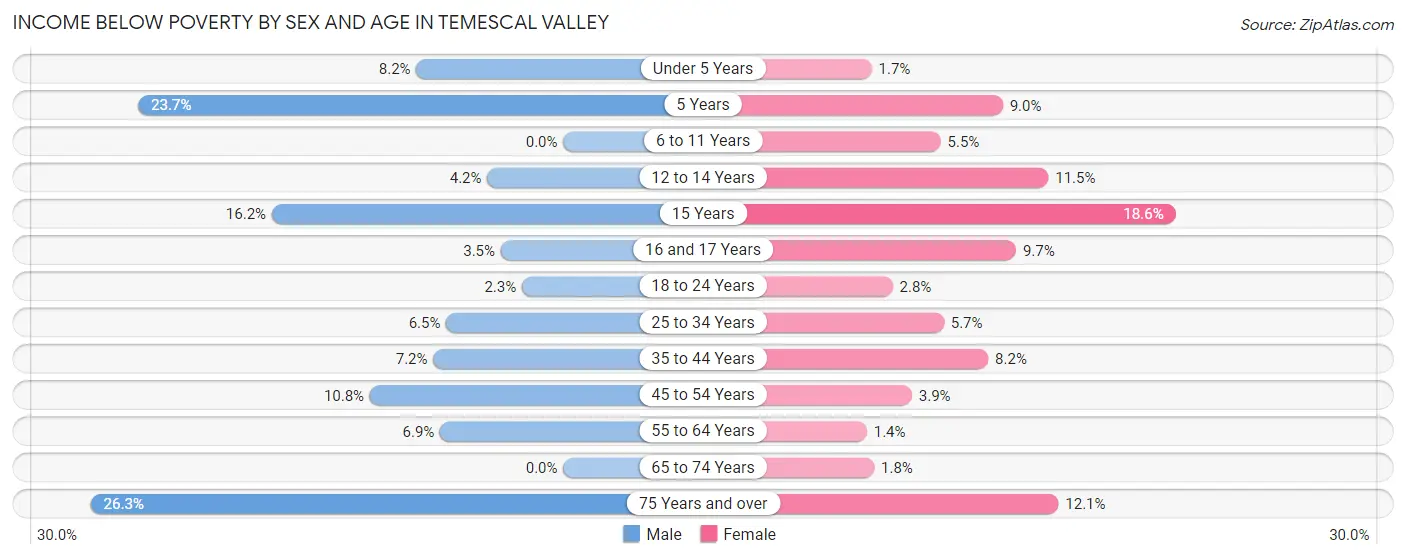
| Age Bracket | Male | Female |
| Under 5 Years | 72 (8.2%) | 16 (1.7%) |
| 5 Years | 27 (23.7%) | 18 (9.0%) |
| 6 to 11 Years | 0 (0.0%) | 74 (5.5%) |
| 12 to 14 Years | 30 (4.2%) | 72 (11.5%) |
| 15 Years | 31 (16.2%) | 21 (18.6%) |
| 16 and 17 Years | 7 (3.5%) | 59 (9.7%) |
| 18 to 24 Years | 32 (2.3%) | 29 (2.8%) |
| 25 to 34 Years | 112 (6.5%) | 91 (5.7%) |
| 35 to 44 Years | 113 (7.2%) | 156 (8.2%) |
| 45 to 54 Years | 248 (10.8%) | 85 (3.9%) |
| 55 to 64 Years | 112 (6.9%) | 23 (1.4%) |
| 65 to 74 Years | 0 (0.0%) | 22 (1.8%) |
| 75 Years and over | 275 (26.3%) | 93 (12.1%) |
| Total | 1,059 (7.6%) | 759 (5.3%) |
Income Above Poverty by Sex and Age in Temescal Valley
According to the poverty statistics in Temescal Valley, males aged 6 to 11 years and females aged 55 to 64 years are the age groups that are most secure financially, with 100.0% of males and 98.6% of females in these age groups living above the poverty line.
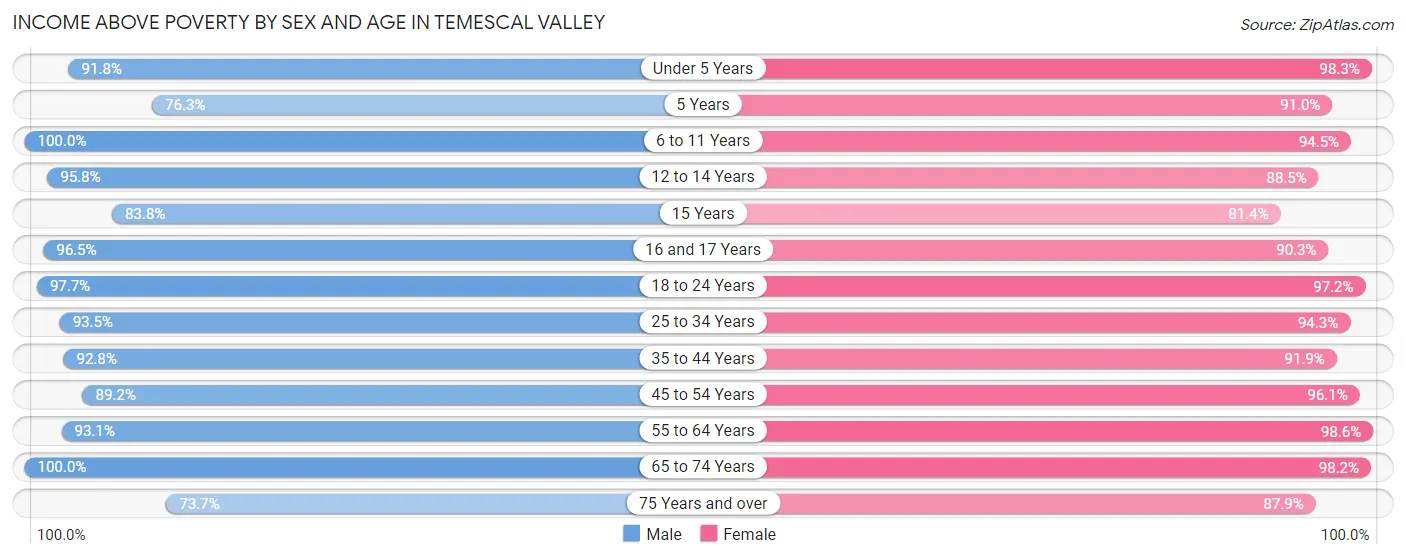
| Age Bracket | Male | Female |
| Under 5 Years | 808 (91.8%) | 948 (98.3%) |
| 5 Years | 87 (76.3%) | 183 (91.0%) |
| 6 to 11 Years | 1,082 (100.0%) | 1,272 (94.5%) |
| 12 to 14 Years | 680 (95.8%) | 554 (88.5%) |
| 15 Years | 160 (83.8%) | 92 (81.4%) |
| 16 and 17 Years | 194 (96.5%) | 549 (90.3%) |
| 18 to 24 Years | 1,357 (97.7%) | 996 (97.2%) |
| 25 to 34 Years | 1,605 (93.5%) | 1,510 (94.3%) |
| 35 to 44 Years | 1,448 (92.8%) | 1,757 (91.8%) |
| 45 to 54 Years | 2,054 (89.2%) | 2,096 (96.1%) |
| 55 to 64 Years | 1,521 (93.1%) | 1,630 (98.6%) |
| 65 to 74 Years | 1,132 (100.0%) | 1,203 (98.2%) |
| 75 Years and over | 770 (73.7%) | 678 (87.9%) |
| Total | 12,898 (92.4%) | 13,468 (94.7%) |
Income Below Poverty Among Married-Couple Families in Temescal Valley
The poverty statistics for married-couple families in Temescal Valley show that 4.5% or 269 of the total 6,023 families live below the poverty line. Families with 3 or 4 children have the highest poverty rate of 9.4%, comprising of 51 families. On the other hand, families with 5 or more children have the lowest poverty rate of 0.0%, which includes 0 families.
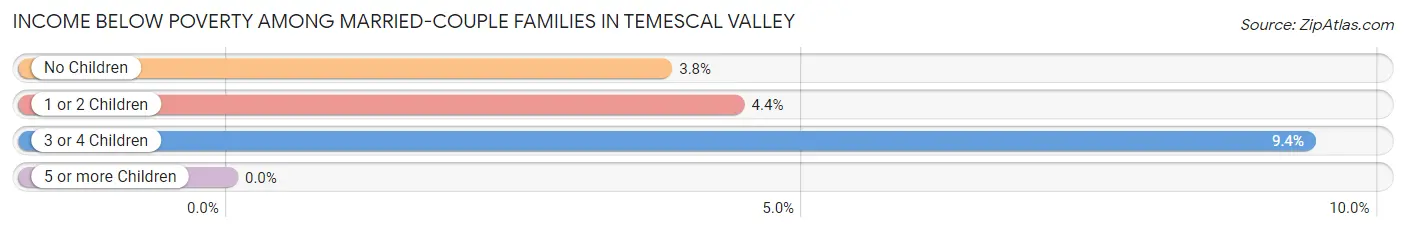
| Children | Above Poverty | Below Poverty |
| No Children | 2,854 (96.2%) | 112 (3.8%) |
| 1 or 2 Children | 2,297 (95.6%) | 106 (4.4%) |
| 3 or 4 Children | 493 (90.6%) | 51 (9.4%) |
| 5 or more Children | 110 (100.0%) | 0 (0.0%) |
| Total | 5,754 (95.5%) | 269 (4.5%) |
Income Below Poverty Among Single-Parent Households in Temescal Valley
According to the poverty data in Temescal Valley, 19.6% or 59 single-father households and 2.4% or 14 single-mother households are living below the poverty line. Among single-father households, those with 1 or 2 children have the highest poverty rate, with 50 households (63.3%) experiencing poverty. Likewise, among single-mother households, those with 3 or 4 children have the highest poverty rate, with 14 households (100.0%) falling below the poverty line.
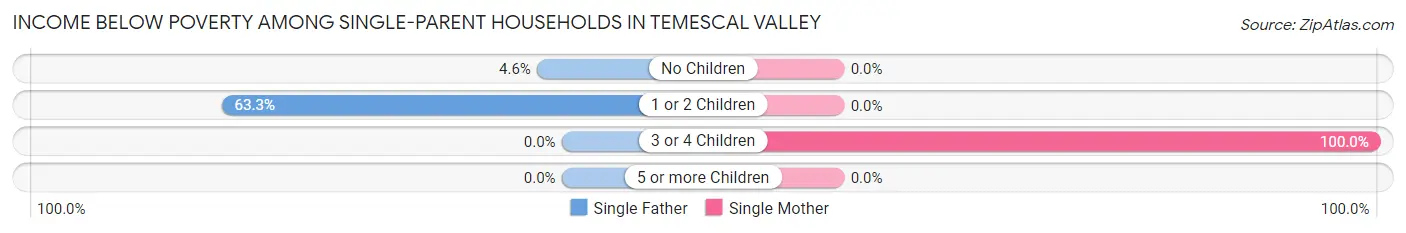
| Children | Single Father | Single Mother |
| No Children | 9 (4.6%) | 0 (0.0%) |
| 1 or 2 Children | 50 (63.3%) | 0 (0.0%) |
| 3 or 4 Children | 0 (0.0%) | 14 (100.0%) |
| 5 or more Children | 0 (0.0%) | 0 (0.0%) |
| Total | 59 (19.6%) | 14 (2.4%) |
Income Below Poverty Among Married-Couple vs Single-Parent Households in Temescal Valley
The poverty data for Temescal Valley shows that 269 of the married-couple family households (4.5%) and 73 of the single-parent households (8.3%) are living below the poverty level. Within the married-couple family households, those with 3 or 4 children have the highest poverty rate, with 51 households (9.4%) falling below the poverty line. Among the single-parent households, those with 3 or 4 children have the highest poverty rate, with 14 household (34.2%) living below poverty.
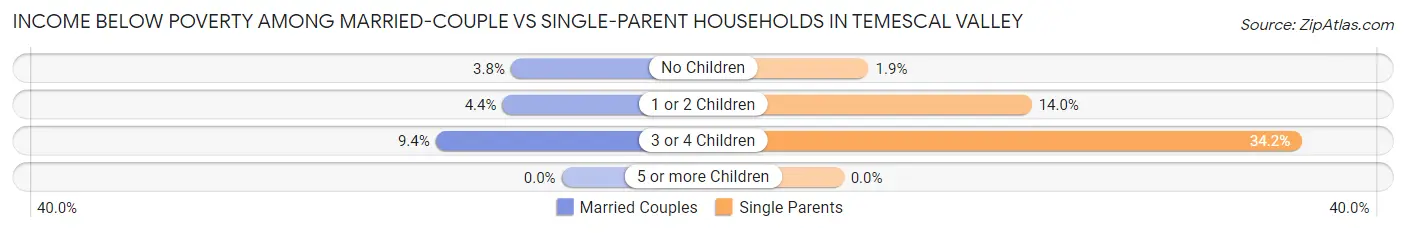
| Children | Married-Couple Families | Single-Parent Households |
| No Children | 112 (3.8%) | 9 (1.9%) |
| 1 or 2 Children | 106 (4.4%) | 50 (14.0%) |
| 3 or 4 Children | 51 (9.4%) | 14 (34.2%) |
| 5 or more Children | 0 (0.0%) | 0 (0.0%) |
| Total | 269 (4.5%) | 73 (8.3%) |
Race in Temescal Valley
The most populous races in Temescal Valley are White / Caucasian (15,340 | 54.3%), Hispanic or Latino (10,548 | 37.4%), and Two or more Races (3,921 | 13.9%).
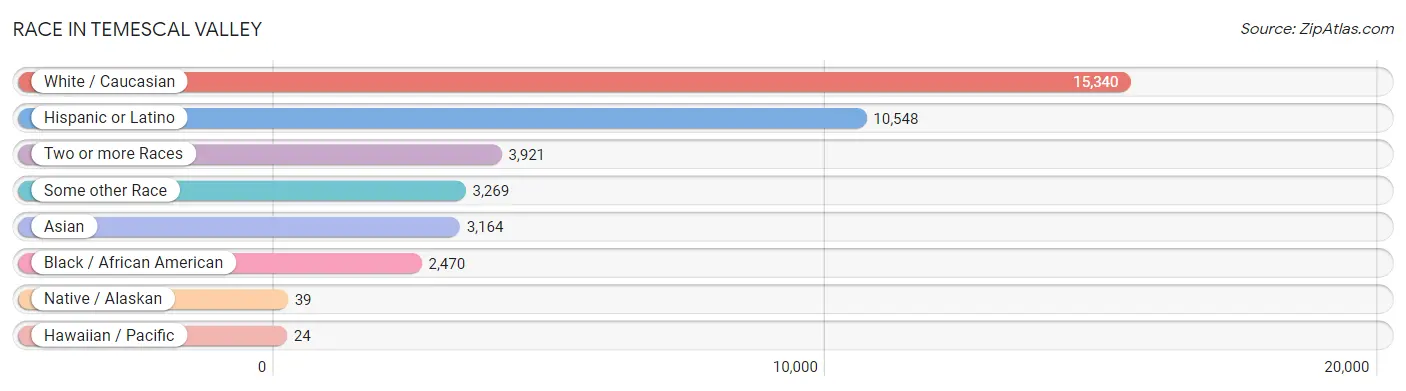
| Race | # Population | % Population |
| Asian | 3,164 | 11.2% |
| Black / African American | 2,470 | 8.7% |
| Hawaiian / Pacific | 24 | 0.1% |
| Hispanic or Latino | 10,548 | 37.4% |
| Native / Alaskan | 39 | 0.1% |
| White / Caucasian | 15,340 | 54.3% |
| Two or more Races | 3,921 | 13.9% |
| Some other Race | 3,269 | 11.6% |
| Total | 28,227 | 100.0% |
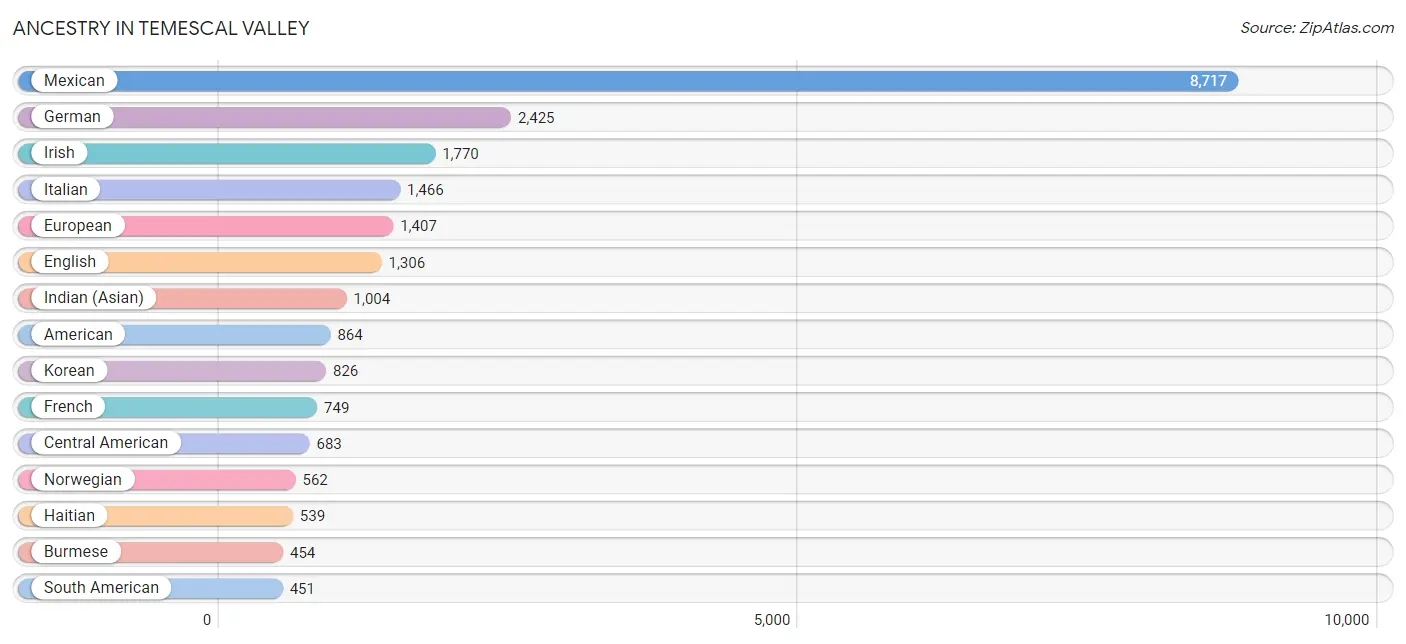
Ancestry in Temescal Valley
The most populous ancestries reported in Temescal Valley are Mexican (8,717 | 30.9%), German (2,425 | 8.6%), Irish (1,770 | 6.3%), Italian (1,466 | 5.2%), and European (1,407 | 5.0%), together accounting for 55.9% of all Temescal Valley residents.
| Ancestry | # Population | % Population |
| African | 263 | 0.9% |
| American | 864 | 3.1% |
| Arab | 78 | 0.3% |
| Argentinean | 26 | 0.1% |
| Armenian | 28 | 0.1% |
| Austrian | 97 | 0.3% |
| Belizean | 49 | 0.2% |
| Bhutanese | 179 | 0.6% |
| Bolivian | 9 | 0.0% |
| Brazilian | 18 | 0.1% |
| British | 257 | 0.9% |
| British West Indian | 42 | 0.2% |
| Bulgarian | 21 | 0.1% |
| Burmese | 454 | 1.6% |
| Canadian | 105 | 0.4% |
| Central American | 683 | 2.4% |
| Choctaw | 113 | 0.4% |
| Colombian | 103 | 0.4% |
| Costa Rican | 20 | 0.1% |
| Croatian | 48 | 0.2% |
| Cuban | 170 | 0.6% |
| Czech | 8 | 0.0% |
| Czechoslovakian | 23 | 0.1% |
| Danish | 35 | 0.1% |
| Dutch | 95 | 0.3% |
| Eastern European | 128 | 0.4% |
| Ecuadorian | 25 | 0.1% |
| English | 1,306 | 4.6% |
| European | 1,407 | 5.0% |
| French | 749 | 2.6% |
| French Canadian | 138 | 0.5% |
| German | 2,425 | 8.6% |
| Greek | 11 | 0.0% |
| Guamanian / Chamorro | 46 | 0.2% |
| Guatemalan | 191 | 0.7% |
| Haitian | 539 | 1.9% |
| Honduran | 39 | 0.1% |
| Hopi | 2 | 0.0% |
| Hungarian | 55 | 0.2% |
| Indian (Asian) | 1,004 | 3.6% |
| Iranian | 13 | 0.1% |
| Irish | 1,770 | 6.3% |
| Israeli | 18 | 0.1% |
| Italian | 1,466 | 5.2% |
| Japanese | 200 | 0.7% |
| Korean | 826 | 2.9% |
| Laotian | 51 | 0.2% |
| Lebanese | 16 | 0.1% |
| Malaysian | 135 | 0.5% |
| Mexican | 8,717 | 30.9% |
| Mexican American Indian | 6 | 0.0% |
| Navajo | 14 | 0.1% |
| Nicaraguan | 178 | 0.6% |
| Nigerian | 90 | 0.3% |
| Northern European | 54 | 0.2% |
| Norwegian | 562 | 2.0% |
| Pakistani | 58 | 0.2% |
| Peruvian | 142 | 0.5% |
| Polish | 242 | 0.9% |
| Portuguese | 338 | 1.2% |
| Puerto Rican | 314 | 1.1% |
| Romanian | 7 | 0.0% |
| Russian | 258 | 0.9% |
| Salvadoran | 255 | 0.9% |
| Samoan | 24 | 0.1% |
| Scandinavian | 16 | 0.1% |
| Scotch-Irish | 67 | 0.2% |
| Scottish | 330 | 1.2% |
| Seminole | 93 | 0.3% |
| Serbian | 105 | 0.4% |
| Slovak | 31 | 0.1% |
| Slovene | 44 | 0.2% |
| South African | 35 | 0.1% |
| South American | 451 | 1.6% |
| Spaniard | 171 | 0.6% |
| Spanish | 18 | 0.1% |
| Sri Lankan | 446 | 1.6% |
| Subsaharan African | 388 | 1.4% |
| Swedish | 185 | 0.7% |
| Swiss | 13 | 0.1% |
| Syrian | 24 | 0.1% |
| Thai | 283 | 1.0% |
| Ukrainian | 16 | 0.1% |
| Venezuelan | 146 | 0.5% |
| Vietnamese | 35 | 0.1% |
| Welsh | 201 | 0.7% | View All 86 Rows |
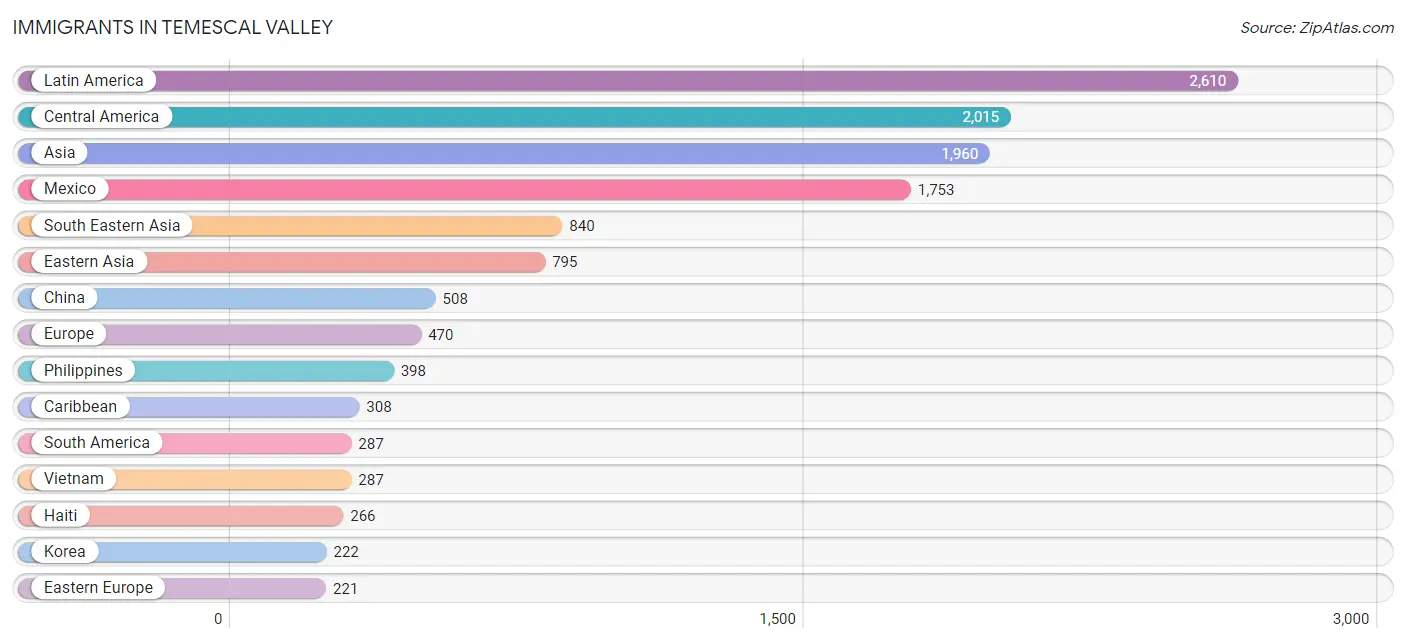
Immigrants in Temescal Valley
The most numerous immigrant groups reported in Temescal Valley came from Latin America (2,610 | 9.2%), Central America (2,015 | 7.1%), Asia (1,960 | 6.9%), Mexico (1,753 | 6.2%), and South Eastern Asia (840 | 3.0%), together accounting for 32.5% of all Temescal Valley residents.
| Immigration Origin | # Population | % Population |
| Africa | 138 | 0.5% |
| Argentina | 26 | 0.1% |
| Asia | 1,960 | 6.9% |
| Austria | 16 | 0.1% |
| Bangladesh | 28 | 0.1% |
| Belize | 49 | 0.2% |
| Brazil | 7 | 0.0% |
| Cambodia | 65 | 0.2% |
| Canada | 60 | 0.2% |
| Caribbean | 308 | 1.1% |
| Central America | 2,015 | 7.1% |
| China | 508 | 1.8% |
| Colombia | 53 | 0.2% |
| Eastern Africa | 6 | 0.0% |
| Eastern Asia | 795 | 2.8% |
| Eastern Europe | 221 | 0.8% |
| Ecuador | 14 | 0.1% |
| El Salvador | 52 | 0.2% |
| England | 11 | 0.0% |
| Europe | 470 | 1.7% |
| France | 17 | 0.1% |
| Germany | 39 | 0.1% |
| Grenada | 42 | 0.2% |
| Guatemala | 122 | 0.4% |
| Haiti | 266 | 0.9% |
| Honduras | 39 | 0.1% |
| India | 30 | 0.1% |
| Indonesia | 34 | 0.1% |
| Iraq | 7 | 0.0% |
| Ireland | 104 | 0.4% |
| Israel | 33 | 0.1% |
| Japan | 65 | 0.2% |
| Jordan | 8 | 0.0% |
| Korea | 222 | 0.8% |
| Kuwait | 15 | 0.1% |
| Latin America | 2,610 | 9.2% |
| Malaysia | 17 | 0.1% |
| Mexico | 1,753 | 6.2% |
| Nigeria | 49 | 0.2% |
| Northern Europe | 156 | 0.5% |
| Oceania | 12 | 0.0% |
| Pakistan | 148 | 0.5% |
| Peru | 156 | 0.5% |
| Philippines | 398 | 1.4% |
| Poland | 15 | 0.1% |
| Russia | 206 | 0.7% |
| Saudi Arabia | 17 | 0.1% |
| Scotland | 32 | 0.1% |
| South Africa | 46 | 0.2% |
| South America | 287 | 1.0% |
| South Central Asia | 221 | 0.8% |
| South Eastern Asia | 840 | 3.0% |
| Southern Europe | 21 | 0.1% |
| Spain | 21 | 0.1% |
| Sri Lanka | 15 | 0.1% |
| Syria | 24 | 0.1% |
| Taiwan | 129 | 0.5% |
| Thailand | 39 | 0.1% |
| Venezuela | 31 | 0.1% |
| Vietnam | 287 | 1.0% |
| Western Africa | 49 | 0.2% |
| Western Asia | 104 | 0.4% |
| Western Europe | 72 | 0.3% | View All 63 Rows |
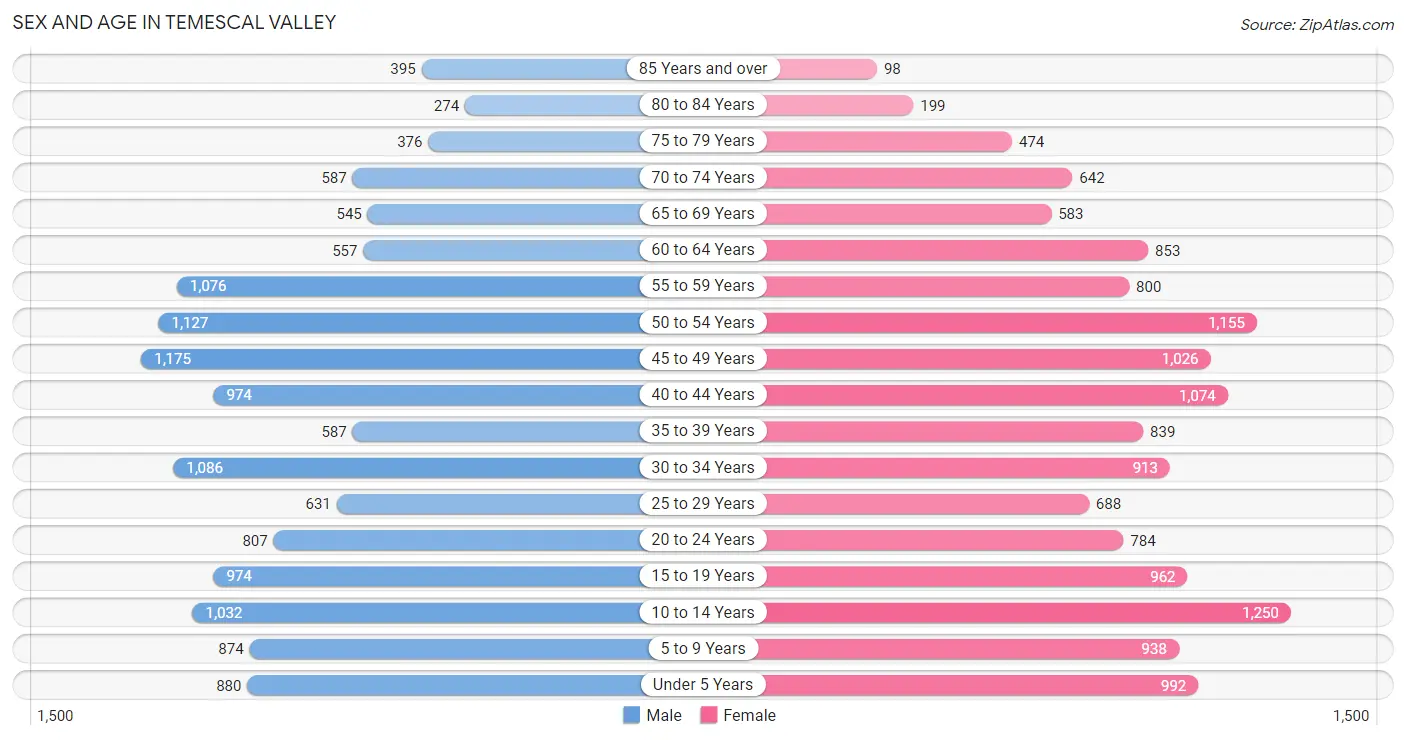
Sex and Age in Temescal Valley
Sex and Age in Temescal Valley
The most populous age groups in Temescal Valley are 45 to 49 Years (1,175 | 8.4%) for men and 10 to 14 Years (1,250 | 8.8%) for women.
| Age Bracket | Male | Female |
| Under 5 Years | 880 (6.3%) | 992 (7.0%) |
| 5 to 9 Years | 874 (6.3%) | 938 (6.6%) |
| 10 to 14 Years | 1,032 (7.4%) | 1,250 (8.8%) |
| 15 to 19 Years | 974 (7.0%) | 962 (6.7%) |
| 20 to 24 Years | 807 (5.8%) | 784 (5.5%) |
| 25 to 29 Years | 631 (4.5%) | 688 (4.8%) |
| 30 to 34 Years | 1,086 (7.8%) | 913 (6.4%) |
| 35 to 39 Years | 587 (4.2%) | 839 (5.9%) |
| 40 to 44 Years | 974 (7.0%) | 1,074 (7.5%) |
| 45 to 49 Years | 1,175 (8.4%) | 1,026 (7.2%) |
| 50 to 54 Years | 1,127 (8.1%) | 1,155 (8.1%) |
| 55 to 59 Years | 1,076 (7.7%) | 800 (5.6%) |
| 60 to 64 Years | 557 (4.0%) | 853 (6.0%) |
| 65 to 69 Years | 545 (3.9%) | 583 (4.1%) |
| 70 to 74 Years | 587 (4.2%) | 642 (4.5%) |
| 75 to 79 Years | 376 (2.7%) | 474 (3.3%) |
| 80 to 84 Years | 274 (2.0%) | 199 (1.4%) |
| 85 Years and over | 395 (2.8%) | 98 (0.7%) |
| Total | 13,957 (100.0%) | 14,270 (100.0%) |
Families and Households in Temescal Valley
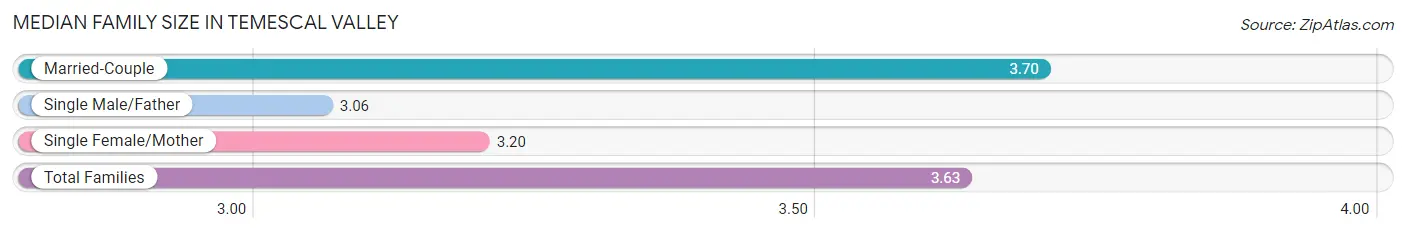
Median Family Size in Temescal Valley
The median family size in Temescal Valley is 3.63 persons per family, with married-couple families (6,023 | 87.2%) accounting for the largest median family size of 3.7 persons per family. On the other hand, single male/father families (301 | 4.4%) represent the smallest median family size with 3.06 persons per family.
| Family Type | # Families | Family Size |
| Married-Couple | 6,023 (87.2%) | 3.70 |
| Single Male/Father | 301 (4.4%) | 3.06 |
| Single Female/Mother | 580 (8.4%) | 3.20 |
| Total Families | 6,904 (100.0%) | 3.63 |
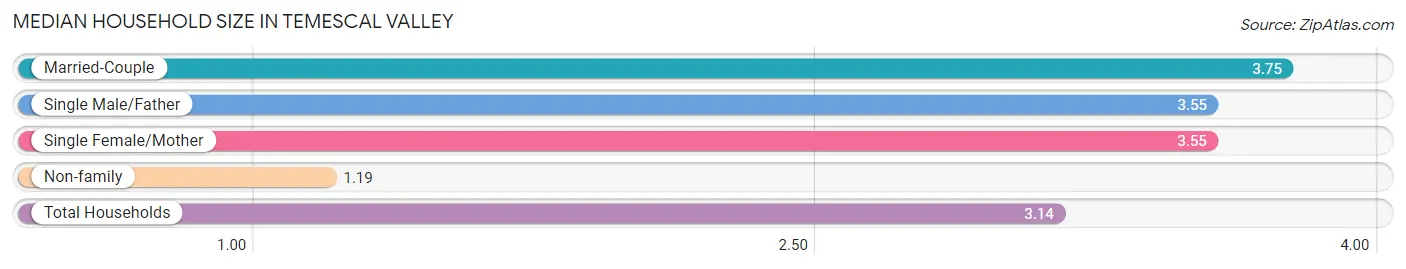
Median Household Size in Temescal Valley
The median household size in Temescal Valley is 3.14 persons per household, with married-couple households (6,023 | 66.9%) accounting for the largest median household size of 3.75 persons per household. non-family households (2,096 | 23.3%) represent the smallest median household size with 1.19 persons per household.
| Household Type | # Households | Household Size |
| Married-Couple | 6,023 (66.9%) | 3.75 |
| Single Male/Father | 301 (3.3%) | 3.55 |
| Single Female/Mother | 580 (6.4%) | 3.55 |
| Non-family | 2,096 (23.3%) | 1.19 |
| Total Households | 9,000 (100.0%) | 3.14 |
Household Size by Marriage Status in Temescal Valley
Out of a total of 9,000 households in Temescal Valley, 6,904 (76.7%) are family households, while 2,096 (23.3%) are nonfamily households. The most numerous type of family households are 2-person households, comprising 2,241, and the most common type of nonfamily households are 1-person households, comprising 1,802.
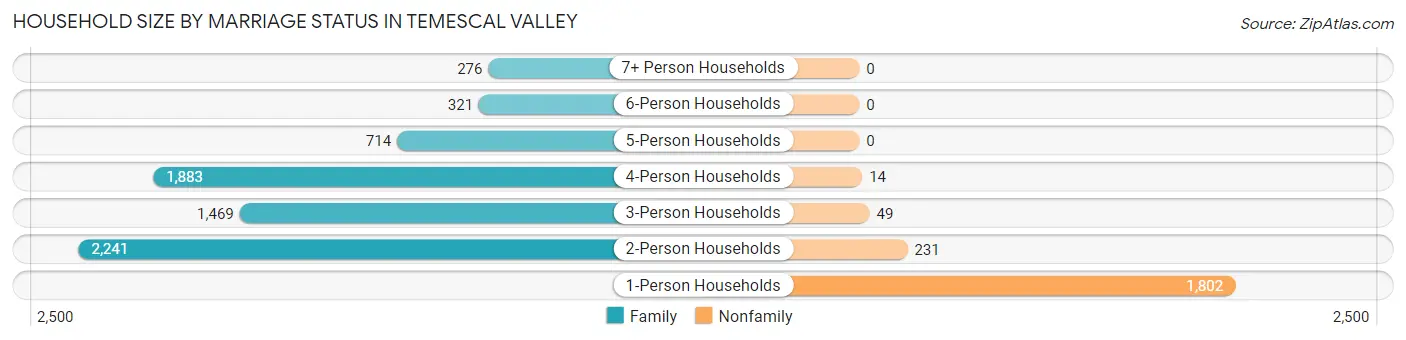
| Household Size | Family Households | Nonfamily Households |
| 1-Person Households | - | 1,802 (20.0%) |
| 2-Person Households | 2,241 (24.9%) | 231 (2.6%) |
| 3-Person Households | 1,469 (16.3%) | 49 (0.5%) |
| 4-Person Households | 1,883 (20.9%) | 14 (0.2%) |
| 5-Person Households | 714 (7.9%) | 0 (0.0%) |
| 6-Person Households | 321 (3.6%) | 0 (0.0%) |
| 7+ Person Households | 276 (3.1%) | 0 (0.0%) |
| Total | 6,904 (76.7%) | 2,096 (23.3%) |
Female Fertility in Temescal Valley
Fertility by Age in Temescal Valley
Average fertility rate in Temescal Valley is 42.0 births per 1,000 women. Women in the age bracket of 20 to 34 years have the highest fertility rate with 108.0 births per 1,000 women. Women in the age bracket of 20 to 34 years acount for 94.5% of all women with births.
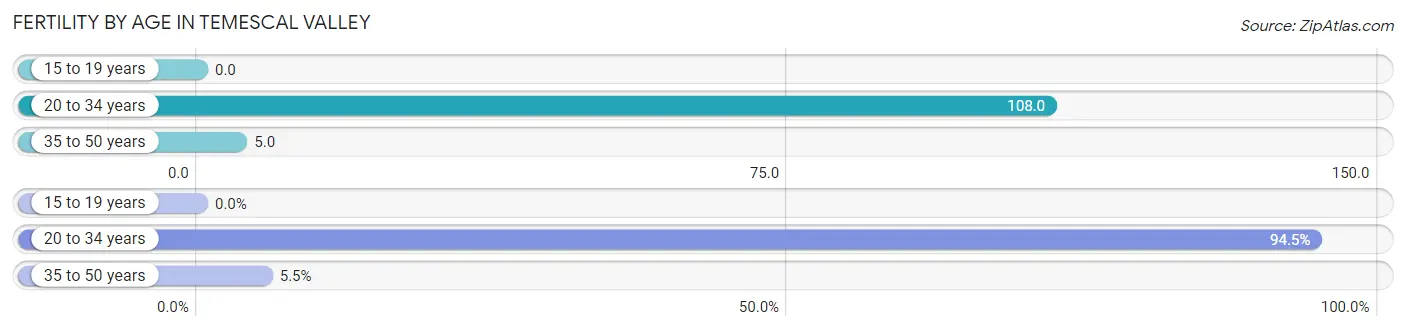
| Age Bracket | Women with Births | Births / 1,000 Women |
| 15 to 19 years | 0 (0.0%) | 0.0 |
| 20 to 34 years | 258 (94.5%) | 108.0 |
| 35 to 50 years | 15 (5.5%) | 5.0 |
| Total | 273 (100.0%) | 42.0 |
Fertility by Age by Marriage Status in Temescal Valley
44.3% of women with births (273) in Temescal Valley are married. The highest percentage of unmarried women with births falls into 20 to 34 years age bracket with 58.9% of them unmarried at the time of birth, while the lowest percentage of unmarried women with births belong to 35 to 50 years age bracket with 0.0% of them unmarried.
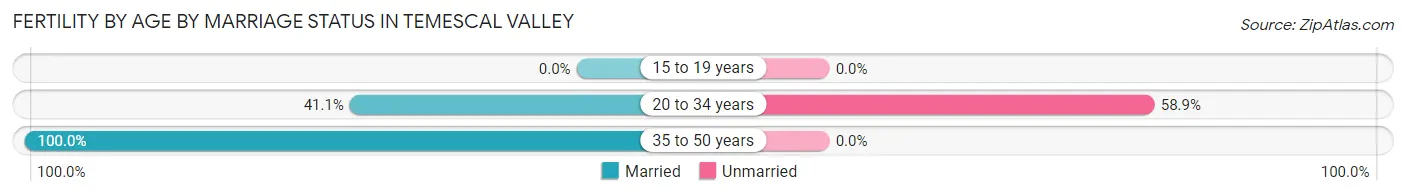
| Age Bracket | Married | Unmarried |
| 15 to 19 years | 0 (0.0%) | 0 (0.0%) |
| 20 to 34 years | 106 (41.1%) | 152 (58.9%) |
| 35 to 50 years | 15 (100.0%) | 0 (0.0%) |
| Total | 121 (44.3%) | 152 (55.7%) |
Fertility by Education in Temescal Valley
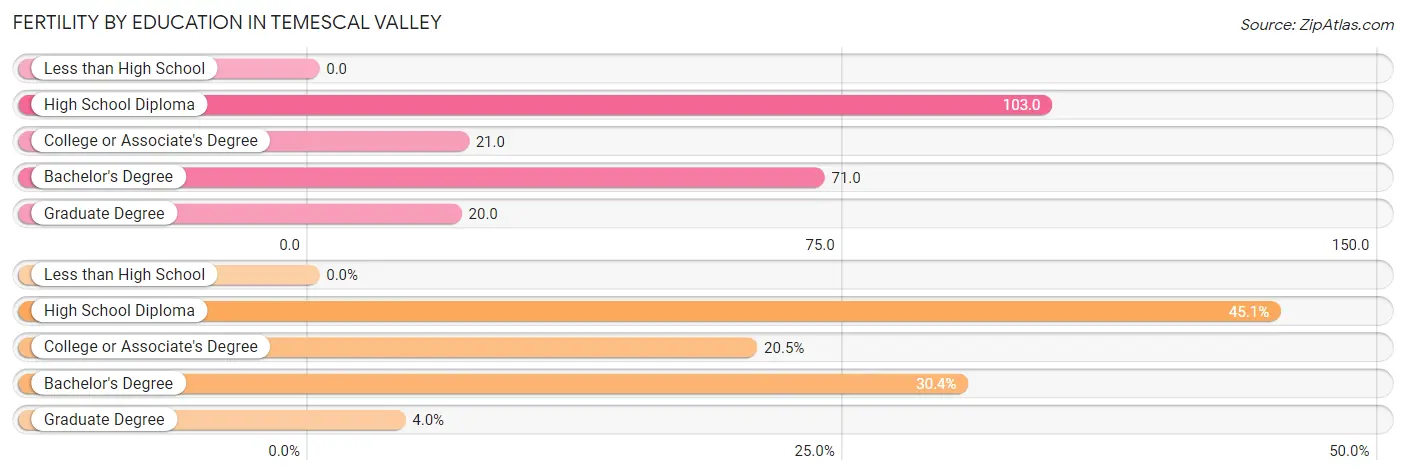
| Educational Attainment | Women with Births | Births / 1,000 Women |
| Less than High School | 0 (0.0%) | 0.0 |
| High School Diploma | 123 (45.1%) | 103.0 |
| College or Associate's Degree | 56 (20.5%) | 21.0 |
| Bachelor's Degree | 83 (30.4%) | 71.0 |
| Graduate Degree | 11 (4.0%) | 20.0 |
| Total | 273 (100.0%) | 42.0 |
Fertility by Education by Marriage Status in Temescal Valley
55.7% of women with births in Temescal Valley are unmarried. Women with the educational attainment of bachelor's degree are most likely to be married with 100.0% of them married at childbirth, while women with the educational attainment of high school diploma are least likely to be married with 87.8% of them unmarried at childbirth.
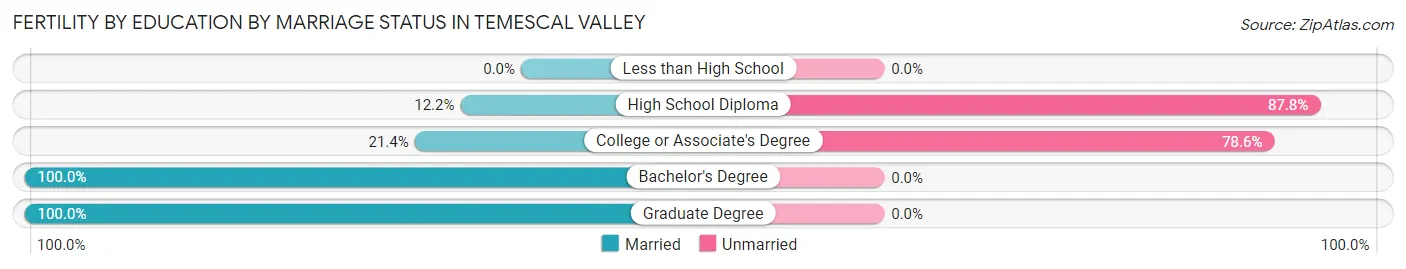
| Educational Attainment | Married | Unmarried |
| Less than High School | 0 (0.0%) | 0 (0.0%) |
| High School Diploma | 15 (12.2%) | 108 (87.8%) |
| College or Associate's Degree | 12 (21.4%) | 44 (78.6%) |
| Bachelor's Degree | 83 (100.0%) | 0 (0.0%) |
| Graduate Degree | 11 (100.0%) | 0 (0.0%) |
| Total | 121 (44.3%) | 152 (55.7%) |
Employment Characteristics in Temescal Valley
Employment by Class of Employer in Temescal Valley
Among the 12,484 employed individuals in Temescal Valley, private company employees (8,782 | 70.4%), local government employees (1,323 | 10.6%), and self-employed (incorporated) (725 | 5.8%) make up the most common classes of employment.
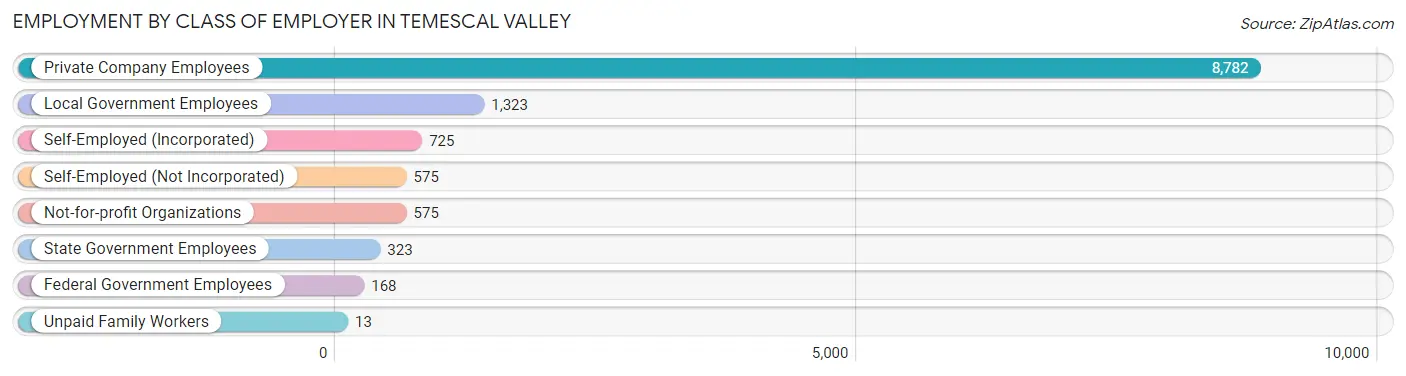
| Employer Class | # Employees | % Employees |
| Private Company Employees | 8,782 | 70.4% |
| Self-Employed (Incorporated) | 725 | 5.8% |
| Self-Employed (Not Incorporated) | 575 | 4.6% |
| Not-for-profit Organizations | 575 | 4.6% |
| Local Government Employees | 1,323 | 10.6% |
| State Government Employees | 323 | 2.6% |
| Federal Government Employees | 168 | 1.3% |
| Unpaid Family Workers | 13 | 0.1% |
| Total | 12,484 | 100.0% |
Employment Status by Age in Temescal Valley
According to the labor force statistics for Temescal Valley, out of the total population over 16 years of age (21,957), 61.9% or 13,591 individuals are in the labor force, with 5.1% or 693 of them unemployed. The age group with the highest labor force participation rate is 25 to 29 years, with 82.5% or 1,088 individuals in the labor force. Within the labor force, the 75 years and over age range has the highest percentage of unemployed individuals, with 24.5% or 13 of them being unemployed.
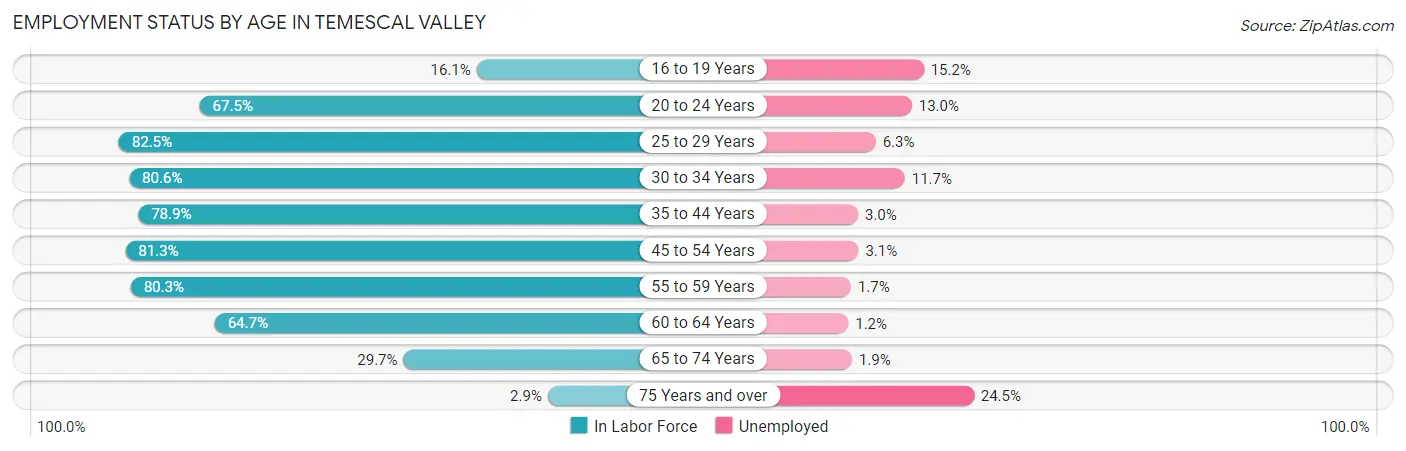
| Age Bracket | In Labor Force | Unemployed |
| 16 to 19 Years | 263 (16.1%) | 40 (15.2%) |
| 20 to 24 Years | 1,074 (67.5%) | 140 (13.0%) |
| 25 to 29 Years | 1,088 (82.5%) | 69 (6.3%) |
| 30 to 34 Years | 1,611 (80.6%) | 188 (11.7%) |
| 35 to 44 Years | 2,741 (78.9%) | 82 (3.0%) |
| 45 to 54 Years | 3,645 (81.3%) | 113 (3.1%) |
| 55 to 59 Years | 1,506 (80.3%) | 26 (1.7%) |
| 60 to 64 Years | 912 (64.7%) | 11 (1.2%) |
| 65 to 74 Years | 700 (29.7%) | 13 (1.9%) |
| 75 Years and over | 53 (2.9%) | 13 (24.5%) |
| Total | 13,591 (61.9%) | 693 (5.1%) |
Employment Status by Educational Attainment in Temescal Valley
According to labor force statistics for Temescal Valley, 79.0% of individuals (11,503) out of the total population between 25 and 64 years of age (14,561) are in the labor force, with 4.2% or 483 of them being unemployed. The group with the highest labor force participation rate are those with the educational attainment of bachelor's degree or higher, with 85.0% or 3,872 individuals in the labor force. Within the labor force, individuals with high school diploma education have the highest percentage of unemployment, with 5.4% or 126 of them being unemployed.
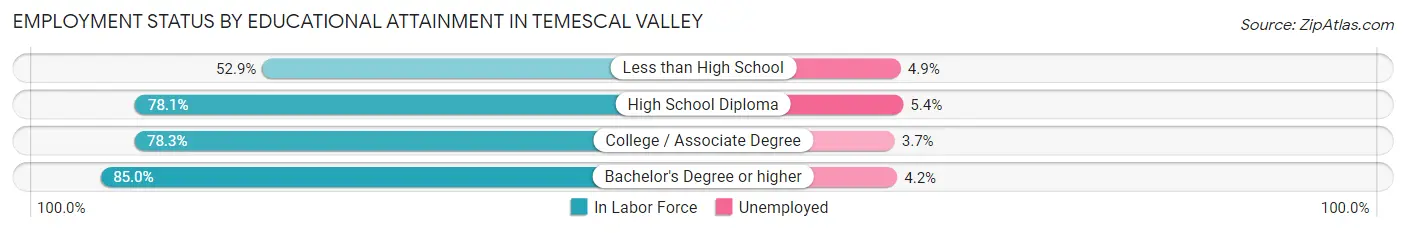
| Educational Attainment | In Labor Force | Unemployed |
| Less than High School | 408 (52.9%) | 38 (4.9%) |
| High School Diploma | 2,330 (78.1%) | 161 (5.4%) |
| College / Associate Degree | 4,895 (78.3%) | 231 (3.7%) |
| Bachelor's Degree or higher | 3,872 (85.0%) | 191 (4.2%) |
| Total | 11,503 (79.0%) | 612 (4.2%) |
Employment Occupations by Sex in Temescal Valley
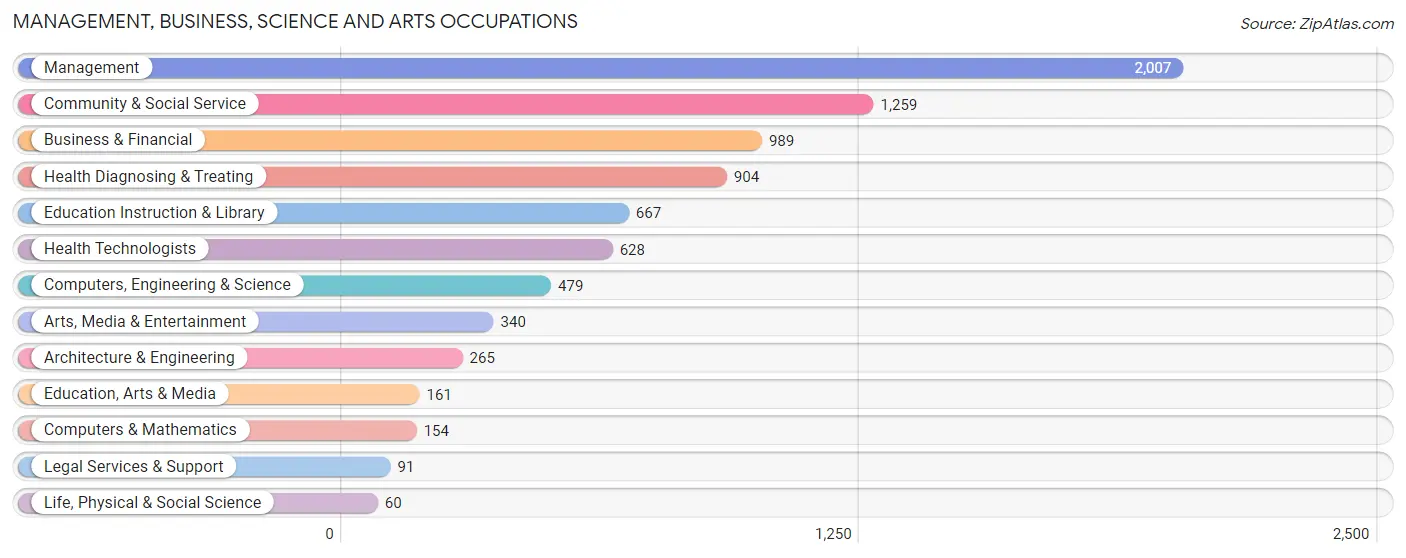
Management, Business, Science and Arts Occupations
The most common Management, Business, Science and Arts occupations in Temescal Valley are Management (2,007 | 15.6%), Community & Social Service (1,259 | 9.8%), Business & Financial (989 | 7.7%), Health Diagnosing & Treating (904 | 7.0%), and Education Instruction & Library (667 | 5.2%).
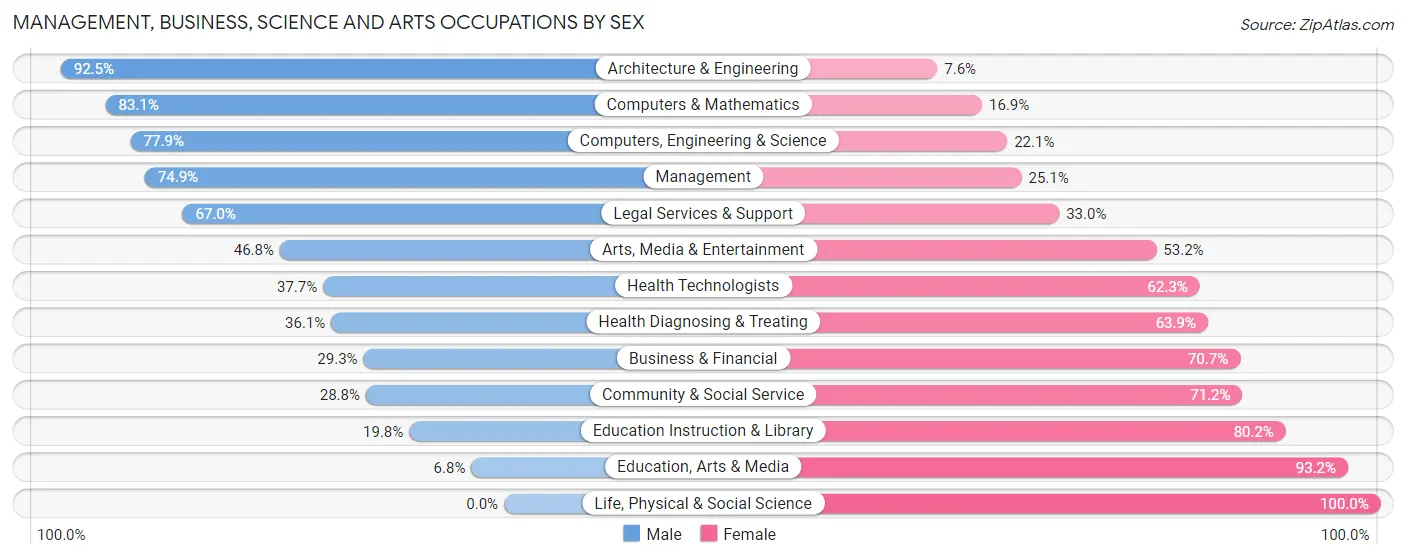
Management, Business, Science and Arts Occupations by Sex
Within the Management, Business, Science and Arts occupations in Temescal Valley, the most male-oriented occupations are Architecture & Engineering (92.4%), Computers & Mathematics (83.1%), and Computers, Engineering & Science (77.9%), while the most female-oriented occupations are Life, Physical & Social Science (100.0%), Education, Arts & Media (93.2%), and Education Instruction & Library (80.2%).
| Occupation | Male | Female |
| Management | 1,503 (74.9%) | 504 (25.1%) |
| Business & Financial | 290 (29.3%) | 699 (70.7%) |
| Computers, Engineering & Science | 373 (77.9%) | 106 (22.1%) |
| Computers & Mathematics | 128 (83.1%) | 26 (16.9%) |
| Architecture & Engineering | 245 (92.4%) | 20 (7.5%) |
| Life, Physical & Social Science | 0 (0.0%) | 60 (100.0%) |
| Community & Social Service | 363 (28.8%) | 896 (71.2%) |
| Education, Arts & Media | 11 (6.8%) | 150 (93.2%) |
| Legal Services & Support | 61 (67.0%) | 30 (33.0%) |
| Education Instruction & Library | 132 (19.8%) | 535 (80.2%) |
| Arts, Media & Entertainment | 159 (46.8%) | 181 (53.2%) |
| Health Diagnosing & Treating | 326 (36.1%) | 578 (63.9%) |
| Health Technologists | 237 (37.7%) | 391 (62.3%) |
| Total (Category) | 2,855 (50.6%) | 2,783 (49.4%) |
| Total (Overall) | 7,179 (55.6%) | 5,723 (44.4%) |
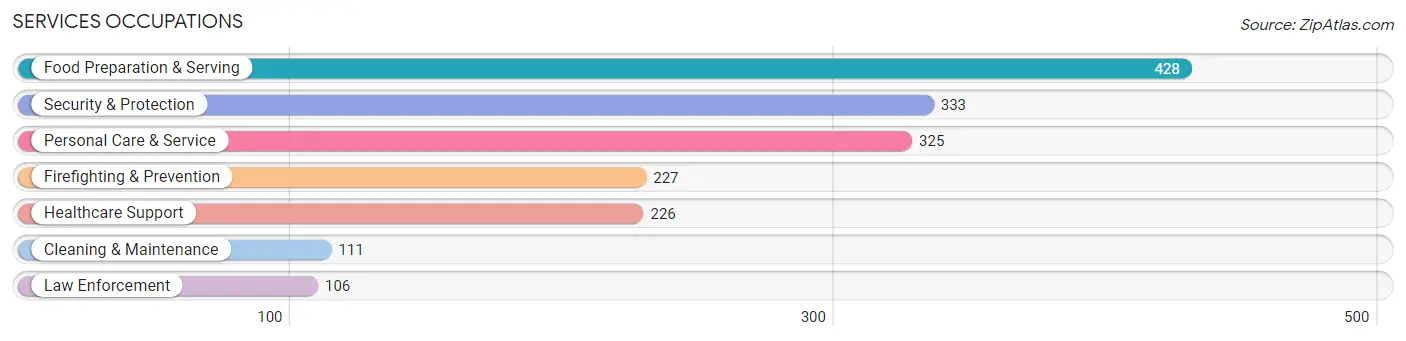
Services Occupations
The most common Services occupations in Temescal Valley are Food Preparation & Serving (428 | 3.3%), Security & Protection (333 | 2.6%), Personal Care & Service (325 | 2.5%), Firefighting & Prevention (227 | 1.8%), and Healthcare Support (226 | 1.8%).
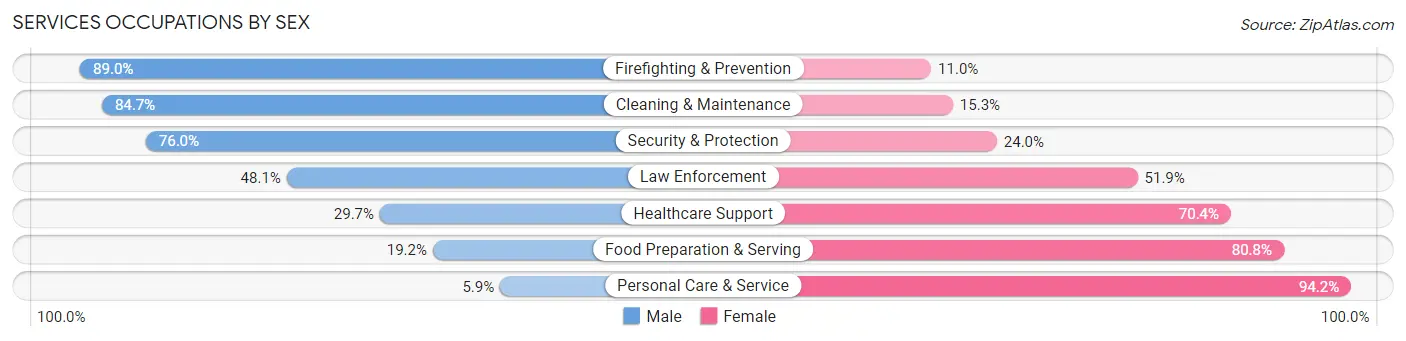
Services Occupations by Sex
Within the Services occupations in Temescal Valley, the most male-oriented occupations are Firefighting & Prevention (89.0%), Cleaning & Maintenance (84.7%), and Security & Protection (76.0%), while the most female-oriented occupations are Personal Care & Service (94.2%), Food Preparation & Serving (80.8%), and Healthcare Support (70.4%).
| Occupation | Male | Female |
| Healthcare Support | 67 (29.6%) | 159 (70.4%) |
| Security & Protection | 253 (76.0%) | 80 (24.0%) |
| Firefighting & Prevention | 202 (89.0%) | 25 (11.0%) |
| Law Enforcement | 51 (48.1%) | 55 (51.9%) |
| Food Preparation & Serving | 82 (19.2%) | 346 (80.8%) |
| Cleaning & Maintenance | 94 (84.7%) | 17 (15.3%) |
| Personal Care & Service | 19 (5.9%) | 306 (94.2%) |
| Total (Category) | 515 (36.2%) | 908 (63.8%) |
| Total (Overall) | 7,179 (55.6%) | 5,723 (44.4%) |
Sales and Office Occupations
The most common Sales and Office occupations in Temescal Valley are Office & Administration (1,735 | 13.5%), and Sales & Related (1,386 | 10.7%).

Sales and Office Occupations by Sex
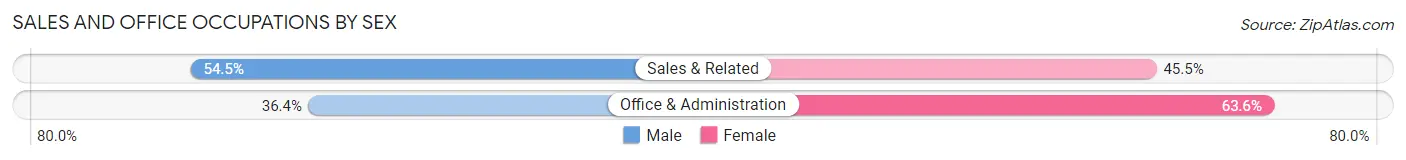
| Occupation | Male | Female |
| Sales & Related | 755 (54.5%) | 631 (45.5%) |
| Office & Administration | 632 (36.4%) | 1,103 (63.6%) |
| Total (Category) | 1,387 (44.4%) | 1,734 (55.6%) |
| Total (Overall) | 7,179 (55.6%) | 5,723 (44.4%) |
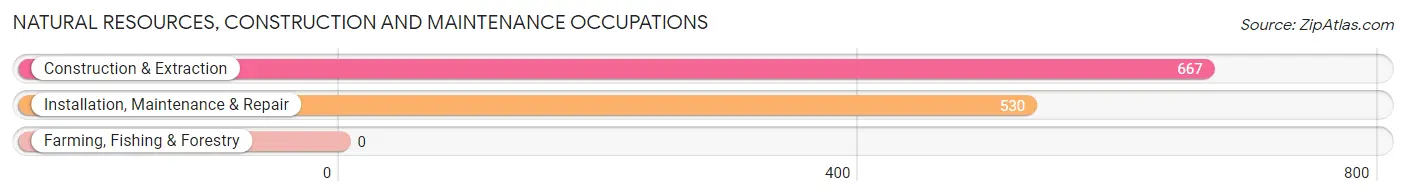
Natural Resources, Construction and Maintenance Occupations
The most common Natural Resources, Construction and Maintenance occupations in Temescal Valley are Construction & Extraction (667 | 5.2%), and Installation, Maintenance & Repair (530 | 4.1%).
Natural Resources, Construction and Maintenance Occupations by Sex
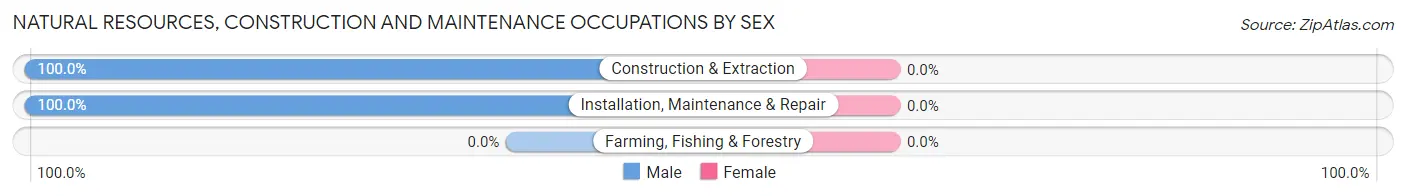
| Occupation | Male | Female |
| Farming, Fishing & Forestry | 0 (0.0%) | 0 (0.0%) |
| Construction & Extraction | 667 (100.0%) | 0 (0.0%) |
| Installation, Maintenance & Repair | 530 (100.0%) | 0 (0.0%) |
| Total (Category) | 1,197 (100.0%) | 0 (0.0%) |
| Total (Overall) | 7,179 (55.6%) | 5,723 (44.4%) |
Production, Transportation and Moving Occupations
The most common Production, Transportation and Moving occupations in Temescal Valley are Production (656 | 5.1%), Material Moving (449 | 3.5%), and Transportation (418 | 3.2%).
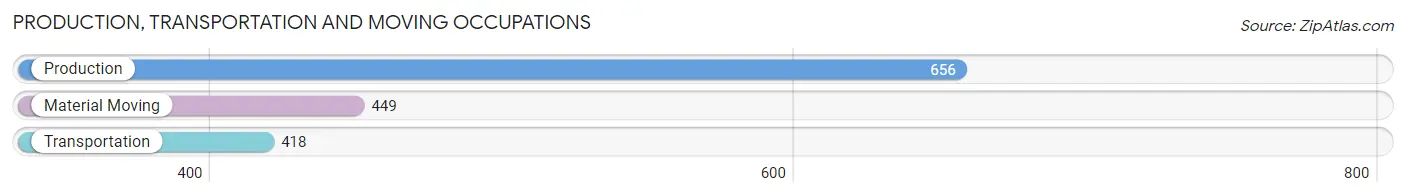
Production, Transportation and Moving Occupations by Sex
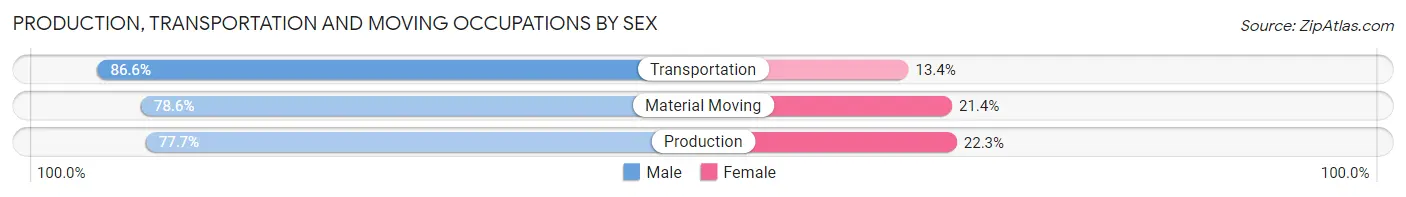
| Occupation | Male | Female |
| Production | 510 (77.7%) | 146 (22.3%) |
| Transportation | 362 (86.6%) | 56 (13.4%) |
| Material Moving | 353 (78.6%) | 96 (21.4%) |
| Total (Category) | 1,225 (80.4%) | 298 (19.6%) |
| Total (Overall) | 7,179 (55.6%) | 5,723 (44.4%) |
Employment Industries by Sex in Temescal Valley
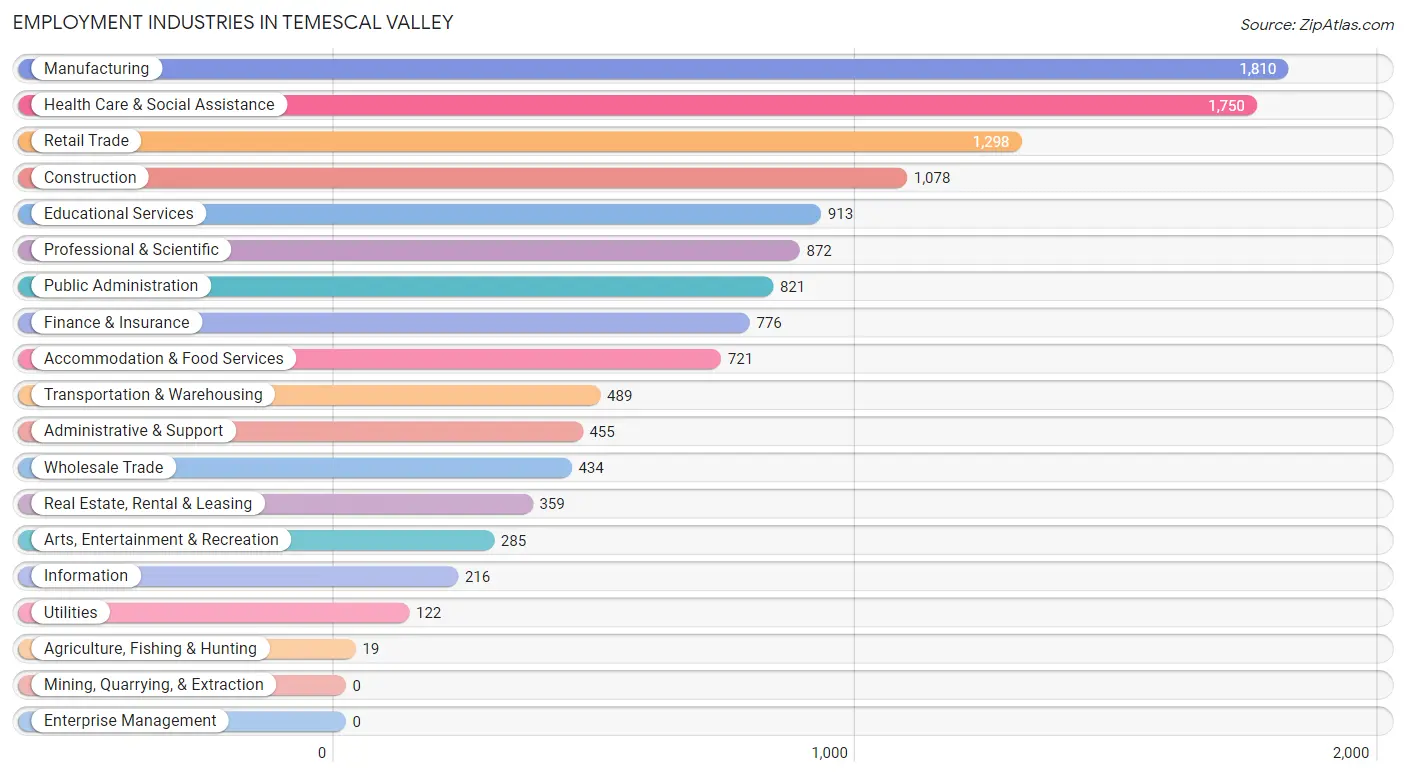
Employment Industries in Temescal Valley
The major employment industries in Temescal Valley include Manufacturing (1,810 | 14.0%), Health Care & Social Assistance (1,750 | 13.6%), Retail Trade (1,298 | 10.1%), Construction (1,078 | 8.4%), and Educational Services (913 | 7.1%).
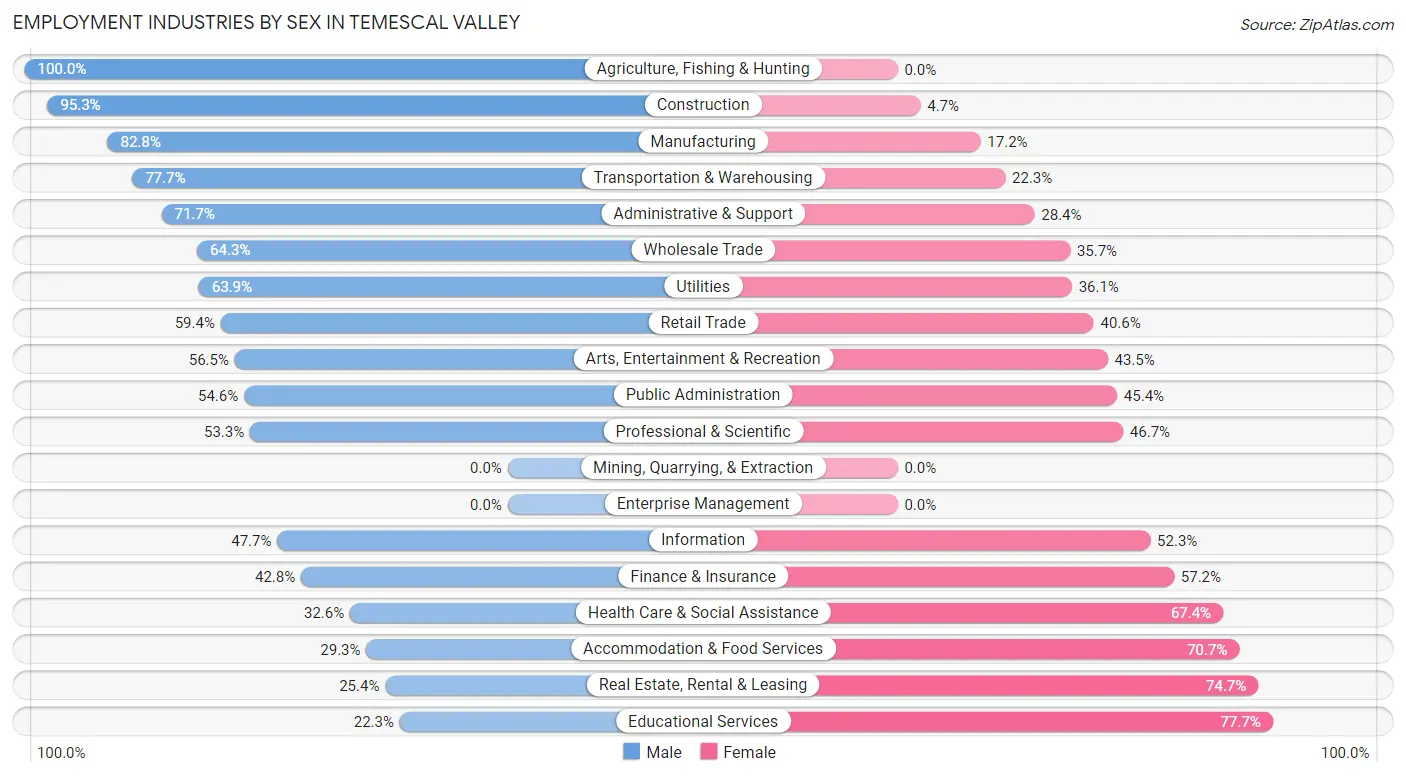
Employment Industries by Sex in Temescal Valley
The Temescal Valley industries that see more men than women are Agriculture, Fishing & Hunting (100.0%), Construction (95.3%), and Manufacturing (82.8%), whereas the industries that tend to have a higher number of women are Educational Services (77.7%), Real Estate, Rental & Leasing (74.7%), and Accommodation & Food Services (70.7%).
| Industry | Male | Female |
| Agriculture, Fishing & Hunting | 19 (100.0%) | 0 (0.0%) |
| Mining, Quarrying, & Extraction | 0 (0.0%) | 0 (0.0%) |
| Construction | 1,027 (95.3%) | 51 (4.7%) |
| Manufacturing | 1,499 (82.8%) | 311 (17.2%) |
| Wholesale Trade | 279 (64.3%) | 155 (35.7%) |
| Retail Trade | 771 (59.4%) | 527 (40.6%) |
| Transportation & Warehousing | 380 (77.7%) | 109 (22.3%) |
| Utilities | 78 (63.9%) | 44 (36.1%) |
| Information | 103 (47.7%) | 113 (52.3%) |
| Finance & Insurance | 332 (42.8%) | 444 (57.2%) |
| Real Estate, Rental & Leasing | 91 (25.4%) | 268 (74.7%) |
| Professional & Scientific | 465 (53.3%) | 407 (46.7%) |
| Enterprise Management | 0 (0.0%) | 0 (0.0%) |
| Administrative & Support | 326 (71.7%) | 129 (28.3%) |
| Educational Services | 204 (22.3%) | 709 (77.7%) |
| Health Care & Social Assistance | 571 (32.6%) | 1,179 (67.4%) |
| Arts, Entertainment & Recreation | 161 (56.5%) | 124 (43.5%) |
| Accommodation & Food Services | 211 (29.3%) | 510 (70.7%) |
| Public Administration | 448 (54.6%) | 373 (45.4%) |
| Total | 7,179 (55.6%) | 5,723 (44.4%) |
Education in Temescal Valley
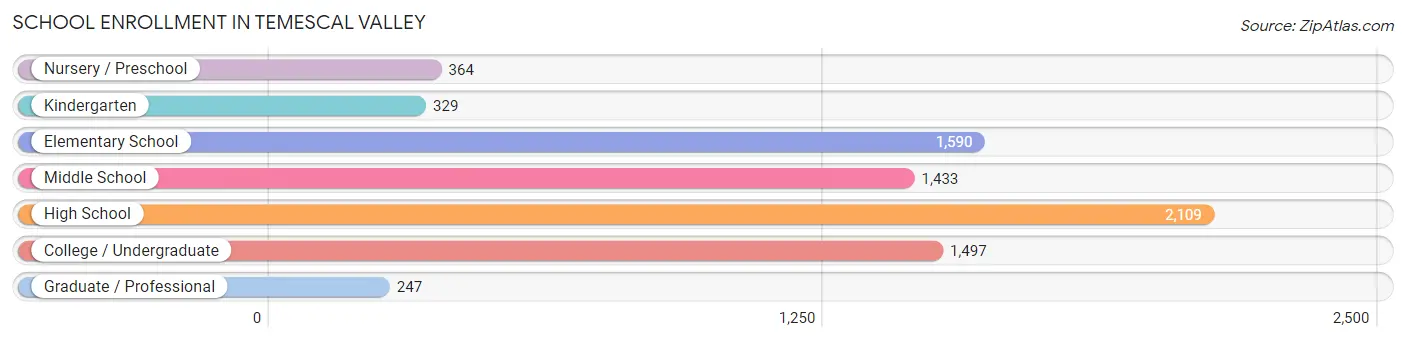
School Enrollment in Temescal Valley
The most common levels of schooling among the 7,569 students in Temescal Valley are high school (2,109 | 27.9%), elementary school (1,590 | 21.0%), and college / undergraduate (1,497 | 19.8%).
| School Level | # Students | % Students |
| Nursery / Preschool | 364 | 4.8% |
| Kindergarten | 329 | 4.3% |
| Elementary School | 1,590 | 21.0% |
| Middle School | 1,433 | 18.9% |
| High School | 2,109 | 27.9% |
| College / Undergraduate | 1,497 | 19.8% |
| Graduate / Professional | 247 | 3.3% |
| Total | 7,569 | 100.0% |
School Enrollment by Age by Funding Source in Temescal Valley
Out of a total of 7,569 students who are enrolled in schools in Temescal Valley, 961 (12.7%) attend a private institution, while the remaining 6,608 (87.3%) are enrolled in public schools. The age group of 3 to 4 year olds has the highest likelihood of being enrolled in private schools, with 145 (65.0% in the age bracket) enrolled. Conversely, the age group of 10 to 14 year olds has the lowest likelihood of being enrolled in a private school, with 2,183 (95.7% in the age bracket) attending a public institution.
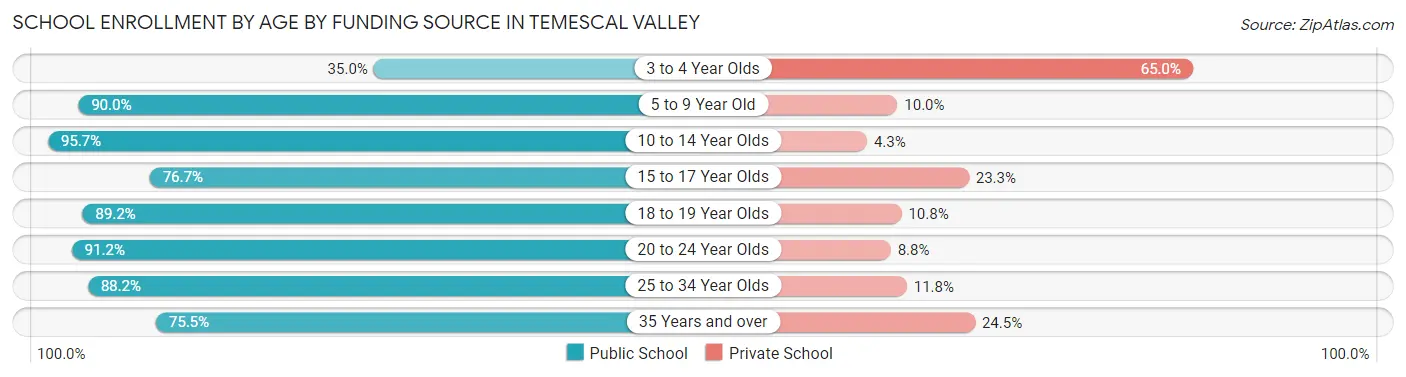
| Age Bracket | Public School | Private School |
| 3 to 4 Year Olds | 78 (35.0%) | 145 (65.0%) |
| 5 to 9 Year Old | 1,620 (90.0%) | 180 (10.0%) |
| 10 to 14 Year Olds | 2,183 (95.7%) | 99 (4.3%) |
| 15 to 17 Year Olds | 816 (76.7%) | 248 (23.3%) |
| 18 to 19 Year Olds | 638 (89.2%) | 77 (10.8%) |
| 20 to 24 Year Olds | 573 (91.2%) | 55 (8.8%) |
| 25 to 34 Year Olds | 345 (88.2%) | 46 (11.8%) |
| 35 Years and over | 352 (75.5%) | 114 (24.5%) |
| Total | 6,608 (87.3%) | 961 (12.7%) |
Educational Attainment by Field of Study in Temescal Valley
Business (1,478 | 24.5%), science & technology (781 | 13.0%), social sciences (625 | 10.4%), education (495 | 8.2%), and arts & humanities (449 | 7.5%) are the most common fields of study among 6,020 individuals in Temescal Valley who have obtained a bachelor's degree or higher.
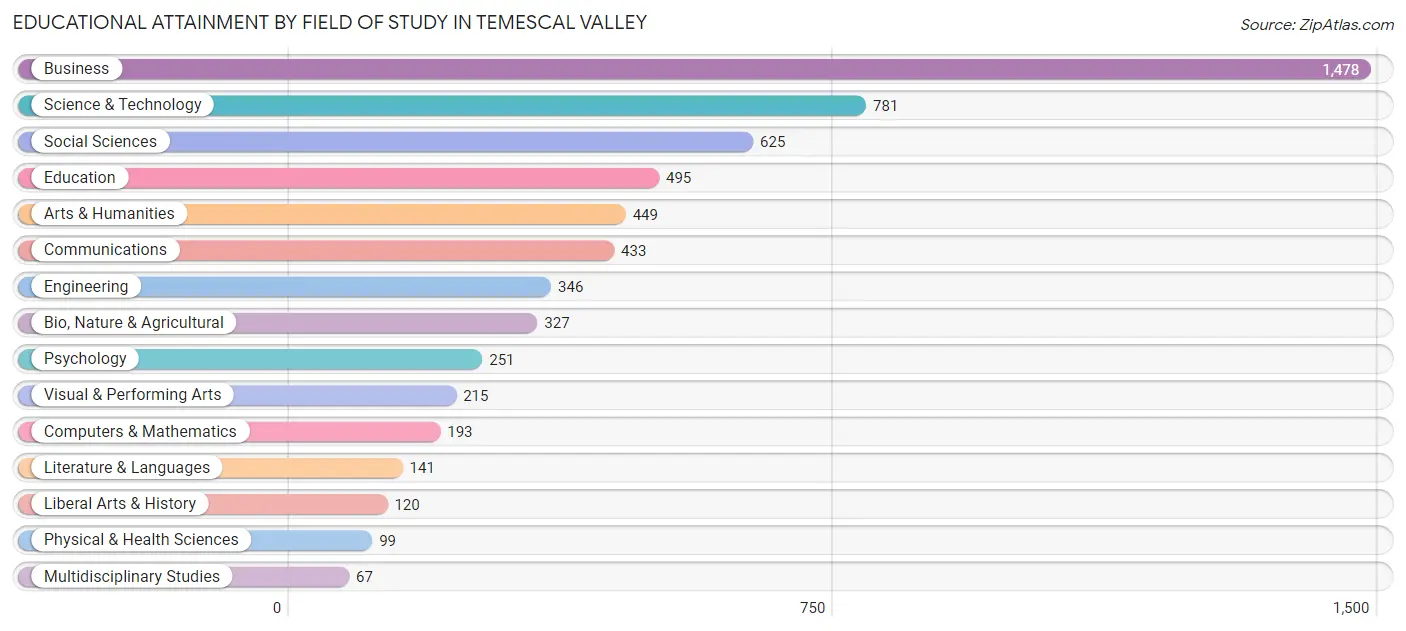
| Field of Study | # Graduates | % Graduates |
| Computers & Mathematics | 193 | 3.2% |
| Bio, Nature & Agricultural | 327 | 5.4% |
| Physical & Health Sciences | 99 | 1.6% |
| Psychology | 251 | 4.2% |
| Social Sciences | 625 | 10.4% |
| Engineering | 346 | 5.8% |
| Multidisciplinary Studies | 67 | 1.1% |
| Science & Technology | 781 | 13.0% |
| Business | 1,478 | 24.5% |
| Education | 495 | 8.2% |
| Literature & Languages | 141 | 2.3% |
| Liberal Arts & History | 120 | 2.0% |
| Visual & Performing Arts | 215 | 3.6% |
| Communications | 433 | 7.2% |
| Arts & Humanities | 449 | 7.5% |
| Total | 6,020 | 100.0% |
Transportation & Commute in Temescal Valley
Vehicle Availability by Sex in Temescal Valley
The most prevalent vehicle ownership categories in Temescal Valley are males with 3 vehicles (2,588, accounting for 36.6%) and females with 3 vehicles (1,847, making up 47.8%).
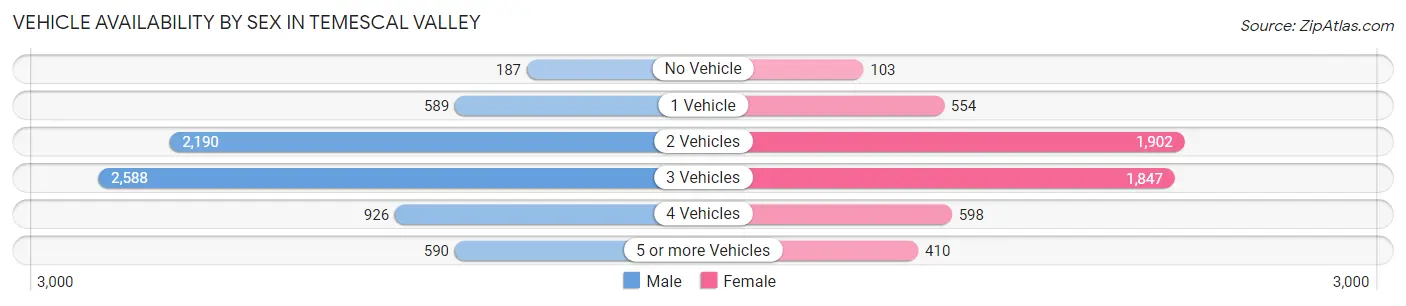
| Vehicles Available | Male | Female |
| No Vehicle | 187 (2.6%) | 103 (1.9%) |
| 1 Vehicle | 589 (8.3%) | 554 (10.2%) |
| 2 Vehicles | 2,190 (31.0%) | 1,902 (35.1%) |
| 3 Vehicles | 2,588 (36.6%) | 1,847 (34.1%) |
| 4 Vehicles | 926 (13.1%) | 598 (11.1%) |
| 5 or more Vehicles | 590 (8.4%) | 410 (7.6%) |
| Total | 7,070 (100.0%) | 5,414 (100.0%) |
Commute Time in Temescal Valley
The most frequently occuring commute durations in Temescal Valley are 60 to 89 minutes (2,297 commuters, 20.8%), 45 to 59 minutes (1,861 commuters, 16.8%), and 30 to 34 minutes (1,681 commuters, 15.2%).
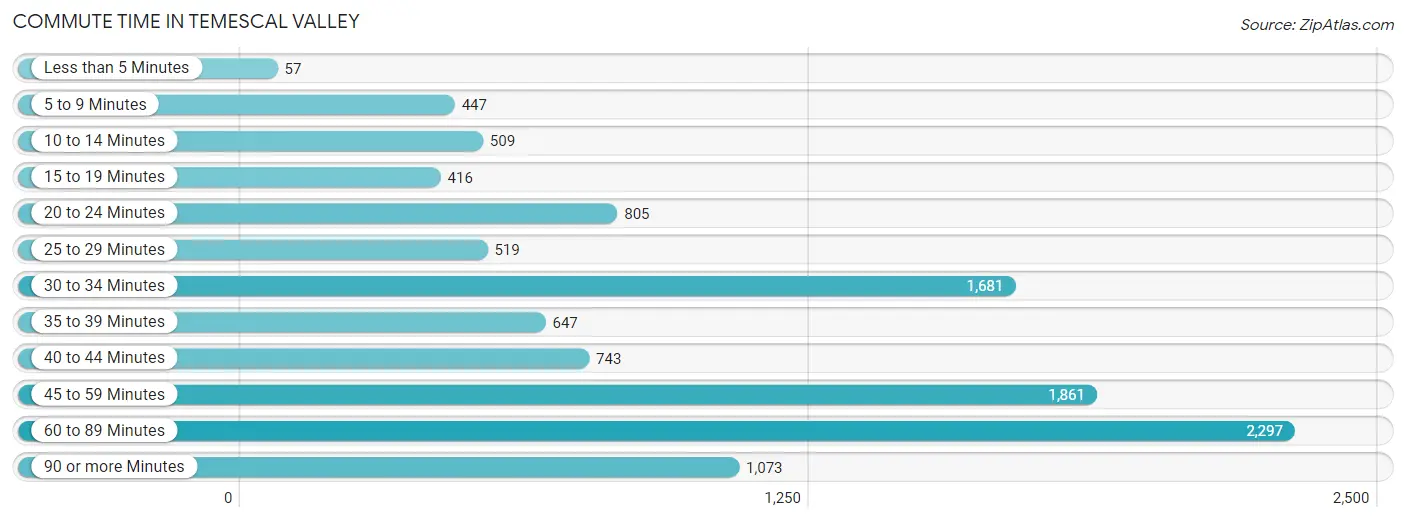
| Commute Time | # Commuters | % Commuters |
| Less than 5 Minutes | 57 | 0.5% |
| 5 to 9 Minutes | 447 | 4.0% |
| 10 to 14 Minutes | 509 | 4.6% |
| 15 to 19 Minutes | 416 | 3.8% |
| 20 to 24 Minutes | 805 | 7.3% |
| 25 to 29 Minutes | 519 | 4.7% |
| 30 to 34 Minutes | 1,681 | 15.2% |
| 35 to 39 Minutes | 647 | 5.9% |
| 40 to 44 Minutes | 743 | 6.7% |
| 45 to 59 Minutes | 1,861 | 16.8% |
| 60 to 89 Minutes | 2,297 | 20.8% |
| 90 or more Minutes | 1,073 | 9.7% |
Commute Time by Sex in Temescal Valley
The most common commute times in Temescal Valley are 60 to 89 minutes (1,462 commuters, 22.7%) for males and 60 to 89 minutes (835 commuters, 18.1%) for females.
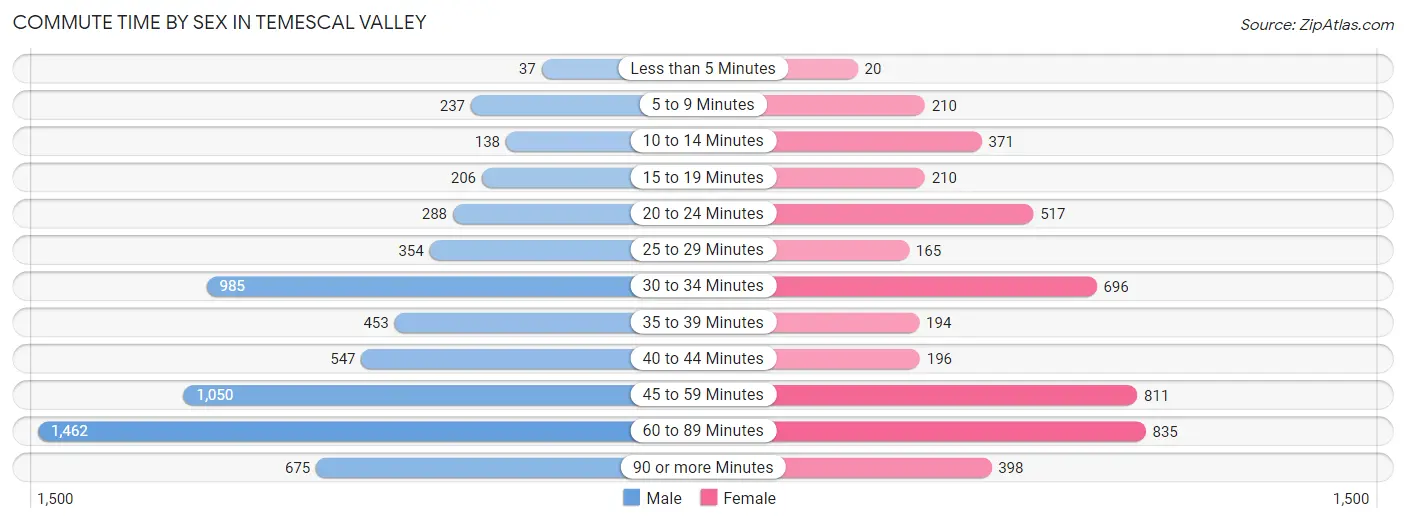
| Commute Time | Male | Female |
| Less than 5 Minutes | 37 (0.6%) | 20 (0.4%) |
| 5 to 9 Minutes | 237 (3.7%) | 210 (4.5%) |
| 10 to 14 Minutes | 138 (2.1%) | 371 (8.0%) |
| 15 to 19 Minutes | 206 (3.2%) | 210 (4.5%) |
| 20 to 24 Minutes | 288 (4.5%) | 517 (11.2%) |
| 25 to 29 Minutes | 354 (5.5%) | 165 (3.6%) |
| 30 to 34 Minutes | 985 (15.3%) | 696 (15.1%) |
| 35 to 39 Minutes | 453 (7.0%) | 194 (4.2%) |
| 40 to 44 Minutes | 547 (8.5%) | 196 (4.2%) |
| 45 to 59 Minutes | 1,050 (16.3%) | 811 (17.5%) |
| 60 to 89 Minutes | 1,462 (22.7%) | 835 (18.1%) |
| 90 or more Minutes | 675 (10.5%) | 398 (8.6%) |
Time of Departure to Work by Sex in Temescal Valley
The most frequent times of departure to work in Temescal Valley are 12:00 AM to 4:59 AM (1,474, 22.9%) for males and 7:00 AM to 7:29 AM (788, 17.1%) for females.
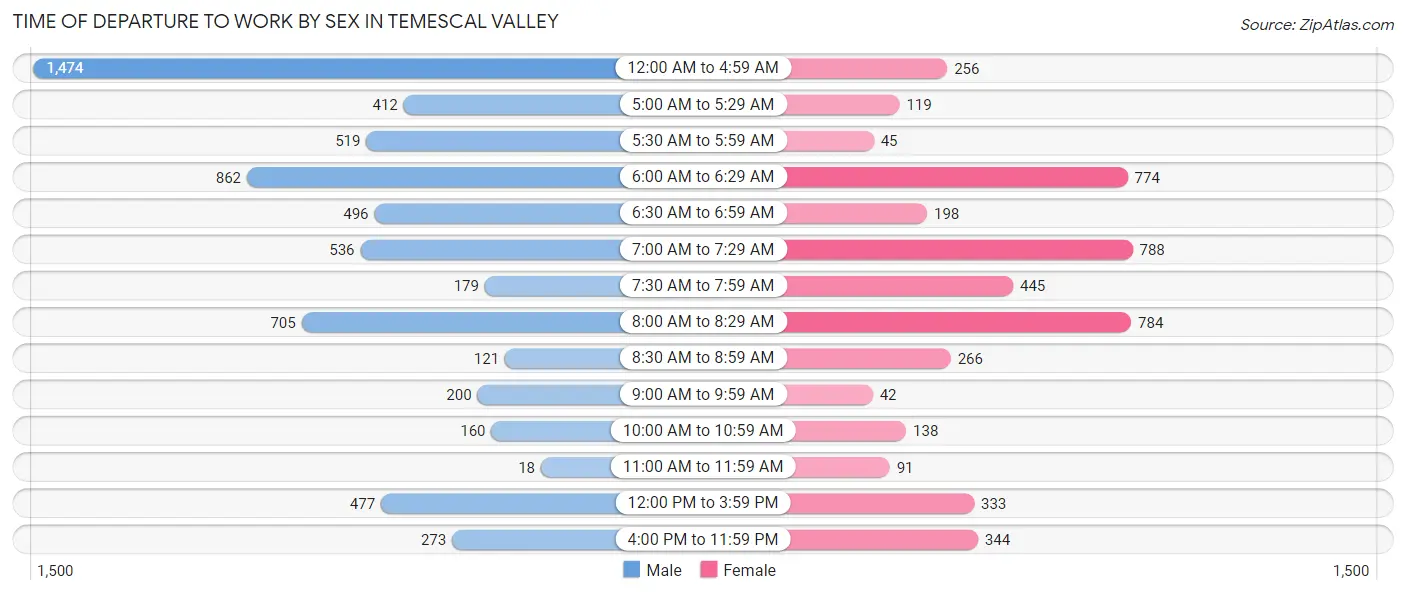
| Time of Departure | Male | Female |
| 12:00 AM to 4:59 AM | 1,474 (22.9%) | 256 (5.5%) |
| 5:00 AM to 5:29 AM | 412 (6.4%) | 119 (2.6%) |
| 5:30 AM to 5:59 AM | 519 (8.1%) | 45 (1.0%) |
| 6:00 AM to 6:29 AM | 862 (13.4%) | 774 (16.7%) |
| 6:30 AM to 6:59 AM | 496 (7.7%) | 198 (4.3%) |
| 7:00 AM to 7:29 AM | 536 (8.3%) | 788 (17.1%) |
| 7:30 AM to 7:59 AM | 179 (2.8%) | 445 (9.6%) |
| 8:00 AM to 8:29 AM | 705 (11.0%) | 784 (17.0%) |
| 8:30 AM to 8:59 AM | 121 (1.9%) | 266 (5.8%) |
| 9:00 AM to 9:59 AM | 200 (3.1%) | 42 (0.9%) |
| 10:00 AM to 10:59 AM | 160 (2.5%) | 138 (3.0%) |
| 11:00 AM to 11:59 AM | 18 (0.3%) | 91 (2.0%) |
| 12:00 PM to 3:59 PM | 477 (7.4%) | 333 (7.2%) |
| 4:00 PM to 11:59 PM | 273 (4.2%) | 344 (7.4%) |
| Total | 6,432 (100.0%) | 4,623 (100.0%) |
Housing Occupancy in Temescal Valley
Occupancy by Ownership in Temescal Valley
Of the total 9,000 dwellings in Temescal Valley, owner-occupied units account for 7,582 (84.2%), while renter-occupied units make up 1,418 (15.8%).
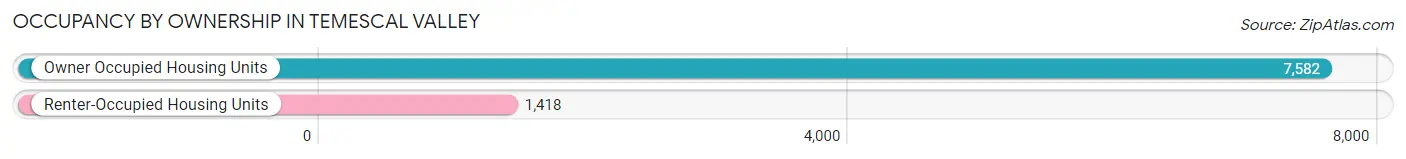
| Occupancy | # Housing Units | % Housing Units |
| Owner Occupied Housing Units | 7,582 | 84.2% |
| Renter-Occupied Housing Units | 1,418 | 15.8% |
| Total Occupied Housing Units | 9,000 | 100.0% |
Occupancy by Household Size in Temescal Valley
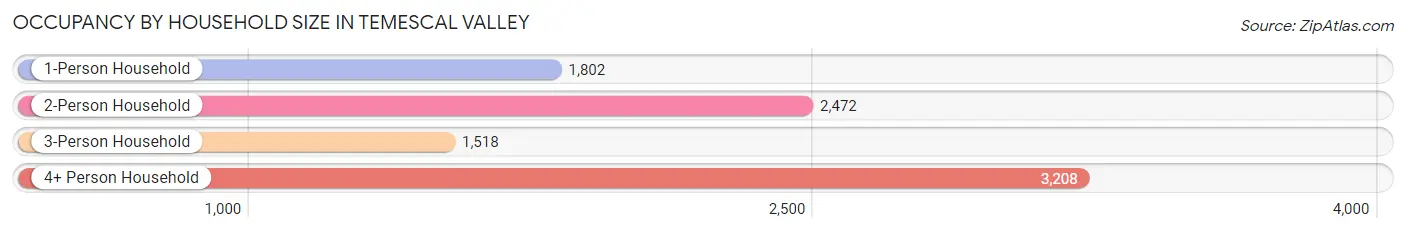
| Household Size | # Housing Units | % Housing Units |
| 1-Person Household | 1,802 | 20.0% |
| 2-Person Household | 2,472 | 27.5% |
| 3-Person Household | 1,518 | 16.9% |
| 4+ Person Household | 3,208 | 35.6% |
| Total Housing Units | 9,000 | 100.0% |
Occupancy by Ownership by Household Size in Temescal Valley
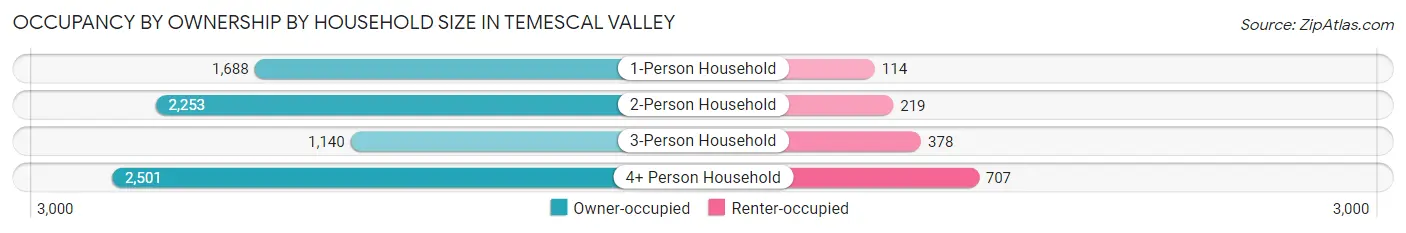
| Household Size | Owner-occupied | Renter-occupied |
| 1-Person Household | 1,688 (93.7%) | 114 (6.3%) |
| 2-Person Household | 2,253 (91.1%) | 219 (8.9%) |
| 3-Person Household | 1,140 (75.1%) | 378 (24.9%) |
| 4+ Person Household | 2,501 (78.0%) | 707 (22.0%) |
| Total Housing Units | 7,582 (84.2%) | 1,418 (15.8%) |
Occupancy by Educational Attainment in Temescal Valley
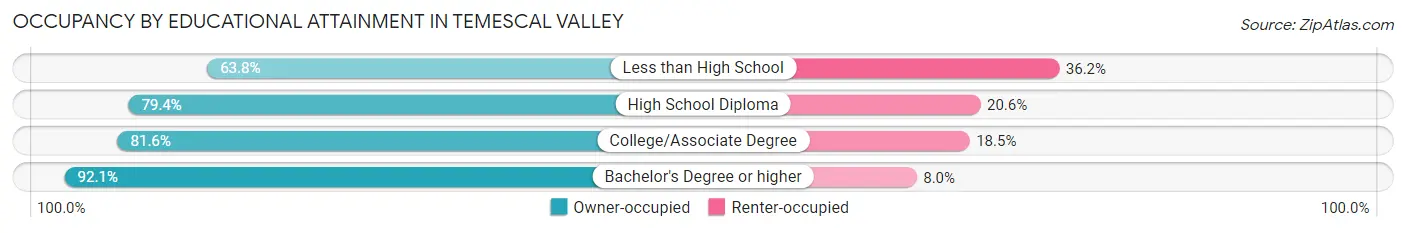
| Household Size | Owner-occupied | Renter-occupied |
| Less than High School | 243 (63.8%) | 138 (36.2%) |
| High School Diploma | 1,376 (79.4%) | 357 (20.6%) |
| College/Associate Degree | 2,918 (81.6%) | 660 (18.4%) |
| Bachelor's Degree or higher | 3,045 (92.0%) | 263 (8.0%) |
Occupancy by Age of Householder in Temescal Valley
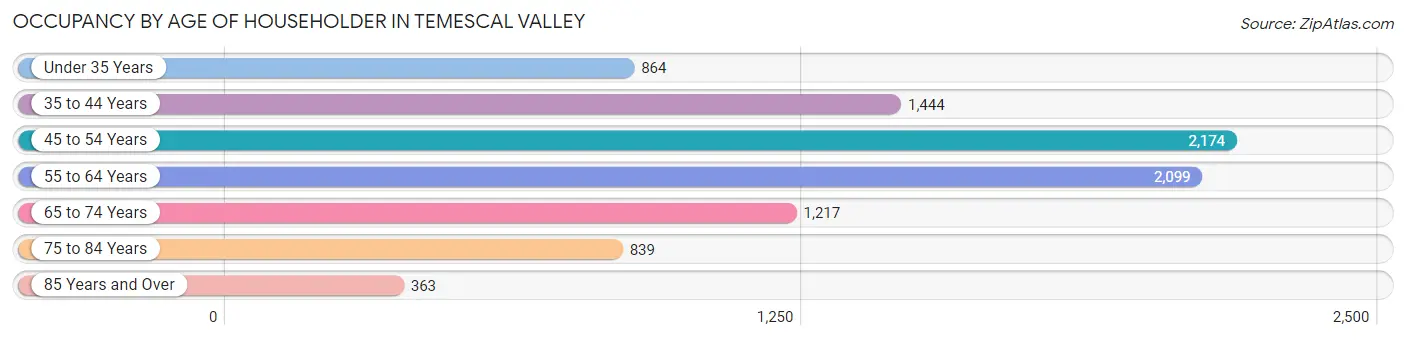
| Age Bracket | # Households | % Households |
| Under 35 Years | 864 | 9.6% |
| 35 to 44 Years | 1,444 | 16.0% |
| 45 to 54 Years | 2,174 | 24.2% |
| 55 to 64 Years | 2,099 | 23.3% |
| 65 to 74 Years | 1,217 | 13.5% |
| 75 to 84 Years | 839 | 9.3% |
| 85 Years and Over | 363 | 4.0% |
| Total | 9,000 | 100.0% |
Housing Finances in Temescal Valley
Median Income by Occupancy in Temescal Valley
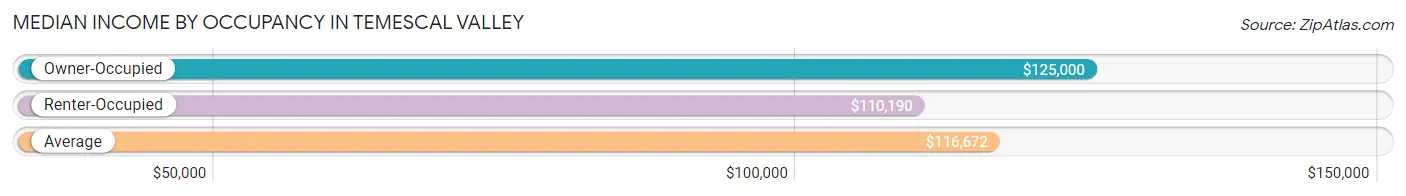
| Occupancy Type | # Households | Median Income |
| Owner-Occupied | 7,582 (84.2%) | $125,000 |
| Renter-Occupied | 1,418 (15.8%) | $110,190 |
| Average | 9,000 (100.0%) | $116,672 |
Occupancy by Householder Income Bracket in Temescal Valley
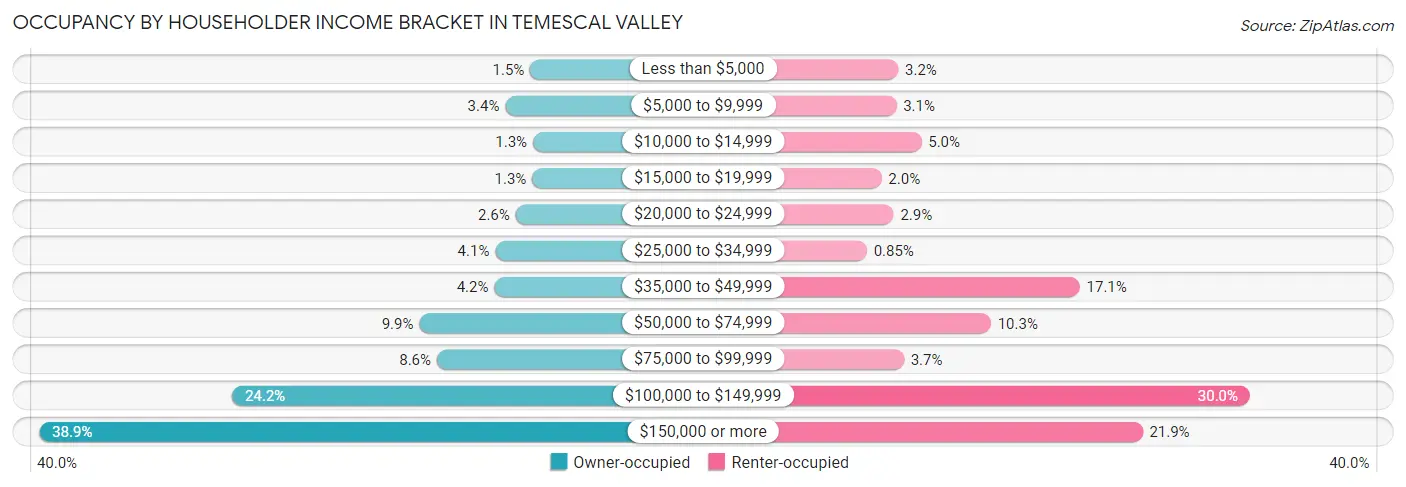
| Income Bracket | Owner-occupied | Renter-occupied |
| Less than $5,000 | 112 (1.5%) | 46 (3.2%) |
| $5,000 to $9,999 | 256 (3.4%) | 44 (3.1%) |
| $10,000 to $14,999 | 96 (1.3%) | 71 (5.0%) |
| $15,000 to $19,999 | 101 (1.3%) | 28 (2.0%) |
| $20,000 to $24,999 | 196 (2.6%) | 41 (2.9%) |
| $25,000 to $34,999 | 314 (4.1%) | 12 (0.9%) |
| $35,000 to $49,999 | 319 (4.2%) | 242 (17.1%) |
| $50,000 to $74,999 | 753 (9.9%) | 146 (10.3%) |
| $75,000 to $99,999 | 651 (8.6%) | 52 (3.7%) |
| $100,000 to $149,999 | 1,835 (24.2%) | 426 (30.0%) |
| $150,000 or more | 2,949 (38.9%) | 310 (21.9%) |
| Total | 7,582 (100.0%) | 1,418 (100.0%) |
Monthly Housing Cost Tiers in Temescal Valley
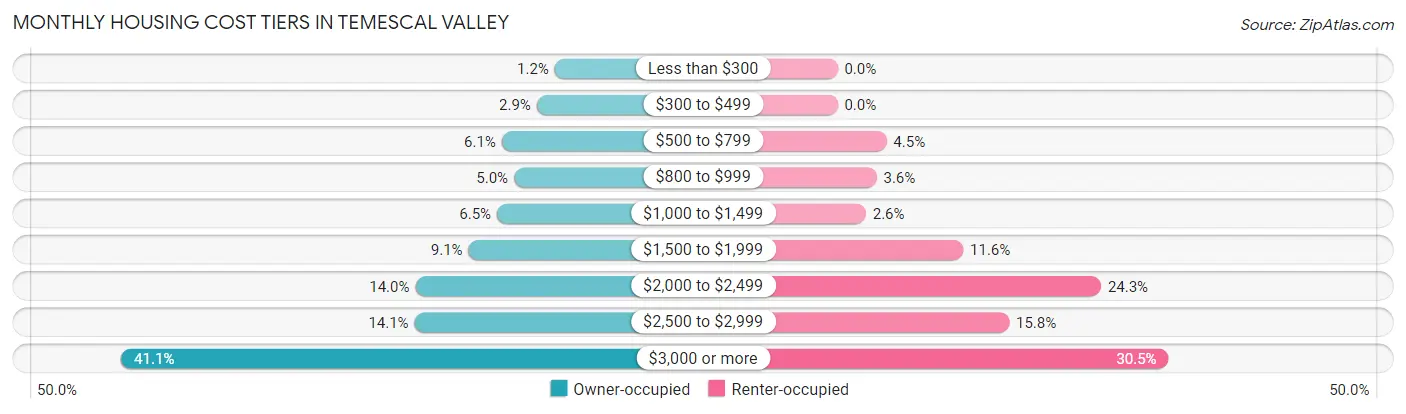
| Monthly Cost | Owner-occupied | Renter-occupied |
| Less than $300 | 91 (1.2%) | 0 (0.0%) |
| $300 to $499 | 217 (2.9%) | 0 (0.0%) |
| $500 to $799 | 461 (6.1%) | 64 (4.5%) |
| $800 to $999 | 375 (5.0%) | 51 (3.6%) |
| $1,000 to $1,499 | 494 (6.5%) | 37 (2.6%) |
| $1,500 to $1,999 | 693 (9.1%) | 164 (11.6%) |
| $2,000 to $2,499 | 1,064 (14.0%) | 344 (24.3%) |
| $2,500 to $2,999 | 1,070 (14.1%) | 224 (15.8%) |
| $3,000 or more | 3,117 (41.1%) | 432 (30.5%) |
| Total | 7,582 (100.0%) | 1,418 (100.0%) |
Physical Housing Characteristics in Temescal Valley
Housing Structures in Temescal Valley
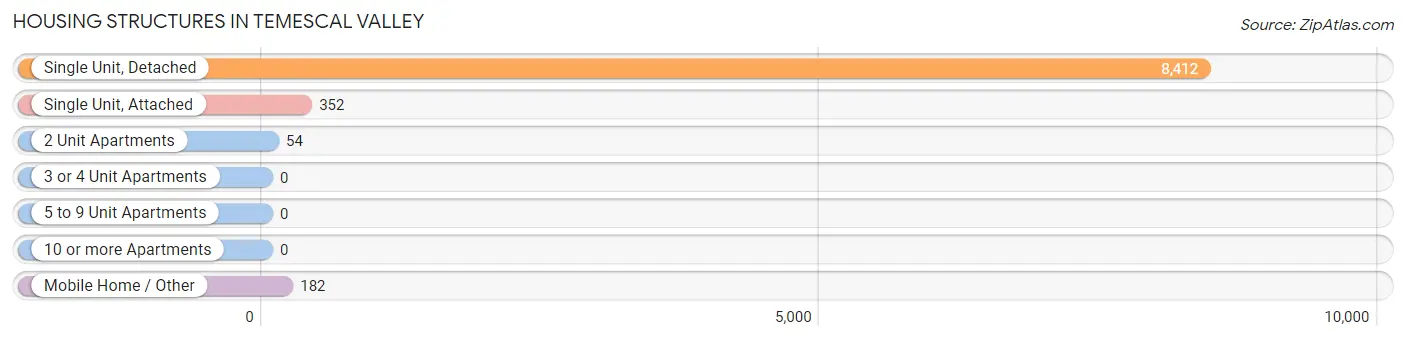
| Structure Type | # Housing Units | % Housing Units |
| Single Unit, Detached | 8,412 | 93.5% |
| Single Unit, Attached | 352 | 3.9% |
| 2 Unit Apartments | 54 | 0.6% |
| 3 or 4 Unit Apartments | 0 | 0.0% |
| 5 to 9 Unit Apartments | 0 | 0.0% |
| 10 or more Apartments | 0 | 0.0% |
| Mobile Home / Other | 182 | 2.0% |
| Total | 9,000 | 100.0% |
Housing Structures by Occupancy in Temescal Valley
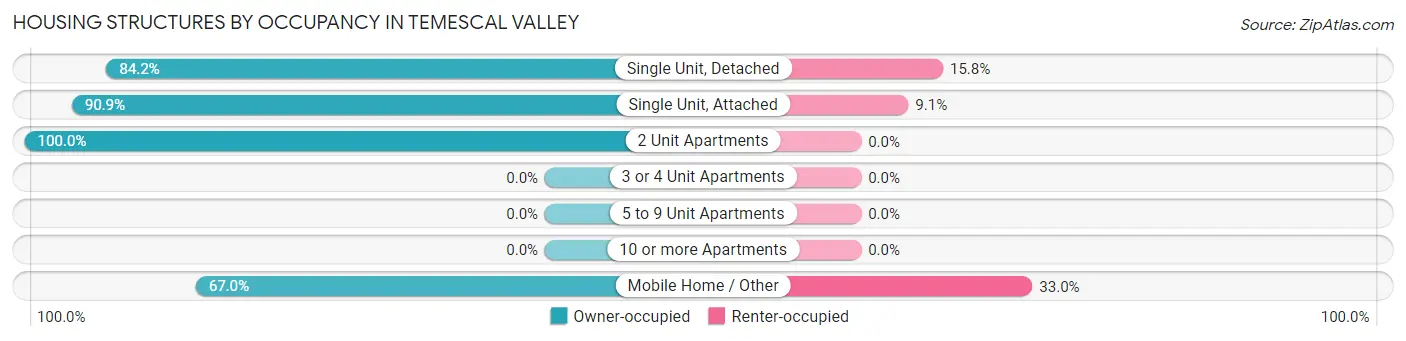
| Structure Type | Owner-occupied | Renter-occupied |
| Single Unit, Detached | 7,086 (84.2%) | 1,326 (15.8%) |
| Single Unit, Attached | 320 (90.9%) | 32 (9.1%) |
| 2 Unit Apartments | 54 (100.0%) | 0 (0.0%) |
| 3 or 4 Unit Apartments | 0 (0.0%) | 0 (0.0%) |
| 5 to 9 Unit Apartments | 0 (0.0%) | 0 (0.0%) |
| 10 or more Apartments | 0 (0.0%) | 0 (0.0%) |
| Mobile Home / Other | 122 (67.0%) | 60 (33.0%) |
| Total | 7,582 (84.2%) | 1,418 (15.8%) |
Housing Structures by Number of Rooms in Temescal Valley
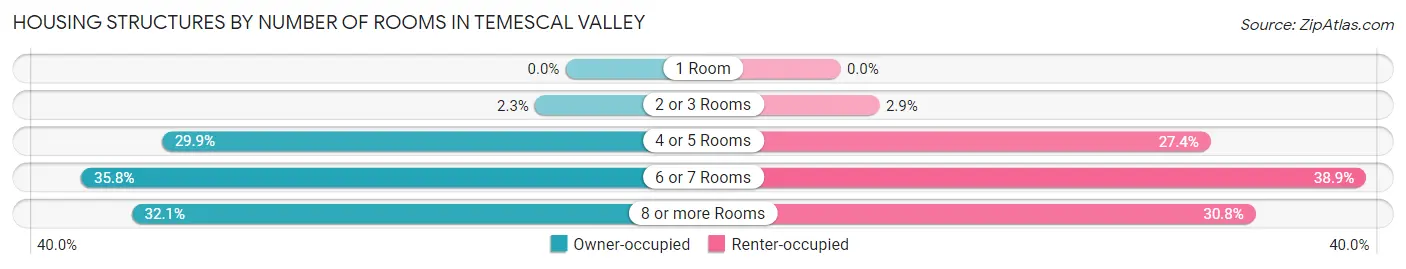
| Number of Rooms | Owner-occupied | Renter-occupied |
| 1 Room | 0 (0.0%) | 0 (0.0%) |
| 2 or 3 Rooms | 171 (2.3%) | 41 (2.9%) |
| 4 or 5 Rooms | 2,263 (29.8%) | 389 (27.4%) |
| 6 or 7 Rooms | 2,716 (35.8%) | 552 (38.9%) |
| 8 or more Rooms | 2,432 (32.1%) | 436 (30.7%) |
| Total | 7,582 (100.0%) | 1,418 (100.0%) |
Housing Structure by Heating Type in Temescal Valley
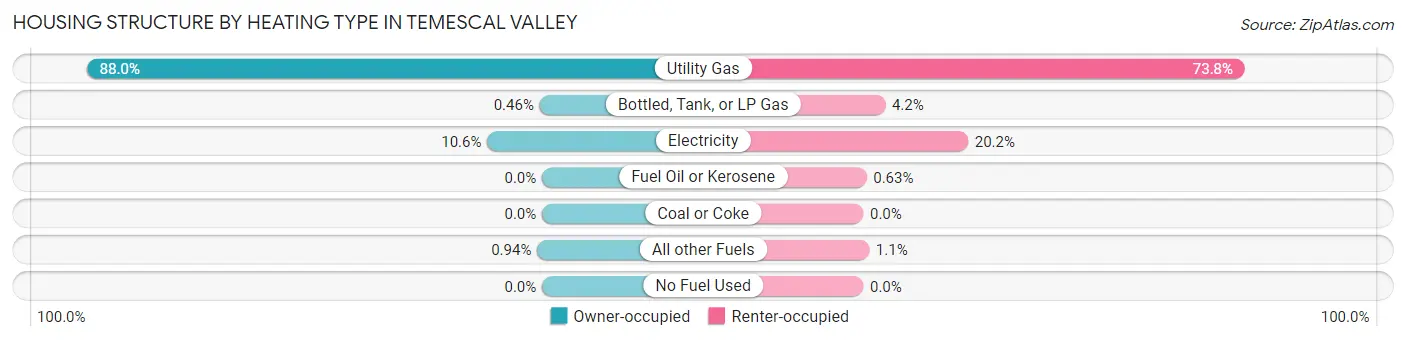
| Heating Type | Owner-occupied | Renter-occupied |
| Utility Gas | 6,673 (88.0%) | 1,046 (73.8%) |
| Bottled, Tank, or LP Gas | 35 (0.5%) | 60 (4.2%) |
| Electricity | 803 (10.6%) | 287 (20.2%) |
| Fuel Oil or Kerosene | 0 (0.0%) | 9 (0.6%) |
| Coal or Coke | 0 (0.0%) | 0 (0.0%) |
| All other Fuels | 71 (0.9%) | 16 (1.1%) |
| No Fuel Used | 0 (0.0%) | 0 (0.0%) |
| Total | 7,582 (100.0%) | 1,418 (100.0%) |
Household Vehicle Usage in Temescal Valley
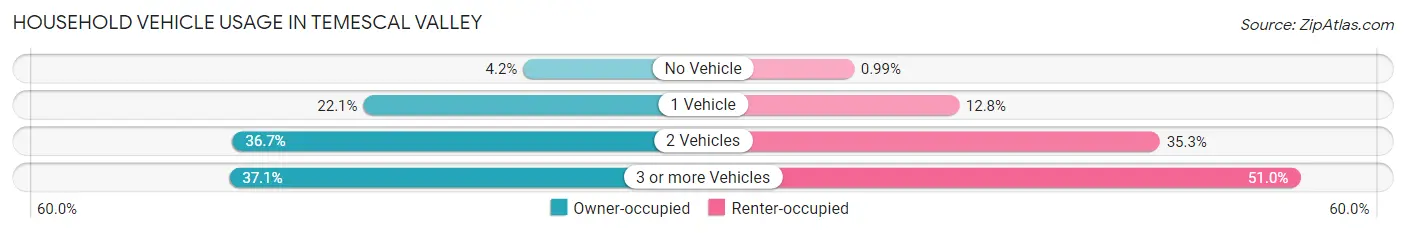
| Vehicles per Household | Owner-occupied | Renter-occupied |
| No Vehicle | 315 (4.2%) | 14 (1.0%) |
| 1 Vehicle | 1,672 (22.1%) | 181 (12.8%) |
| 2 Vehicles | 2,784 (36.7%) | 500 (35.3%) |
| 3 or more Vehicles | 2,811 (37.1%) | 723 (51.0%) |
| Total | 7,582 (100.0%) | 1,418 (100.0%) |
Real Estate & Mortgages in Temescal Valley
Real Estate and Mortgage Overview in Temescal Valley
| Characteristic | Without Mortgage | With Mortgage |
| Housing Units | 1,509 | 6,073 |
| Median Property Value | $588,100 | $620,300 |
| Median Household Income | $87,019 | $2,640 |
| Monthly Housing Costs | $839 | $3,117 |
| Real Estate Taxes | $4,866 | $59 |
Property Value by Mortgage Status in Temescal Valley
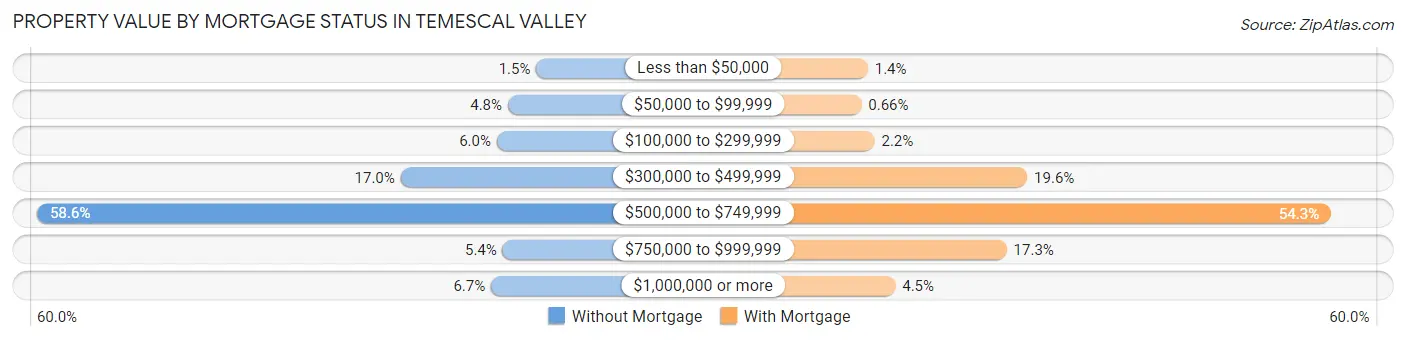
| Property Value | Without Mortgage | With Mortgage |
| Less than $50,000 | 23 (1.5%) | 85 (1.4%) |
| $50,000 to $99,999 | 72 (4.8%) | 40 (0.7%) |
| $100,000 to $299,999 | 91 (6.0%) | 132 (2.2%) |
| $300,000 to $499,999 | 257 (17.0%) | 1,191 (19.6%) |
| $500,000 to $749,999 | 884 (58.6%) | 3,300 (54.3%) |
| $750,000 to $999,999 | 81 (5.4%) | 1,049 (17.3%) |
| $1,000,000 or more | 101 (6.7%) | 276 (4.5%) |
| Total | 1,509 (100.0%) | 6,073 (100.0%) |
Household Income by Mortgage Status in Temescal Valley
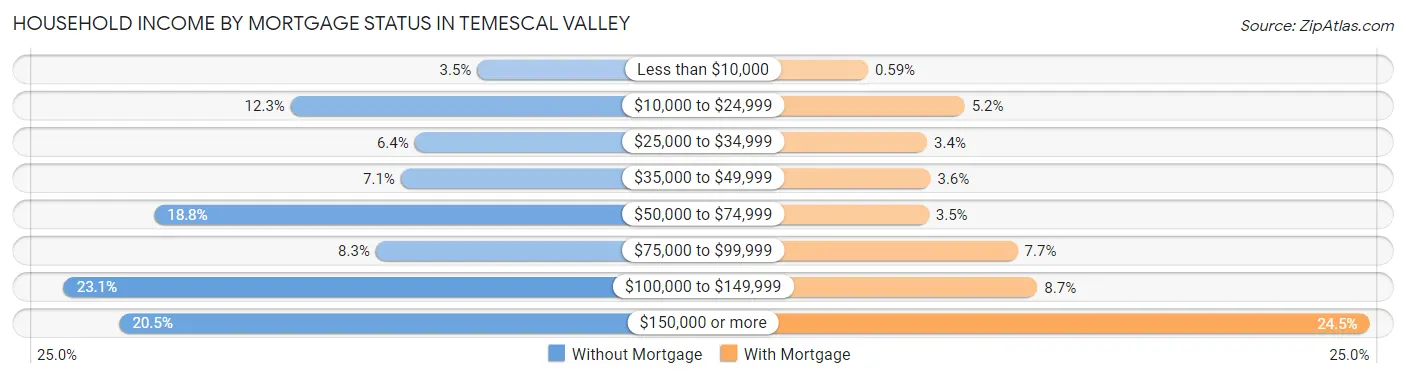
| Household Income | Without Mortgage | With Mortgage |
| Less than $10,000 | 52 (3.5%) | 36 (0.6%) |
| $10,000 to $24,999 | 186 (12.3%) | 316 (5.2%) |
| $25,000 to $34,999 | 97 (6.4%) | 207 (3.4%) |
| $35,000 to $49,999 | 107 (7.1%) | 217 (3.6%) |
| $50,000 to $74,999 | 284 (18.8%) | 212 (3.5%) |
| $75,000 to $99,999 | 125 (8.3%) | 469 (7.7%) |
| $100,000 to $149,999 | 349 (23.1%) | 526 (8.7%) |
| $150,000 or more | 309 (20.5%) | 1,486 (24.5%) |
| Total | 1,509 (100.0%) | 6,073 (100.0%) |
Property Value to Household Income Ratio in Temescal Valley
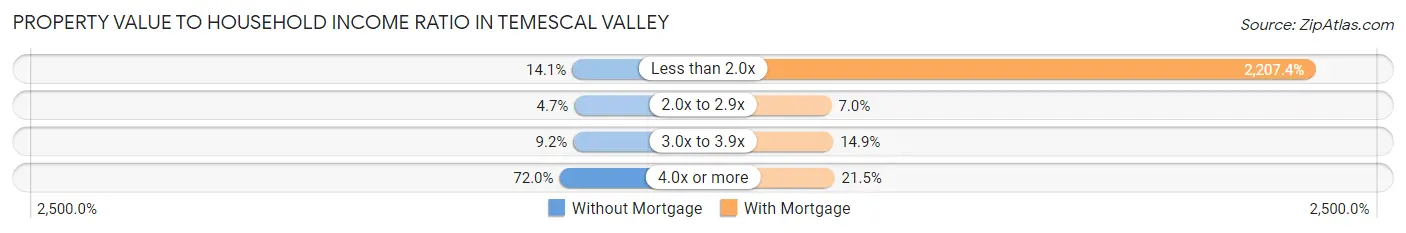
| Value-to-Income Ratio | Without Mortgage | With Mortgage |
| Less than 2.0x | 213 (14.1%) | 134,056 (2,207.4%) |
| 2.0x to 2.9x | 71 (4.7%) | 427 (7.0%) |
| 3.0x to 3.9x | 138 (9.1%) | 907 (14.9%) |
| 4.0x or more | 1,087 (72.0%) | 1,308 (21.5%) |
| Total | 1,509 (100.0%) | 6,073 (100.0%) |
Real Estate Taxes by Mortgage Status in Temescal Valley
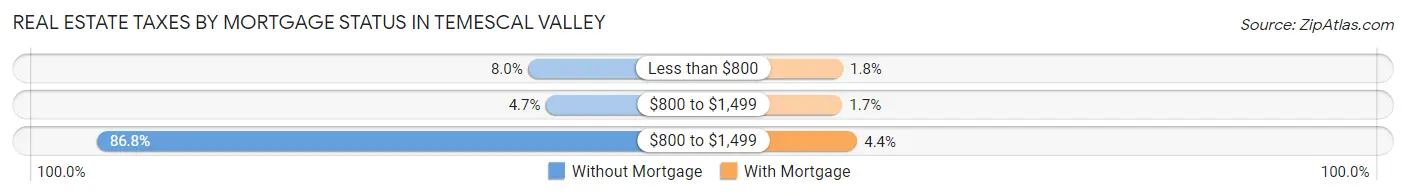
| Property Taxes | Without Mortgage | With Mortgage |
| Less than $800 | 120 (8.0%) | 112 (1.8%) |
| $800 to $1,499 | 71 (4.7%) | 104 (1.7%) |
| $800 to $1,499 | 1,310 (86.8%) | 269 (4.4%) |
| Total | 1,509 (100.0%) | 6,073 (100.0%) |
Health & Disability in Temescal Valley
Health Insurance Coverage by Age in Temescal Valley
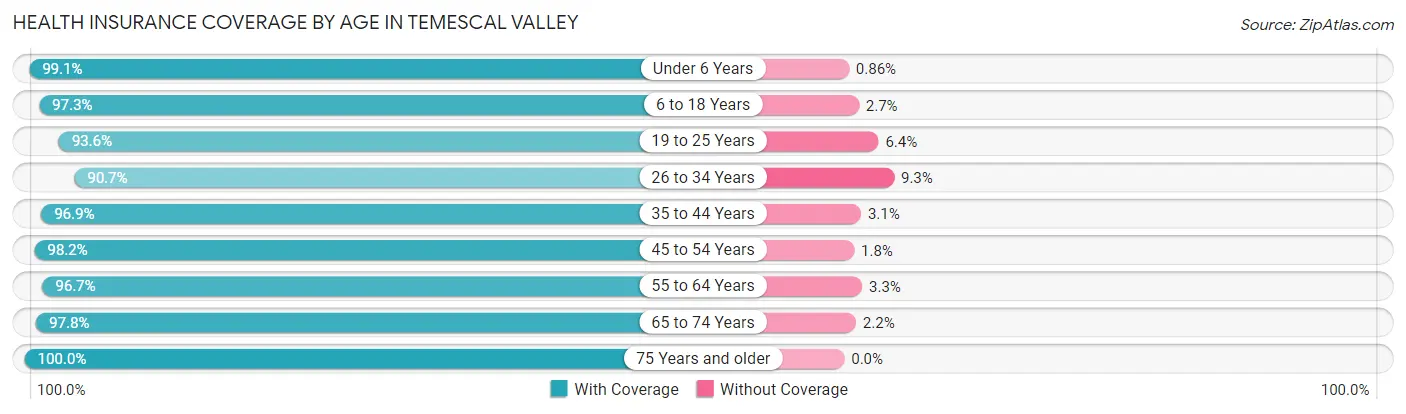
| Age Bracket | With Coverage | Without Coverage |
| Under 6 Years | 2,183 (99.1%) | 19 (0.9%) |
| 6 to 18 Years | 5,370 (97.3%) | 150 (2.7%) |
| 19 to 25 Years | 2,027 (93.6%) | 138 (6.4%) |
| 26 to 34 Years | 2,653 (90.7%) | 271 (9.3%) |
| 35 to 44 Years | 3,366 (96.9%) | 108 (3.1%) |
| 45 to 54 Years | 4,401 (98.2%) | 82 (1.8%) |
| 55 to 64 Years | 3,177 (96.7%) | 109 (3.3%) |
| 65 to 74 Years | 2,306 (97.8%) | 51 (2.2%) |
| 75 Years and older | 1,816 (100.0%) | 0 (0.0%) |
| Total | 27,299 (96.7%) | 928 (3.3%) |
Health Insurance Coverage by Citizenship Status in Temescal Valley
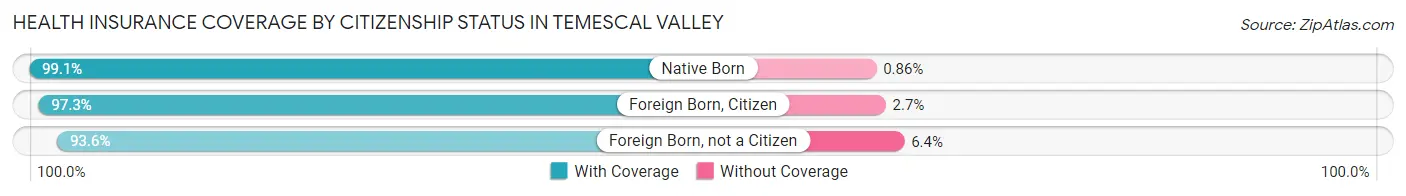
| Citizenship Status | With Coverage | Without Coverage |
| Native Born | 2,183 (99.1%) | 19 (0.9%) |
| Foreign Born, Citizen | 5,370 (97.3%) | 150 (2.7%) |
| Foreign Born, not a Citizen | 2,027 (93.6%) | 138 (6.4%) |
Health Insurance Coverage by Household Income in Temescal Valley
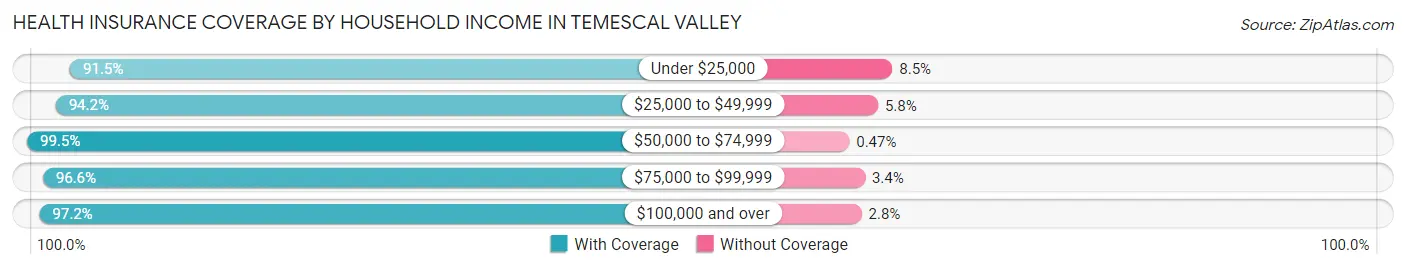
| Household Income | With Coverage | Without Coverage |
| Under $25,000 | 1,576 (91.5%) | 147 (8.5%) |
| $25,000 to $49,999 | 2,581 (94.2%) | 160 (5.8%) |
| $50,000 to $74,999 | 2,325 (99.5%) | 11 (0.5%) |
| $75,000 to $99,999 | 2,351 (96.6%) | 83 (3.4%) |
| $100,000 and over | 18,457 (97.2%) | 527 (2.8%) |
Public vs Private Health Insurance Coverage by Age in Temescal Valley
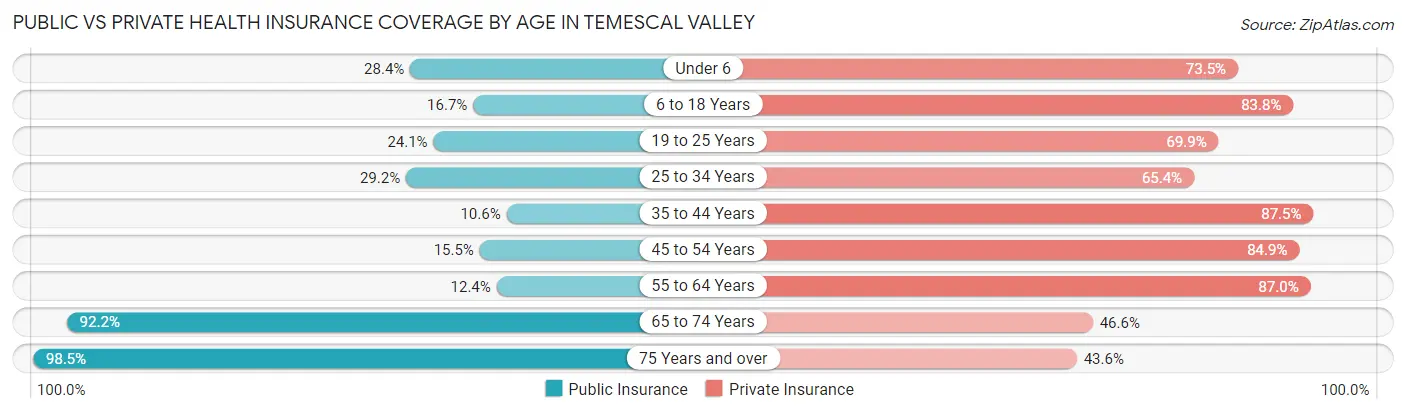
| Age Bracket | Public Insurance | Private Insurance |
| Under 6 | 626 (28.4%) | 1,619 (73.5%) |
| 6 to 18 Years | 924 (16.7%) | 4,625 (83.8%) |
| 19 to 25 Years | 522 (24.1%) | 1,514 (69.9%) |
| 25 to 34 Years | 854 (29.2%) | 1,911 (65.4%) |
| 35 to 44 Years | 367 (10.6%) | 3,040 (87.5%) |
| 45 to 54 Years | 696 (15.5%) | 3,806 (84.9%) |
| 55 to 64 Years | 407 (12.4%) | 2,859 (87.0%) |
| 65 to 74 Years | 2,173 (92.2%) | 1,098 (46.6%) |
| 75 Years and over | 1,788 (98.5%) | 792 (43.6%) |
| Total | 8,357 (29.6%) | 21,264 (75.3%) |
Disability Status by Sex by Age in Temescal Valley
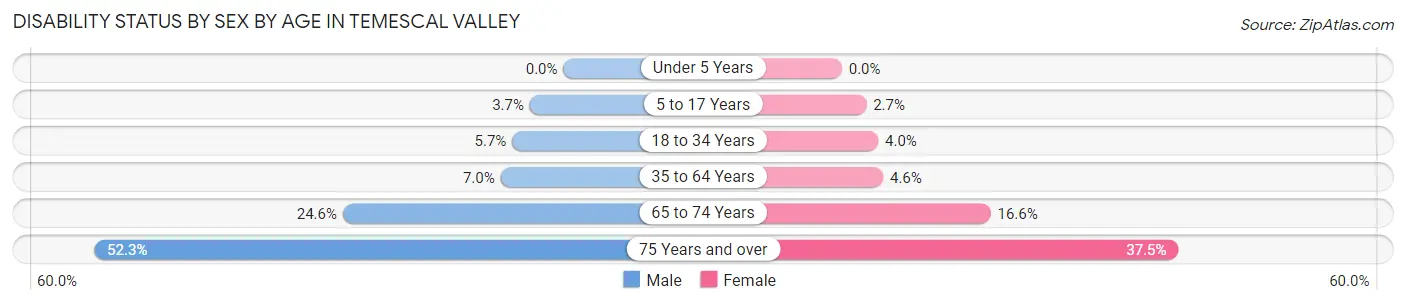
| Age Bracket | Male | Female |
| Under 5 Years | 0 (0.0%) | 0 (0.0%) |
| 5 to 17 Years | 86 (3.7%) | 79 (2.7%) |
| 18 to 34 Years | 177 (5.7%) | 106 (4.0%) |
| 35 to 64 Years | 384 (7.0%) | 264 (4.6%) |
| 65 to 74 Years | 278 (24.6%) | 203 (16.6%) |
| 75 Years and over | 546 (52.2%) | 289 (37.5%) |
Disability Class by Sex by Age in Temescal Valley
Disability Class: Hearing Difficulty
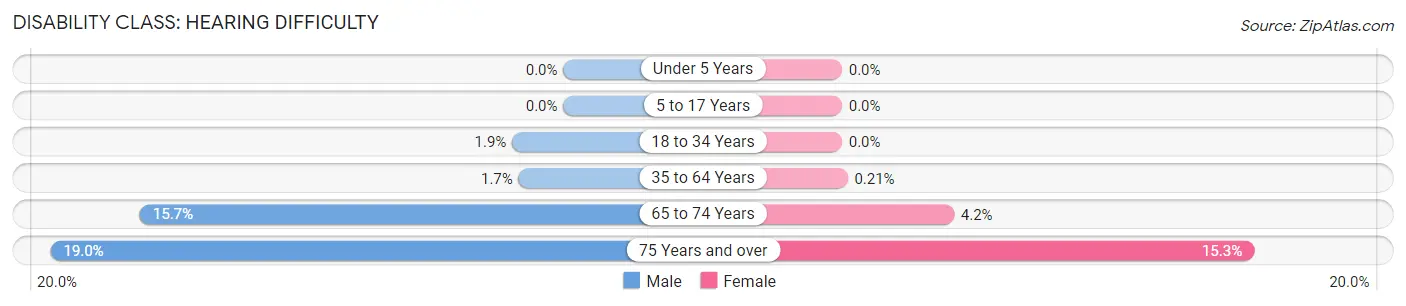
| Age Bracket | Male | Female |
| Under 5 Years | 0 (0.0%) | 0 (0.0%) |
| 5 to 17 Years | 0 (0.0%) | 0 (0.0%) |
| 18 to 34 Years | 59 (1.9%) | 0 (0.0%) |
| 35 to 64 Years | 91 (1.7%) | 12 (0.2%) |
| 65 to 74 Years | 178 (15.7%) | 51 (4.2%) |
| 75 Years and over | 199 (19.0%) | 118 (15.3%) |
Disability Class: Vision Difficulty

| Age Bracket | Male | Female |
| Under 5 Years | 0 (0.0%) | 0 (0.0%) |
| 5 to 17 Years | 0 (0.0%) | 13 (0.4%) |
| 18 to 34 Years | 23 (0.7%) | 48 (1.8%) |
| 35 to 64 Years | 120 (2.2%) | 31 (0.5%) |
| 65 to 74 Years | 0 (0.0%) | 27 (2.2%) |
| 75 Years and over | 289 (27.7%) | 40 (5.2%) |
Disability Class: Cognitive Difficulty
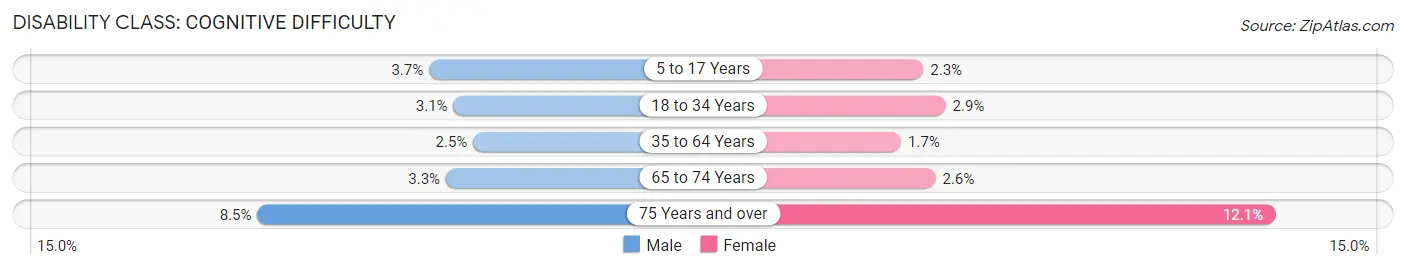
| Age Bracket | Male | Female |
| 5 to 17 Years | 86 (3.7%) | 66 (2.3%) |
| 18 to 34 Years | 95 (3.1%) | 76 (2.9%) |
| 35 to 64 Years | 138 (2.5%) | 95 (1.7%) |
| 65 to 74 Years | 37 (3.3%) | 32 (2.6%) |
| 75 Years and over | 89 (8.5%) | 93 (12.1%) |
Disability Class: Ambulatory Difficulty
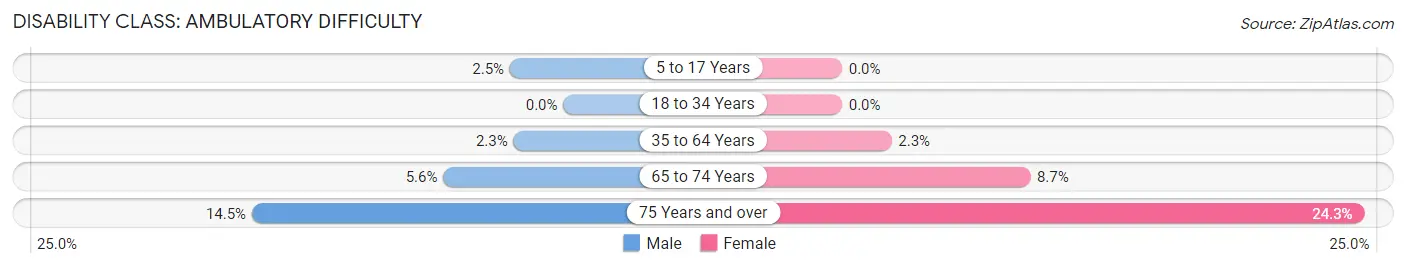
| Age Bracket | Male | Female |
| 5 to 17 Years | 57 (2.5%) | 0 (0.0%) |
| 18 to 34 Years | 0 (0.0%) | 0 (0.0%) |
| 35 to 64 Years | 127 (2.3%) | 132 (2.3%) |
| 65 to 74 Years | 63 (5.6%) | 107 (8.7%) |
| 75 Years and over | 151 (14.4%) | 187 (24.2%) |
Disability Class: Self-Care Difficulty
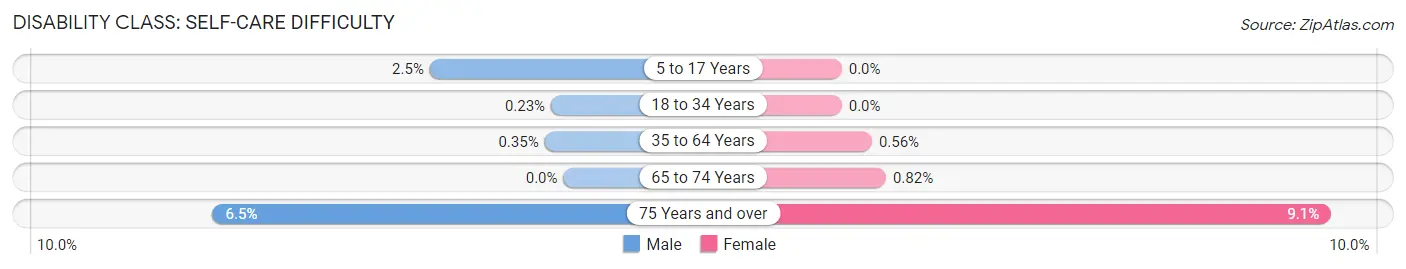
| Age Bracket | Male | Female |
| 5 to 17 Years | 57 (2.5%) | 0 (0.0%) |
| 18 to 34 Years | 7 (0.2%) | 0 (0.0%) |
| 35 to 64 Years | 19 (0.4%) | 32 (0.6%) |
| 65 to 74 Years | 0 (0.0%) | 10 (0.8%) |
| 75 Years and over | 68 (6.5%) | 70 (9.1%) |
Technology Access in Temescal Valley
Computing Device Access in Temescal Valley
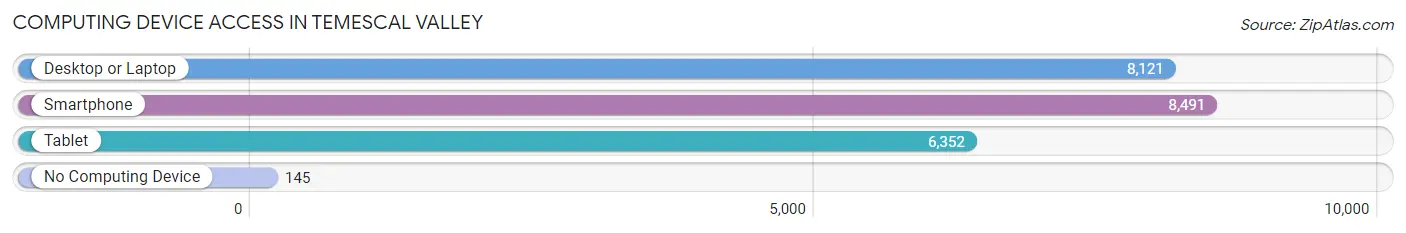
| Device Type | # Households | % Households |
| Desktop or Laptop | 8,121 | 90.2% |
| Smartphone | 8,491 | 94.3% |
| Tablet | 6,352 | 70.6% |
| No Computing Device | 145 | 1.6% |
| Total | 9,000 | 100.0% |
Internet Access in Temescal Valley
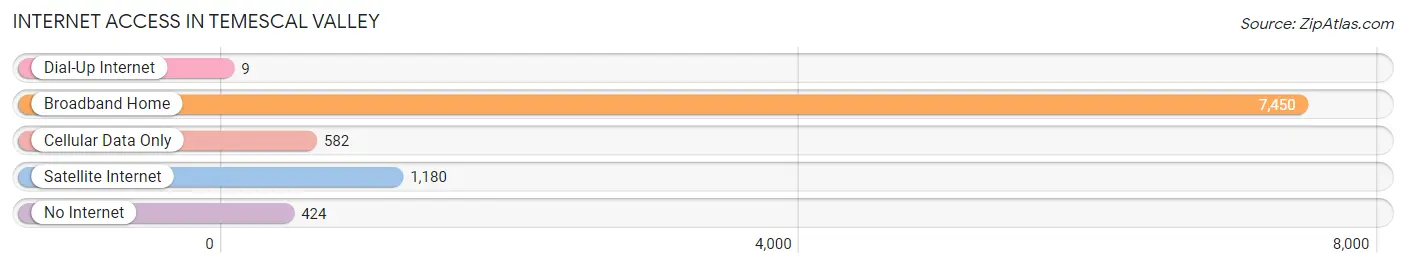
| Internet Type | # Households | % Households |
| Dial-Up Internet | 9 | 0.1% |
| Broadband Home | 7,450 | 82.8% |
| Cellular Data Only | 582 | 6.5% |
| Satellite Internet | 1,180 | 13.1% |
| No Internet | 424 | 4.7% |
| Total | 9,000 | 100.0% |
Temescal Valley Summary
Temescal Valley is a census-designated place located in Riverside County, California. It is situated in the foothills of the Santa Ana Mountains, and is part of the larger Temescal Valley region. The population of Temescal Valley was estimated to be 33,845 in 2019.
History
The Temescal Valley region has a long and rich history. The area was originally inhabited by the Cahuilla and Luiseño Native American tribes, who lived in the area for thousands of years before the arrival of Europeans. The first Europeans to settle in the area were Spanish missionaries, who established a mission in the area in 1776. The area was later settled by American settlers in the mid-1800s, and the town of Temescal was established in 1887.
The area was primarily agricultural until the 1950s, when the population began to grow rapidly due to the development of the nearby cities of Corona and Riverside. The area was officially designated as a census-designated place in 2000.
Geography
Temescal Valley is located in the foothills of the Santa Ana Mountains in Riverside County, California. It is situated at an elevation of 1,000 feet above sea level. The area is bordered by the cities of Corona to the north, Lake Elsinore to the east, and Murrieta to the south. The area is approximately 25 miles from the Pacific Ocean.
The climate in Temescal Valley is classified as Mediterranean, with hot, dry summers and mild, wet winters. The average annual temperature is 68°F, and the average annual precipitation is 12.5 inches.
Economy
The economy of Temescal Valley is primarily driven by the service sector, with the largest employers in the area being retail stores, restaurants, and healthcare providers. The area is also home to several manufacturing companies, including a large automotive parts manufacturer.
The median household income in Temescal Valley is $87,845, and the median home value is $521,000. The unemployment rate in the area is 3.7%, which is lower than the national average.
Demographics
As of 2019, the population of Temescal Valley was estimated to be 33,845. The population is primarily white (77.3%), followed by Hispanic or Latino (14.2%), Asian (4.2%), and African American (2.3%). The median age in the area is 37.7 years, and the median household income is $87,845.
The majority of the population (77.3%) is married, and the majority of households (63.2%) own their homes. The average household size is 3.2 people. The area is served by the Corona-Norco Unified School District.
Common Questions
What is Per Capita Income in Temescal Valley?
Per Capita income in Temescal Valley is $49,432.
What is the Median Family Income in Temescal Valley?
Median Family Income in Temescal Valley is $131,303.
What is the Median Household income in Temescal Valley?
Median Household Income in Temescal Valley is $116,672.
What is Income or Wage Gap in Temescal Valley?
Income or Wage Gap in Temescal Valley is 37.0%.
Women in Temescal Valley earn 63.0 cents for every dollar earned by a man.
What is Inequality or Gini Index in Temescal Valley?
Inequality or Gini Index in Temescal Valley is 0.45.
What is the Total Population of Temescal Valley?
Total Population of Temescal Valley is 28,227.
What is the Total Male Population of Temescal Valley?
Total Male Population of Temescal Valley is 13,957.
What is the Total Female Population of Temescal Valley?
Total Female Population of Temescal Valley is 14,270.
What is the Ratio of Males per 100 Females in Temescal Valley?
There are 97.81 Males per 100 Females in Temescal Valley.
What is the Ratio of Females per 100 Males in Temescal Valley?
There are 102.24 Females per 100 Males in Temescal Valley.
What is the Median Population Age in Temescal Valley?
Median Population Age in Temescal Valley is 39.7 Years.
What is the Average Family Size in Temescal Valley
Average Family Size in Temescal Valley is 3.6 People.
What is the Average Household Size in Temescal Valley
Average Household Size in Temescal Valley is 3.1 People.
How Large is the Labor Force in Temescal Valley?
There are 13,591 People in the Labor Forcein in Temescal Valley.
What is the Percentage of People in the Labor Force in Temescal Valley?
61.9% of People are in the Labor Force in Temescal Valley.
What is the Unemployment Rate in Temescal Valley?
Unemployment Rate in Temescal Valley is 5.1%.