Cities with the Highest Percentage of African Population in Indiana
RELATED REPORTS & OPTIONS
African
Indiana
Compare Cities
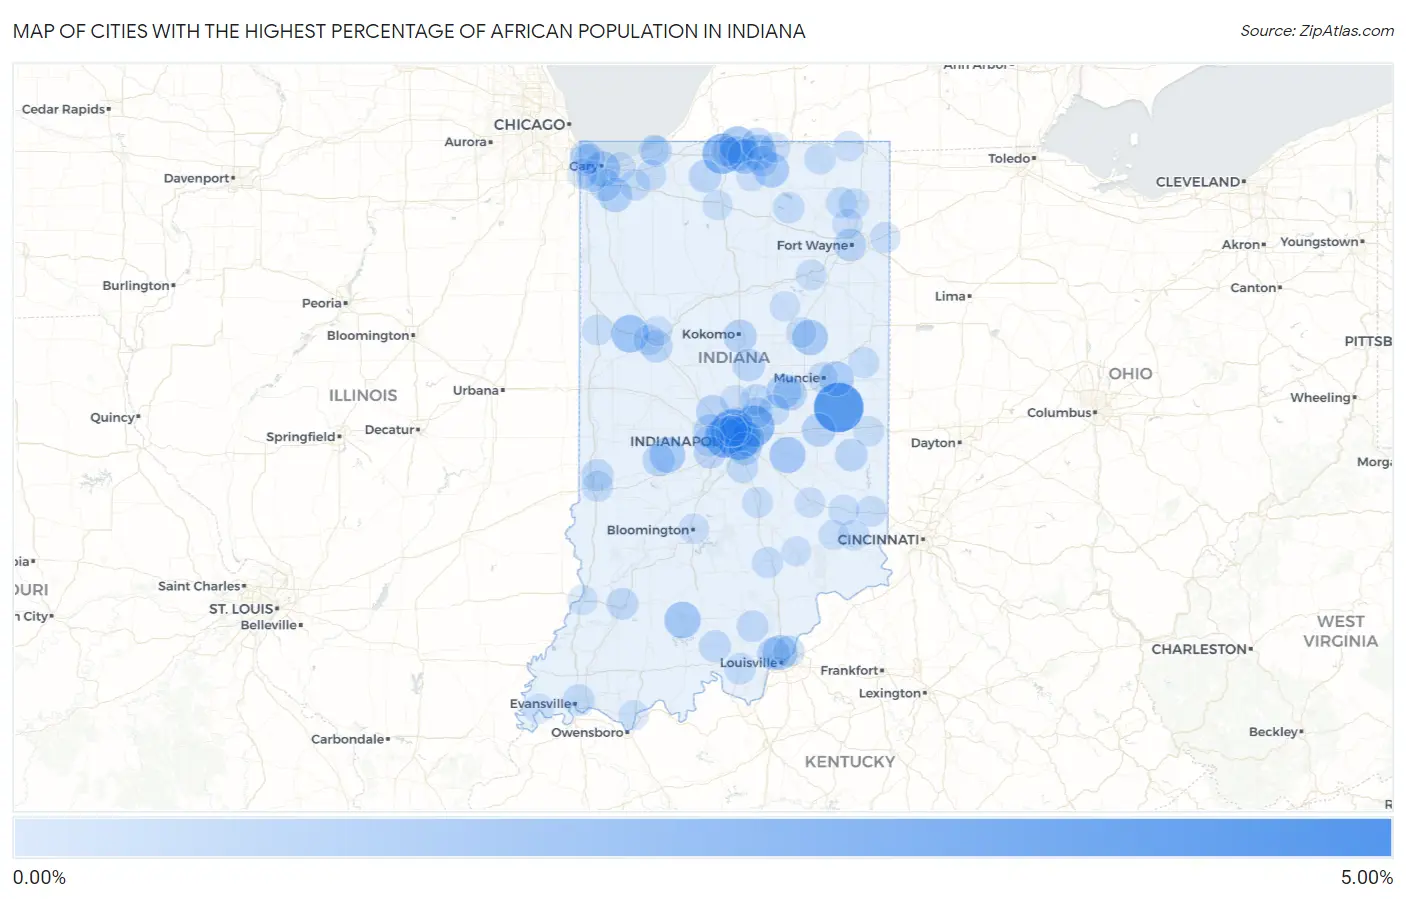
Map of Cities with the Highest Percentage of African Population in Indiana
0.00%
5.00%
Cities with the Highest Percentage of African Population in Indiana
| City | African | vs State | vs National | |
| 1. | Putnamville | 4.40% | 0.58%(+3.82)#1 | 0.57%(+3.84)#388 |
| 2. | Mooreland | 3.98% | 0.58%(+3.40)#2 | 0.57%(+3.41)#437 |
| 3. | Spring Hill | 2.78% | 0.58%(+2.20)#3 | 0.57%(+2.21)#691 |
| 4. | Indianapolis | 2.50% | 0.58%(+1.92)#4 | 0.57%(+1.94)#784 |
| 5. | Lawrence | 2.33% | 0.58%(+1.75)#5 | 0.57%(+1.77)#849 |
| 6. | Speedway | 2.19% | 0.58%(+1.61)#6 | 0.57%(+1.63)#919 |
| 7. | South Bend | 2.09% | 0.58%(+1.52)#7 | 0.57%(+1.53)#972 |
| 8. | Otterbein | 1.59% | 0.58%(+1.01)#8 | 0.57%(+1.02)#1,335 |
| 9. | Granger | 1.50% | 0.58%(+0.923)#9 | 0.57%(+0.937)#1,402 |
| 10. | Ardmore | 1.44% | 0.58%(+0.857)#10 | 0.57%(+0.871)#1,491 |
| 11. | French Lick | 1.37% | 0.58%(+0.791)#11 | 0.57%(+0.805)#1,575 |
| 12. | Morristown | 1.29% | 0.58%(+0.714)#12 | 0.57%(+0.727)#1,693 |
| 13. | Upland | 1.19% | 0.58%(+0.607)#13 | 0.57%(+0.621)#1,827 |
| 14. | Fillmore | 1.17% | 0.58%(+0.594)#14 | 0.57%(+0.608)#1,850 |
| 15. | Elkhart | 1.16% | 0.58%(+0.581)#15 | 0.57%(+0.595)#1,864 |
| 16. | Mishawaka | 1.12% | 0.58%(+0.541)#16 | 0.57%(+0.555)#1,928 |
| 17. | Gary | 1.12% | 0.58%(+0.541)#17 | 0.57%(+0.554)#1,930 |
| 18. | Goshen | 1.12% | 0.58%(+0.536)#18 | 0.57%(+0.550)#1,940 |
| 19. | Osceola | 1.08% | 0.58%(+0.503)#19 | 0.57%(+0.516)#1,992 |
| 20. | Clarksville | 1.05% | 0.58%(+0.471)#20 | 0.57%(+0.485)#2,051 |
| 21. | Selma | 1.05% | 0.58%(+0.469)#21 | 0.57%(+0.482)#2,056 |
| 22. | Edgewood | 0.96% | 0.58%(+0.386)#22 | 0.57%(+0.400)#2,204 |
| 23. | Warren Park | 0.95% | 0.58%(+0.370)#23 | 0.57%(+0.384)#2,239 |
| 24. | Lakes Of The Four Seasons | 0.94% | 0.58%(+0.357)#24 | 0.57%(+0.370)#2,266 |
| 25. | Brownsburg | 0.82% | 0.58%(+0.245)#25 | 0.57%(+0.258)#2,519 |
| 26. | Anderson | 0.82% | 0.58%(+0.243)#26 | 0.57%(+0.256)#2,528 |
| 27. | Kokomo | 0.78% | 0.58%(+0.202)#27 | 0.57%(+0.216)#2,642 |
| 28. | Spiceland | 0.78% | 0.58%(+0.200)#28 | 0.57%(+0.214)#2,651 |
| 29. | Meridian Hills | 0.69% | 0.58%(+0.109)#29 | 0.57%(+0.122)#2,925 |
| 30. | New Albany | 0.68% | 0.58%(+0.105)#30 | 0.57%(+0.118)#2,937 |
| 31. | Whitestown | 0.67% | 0.58%(+0.094)#31 | 0.57%(+0.108)#2,968 |
| 32. | Beech Grove | 0.65% | 0.58%(+0.073)#32 | 0.57%(+0.087)#3,037 |
| 33. | Rocky Ripple | 0.65% | 0.58%(+0.073)#33 | 0.57%(+0.086)#3,040 |
| 34. | North Liberty | 0.64% | 0.58%(+0.058)#34 | 0.57%(+0.072)#3,094 |
| 35. | Connersville | 0.63% | 0.58%(+0.048)#35 | 0.57%(+0.062)#3,128 |
| 36. | Lafayette | 0.62% | 0.58%(+0.039)#36 | 0.57%(+0.053)#3,166 |
| 37. | Greencastle | 0.62% | 0.58%(+0.039)#37 | 0.57%(+0.053)#3,167 |
| 38. | Merrillville | 0.61% | 0.58%(+0.034)#38 | 0.57%(+0.048)#3,185 |
| 39. | Tipton | 0.61% | 0.58%(+0.030)#39 | 0.57%(+0.044)#3,203 |
| 40. | Fort Wayne | 0.61% | 0.58%(+0.026)#40 | 0.57%(+0.040)#3,216 |
| 41. | Plainfield | 0.55% | 0.58%(-0.026)#41 | 0.57%(-0.012)#3,424 |
| 42. | Simonton Lake | 0.53% | 0.58%(-0.049)#42 | 0.57%(-0.035)#3,508 |
| 43. | North Terre Haute | 0.52% | 0.58%(-0.062)#43 | 0.57%(-0.048)#3,561 |
| 44. | Marengo | 0.50% | 0.58%(-0.077)#44 | 0.57%(-0.063)#3,631 |
| 45. | New Pekin | 0.49% | 0.58%(-0.089)#45 | 0.57%(-0.075)#3,683 |
| 46. | Noblesville | 0.49% | 0.58%(-0.093)#46 | 0.57%(-0.080)#3,706 |
| 47. | Washington | 0.47% | 0.58%(-0.107)#47 | 0.57%(-0.093)#3,780 |
| 48. | Wynnedale | 0.46% | 0.58%(-0.120)#48 | 0.57%(-0.107)#3,848 |
| 49. | Evansville | 0.44% | 0.58%(-0.136)#49 | 0.57%(-0.122)#3,921 |
| 50. | Greenwood | 0.42% | 0.58%(-0.159)#50 | 0.57%(-0.145)#4,052 |
| 51. | North Webster | 0.42% | 0.58%(-0.163)#51 | 0.57%(-0.150)#4,075 |
| 52. | Jeffersonville | 0.38% | 0.58%(-0.197)#52 | 0.57%(-0.184)#4,241 |
| 53. | Corydon | 0.38% | 0.58%(-0.198)#53 | 0.57%(-0.185)#4,251 |
| 54. | Lagrange | 0.36% | 0.58%(-0.220)#54 | 0.57%(-0.206)#4,361 |
| 55. | Seymour | 0.36% | 0.58%(-0.223)#55 | 0.57%(-0.210)#4,384 |
| 56. | Hammond | 0.36% | 0.58%(-0.224)#56 | 0.57%(-0.210)#4,386 |
| 57. | Ridgeville | 0.35% | 0.58%(-0.230)#57 | 0.57%(-0.216)#4,421 |
| 58. | Trail Creek | 0.35% | 0.58%(-0.232)#58 | 0.57%(-0.218)#4,427 |
| 59. | Griffith | 0.35% | 0.58%(-0.233)#59 | 0.57%(-0.219)#4,431 |
| 60. | Terre Haute | 0.34% | 0.58%(-0.241)#60 | 0.57%(-0.227)#4,493 |
| 61. | Valparaiso | 0.34% | 0.58%(-0.244)#61 | 0.57%(-0.230)#4,504 |
| 62. | Avilla | 0.33% | 0.58%(-0.246)#62 | 0.57%(-0.232)#4,512 |
| 63. | Ingalls | 0.33% | 0.58%(-0.246)#63 | 0.57%(-0.233)#4,513 |
| 64. | Dunlap | 0.32% | 0.58%(-0.255)#64 | 0.57%(-0.242)#4,561 |
| 65. | West Lafayette | 0.32% | 0.58%(-0.262)#65 | 0.57%(-0.249)#4,607 |
| 66. | Edinburgh | 0.31% | 0.58%(-0.265)#66 | 0.57%(-0.252)#4,623 |
| 67. | Garrett | 0.30% | 0.58%(-0.284)#67 | 0.57%(-0.270)#4,734 |
| 68. | Avon | 0.29% | 0.58%(-0.290)#68 | 0.57%(-0.276)#4,777 |
| 69. | Boswell | 0.29% | 0.58%(-0.292)#69 | 0.57%(-0.278)#4,787 |
| 70. | Huntington | 0.28% | 0.58%(-0.297)#70 | 0.57%(-0.283)#4,819 |
| 71. | St Leon | 0.28% | 0.58%(-0.301)#71 | 0.57%(-0.287)#4,852 |
| 72. | Westville | 0.27% | 0.58%(-0.307)#72 | 0.57%(-0.293)#4,888 |
| 73. | Muncie | 0.26% | 0.58%(-0.315)#73 | 0.57%(-0.301)#4,945 |
| 74. | Gas City | 0.26% | 0.58%(-0.317)#74 | 0.57%(-0.303)#4,958 |
| 75. | Batesville | 0.26% | 0.58%(-0.324)#75 | 0.57%(-0.310)#5,016 |
| 76. | Centerville | 0.25% | 0.58%(-0.325)#76 | 0.57%(-0.312)#5,027 |
| 77. | Fishers | 0.25% | 0.58%(-0.326)#77 | 0.57%(-0.312)#5,030 |
| 78. | Milan | 0.25% | 0.58%(-0.327)#78 | 0.57%(-0.313)#5,039 |
| 79. | Woodburn | 0.24% | 0.58%(-0.335)#79 | 0.57%(-0.321)#5,102 |
| 80. | Portage | 0.23% | 0.58%(-0.351)#80 | 0.57%(-0.337)#5,242 |
| 81. | Orland | 0.22% | 0.58%(-0.355)#81 | 0.57%(-0.341)#5,275 |
| 82. | La Fontaine | 0.22% | 0.58%(-0.356)#82 | 0.57%(-0.342)#5,285 |
| 83. | Huntertown | 0.22% | 0.58%(-0.359)#83 | 0.57%(-0.345)#5,296 |
| 84. | East Chicago | 0.22% | 0.58%(-0.359)#84 | 0.57%(-0.345)#5,297 |
| 85. | Bloomington | 0.22% | 0.58%(-0.363)#85 | 0.57%(-0.349)#5,325 |
| 86. | Munster | 0.21% | 0.58%(-0.364)#86 | 0.57%(-0.350)#5,340 |
| 87. | Bristol | 0.21% | 0.58%(-0.364)#87 | 0.57%(-0.351)#5,342 |
| 88. | Plymouth | 0.21% | 0.58%(-0.367)#88 | 0.57%(-0.353)#5,361 |
| 89. | Michigan City | 0.21% | 0.58%(-0.373)#89 | 0.57%(-0.359)#5,416 |
| 90. | Greensburg | 0.20% | 0.58%(-0.378)#90 | 0.57%(-0.364)#5,451 |
| 91. | Notre Dame | 0.20% | 0.58%(-0.378)#91 | 0.57%(-0.365)#5,455 |
| 92. | Osgood | 0.18% | 0.58%(-0.400)#92 | 0.57%(-0.386)#5,638 |
| 93. | Whiting | 0.17% | 0.58%(-0.404)#93 | 0.57%(-0.390)#5,680 |
| 94. | Mount Vernon | 0.17% | 0.58%(-0.409)#94 | 0.57%(-0.396)#5,732 |
| 95. | Wakarusa | 0.16% | 0.58%(-0.418)#95 | 0.57%(-0.405)#5,811 |
| 96. | Westfield | 0.16% | 0.58%(-0.419)#96 | 0.57%(-0.406)#5,820 |
| 97. | North Vernon | 0.16% | 0.58%(-0.420)#97 | 0.57%(-0.407)#5,827 |
| 98. | Battle Ground | 0.14% | 0.58%(-0.434)#98 | 0.57%(-0.421)#5,950 |
| 99. | Vincennes | 0.14% | 0.58%(-0.435)#99 | 0.57%(-0.422)#5,958 |
| 100. | Rockport | 0.14% | 0.58%(-0.442)#100 | 0.57%(-0.428)#6,011 |
Common Questions
What are the Top 10 Cities with the Highest Percentage of African Population in Indiana?
Top 10 Cities with the Highest Percentage of African Population in Indiana are:
#1
3.98%
#2
2.78%
#3
2.50%
#4
2.33%
#5
2.19%
#6
2.09%
#7
1.59%
#8
1.50%
#9
1.37%
#10
1.29%
What city has the Highest Percentage of African Population in Indiana?
Mooreland has the Highest Percentage of African Population in Indiana with 3.98%.
What is the Percentage of African Population in the State of Indiana?
Percentage of African Population in Indiana is 0.58%.
What is the Percentage of African Population in the United States?
Percentage of African Population in the United States is 0.57%.