Cities with the Highest Percentage of African Population in Massachusetts
RELATED REPORTS & OPTIONS
African
Massachusetts
Compare Cities
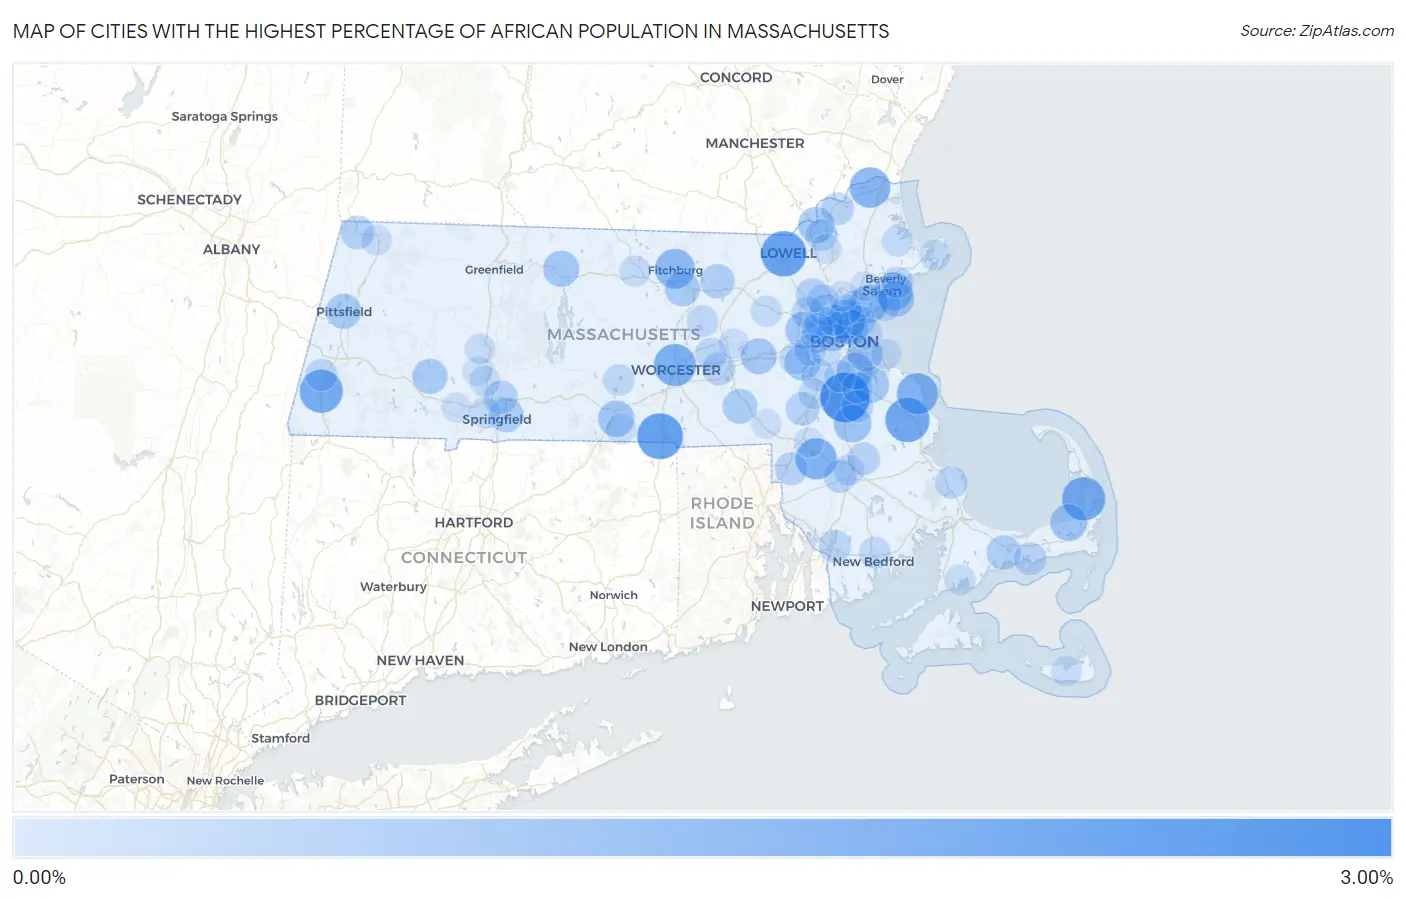
Map of Cities with the Highest Percentage of African Population in Massachusetts
0.00%
3.00%
Cities with the Highest Percentage of African Population in Massachusetts
| City | African | vs State | vs National | |
| 1. | Randolph Town | 2.68% | 0.46%(+2.21)#1 | 0.57%(+2.11)#723 |
| 2. | Webster | 2.14% | 0.46%(+1.68)#2 | 0.57%(+1.58)#943 |
| 3. | Oak Bluffs | 2.10% | 0.46%(+1.64)#3 | 0.57%(+1.54)#965 |
| 4. | Lowell | 2.08% | 0.46%(+1.61)#4 | 0.57%(+1.51)#982 |
| 5. | North Pembroke | 1.92% | 0.46%(+1.46)#5 | 0.57%(+1.36)#1,075 |
| 6. | Great Barrington | 1.80% | 0.46%(+1.34)#6 | 0.57%(+1.23)#1,145 |
| 7. | North Eastham | 1.78% | 0.46%(+1.31)#7 | 0.57%(+1.21)#1,166 |
| 8. | Worcester | 1.64% | 0.46%(+1.18)#8 | 0.57%(+1.08)#1,286 |
| 9. | Scituate | 1.53% | 0.46%(+1.06)#9 | 0.57%(+0.960)#1,383 |
| 10. | Norton Center | 1.51% | 0.46%(+1.05)#10 | 0.57%(+0.946)#1,395 |
| 11. | Amesbury Town | 1.43% | 0.46%(+0.968)#11 | 0.57%(+0.864)#1,501 |
| 12. | Fitchburg | 1.32% | 0.46%(+0.855)#12 | 0.57%(+0.751)#1,656 |
| 13. | Salem | 1.07% | 0.46%(+0.610)#13 | 0.57%(+0.506)#2,016 |
| 14. | Lynn | 1.05% | 0.46%(+0.593)#14 | 0.57%(+0.489)#2,043 |
| 15. | Malden | 1.02% | 0.46%(+0.555)#15 | 0.57%(+0.450)#2,106 |
| 16. | Brockton | 1.00% | 0.46%(+0.542)#16 | 0.57%(+0.438)#2,124 |
| 17. | Quincy | 0.92% | 0.46%(+0.463)#17 | 0.57%(+0.359)#2,294 |
| 18. | Brewster | 0.92% | 0.46%(+0.459)#18 | 0.57%(+0.355)#2,310 |
| 19. | Everett | 0.91% | 0.46%(+0.445)#19 | 0.57%(+0.340)#2,331 |
| 20. | Sturbridge | 0.86% | 0.46%(+0.394)#20 | 0.57%(+0.290)#2,445 |
| 21. | Waltham | 0.85% | 0.46%(+0.387)#21 | 0.57%(+0.283)#2,462 |
| 22. | Methuen Town | 0.81% | 0.46%(+0.347)#22 | 0.57%(+0.243)#2,555 |
| 23. | Orange | 0.80% | 0.46%(+0.343)#23 | 0.57%(+0.239)#2,573 |
| 24. | Needham | 0.80% | 0.46%(+0.337)#24 | 0.57%(+0.233)#2,589 |
| 25. | Marblehead | 0.80% | 0.46%(+0.335)#25 | 0.57%(+0.231)#2,597 |
| 26. | Weymouth Town | 0.77% | 0.46%(+0.307)#26 | 0.57%(+0.203)#2,686 |
| 27. | Framingham | 0.76% | 0.46%(+0.303)#27 | 0.57%(+0.199)#2,704 |
| 28. | Boston | 0.73% | 0.46%(+0.272)#28 | 0.57%(+0.168)#2,787 |
| 29. | Huntington | 0.69% | 0.46%(+0.232)#29 | 0.57%(+0.128)#2,905 |
| 30. | Pittsfield | 0.69% | 0.46%(+0.229)#30 | 0.57%(+0.125)#2,915 |
| 31. | Leominster | 0.68% | 0.46%(+0.217)#31 | 0.57%(+0.113)#2,949 |
| 32. | Milford | 0.64% | 0.46%(+0.181)#32 | 0.57%(+0.077)#3,075 |
| 33. | Amherst | 0.63% | 0.46%(+0.168)#33 | 0.57%(+0.064)#3,124 |
| 34. | Cambridge | 0.62% | 0.46%(+0.157)#34 | 0.57%(+0.053)#3,172 |
| 35. | Springfield | 0.61% | 0.46%(+0.150)#35 | 0.57%(+0.046)#3,194 |
| 36. | Chelsea | 0.61% | 0.46%(+0.145)#36 | 0.57%(+0.041)#3,214 |
| 37. | Barnstable Town | 0.57% | 0.46%(+0.109)#37 | 0.57%(+0.005)#3,354 |
| 38. | Devens | 0.57% | 0.46%(+0.106)#38 | 0.57%(+0.002)#3,364 |
| 39. | Burlington | 0.50% | 0.46%(+0.036)#39 | 0.57%(-0.069)#3,649 |
| 40. | Williamstown | 0.49% | 0.46%(+0.028)#40 | 0.57%(-0.076)#3,689 |
| 41. | Somerville | 0.48% | 0.46%(+0.022)#41 | 0.57%(-0.082)#3,715 |
| 42. | Walpole | 0.47% | 0.46%(+0.010)#42 | 0.57%(-0.095)#3,789 |
| 43. | Chicopee | 0.44% | 0.46%(-0.023)#43 | 0.57%(-0.127)#3,952 |
| 44. | Westborough | 0.41% | 0.46%(-0.050)#44 | 0.57%(-0.154)#4,103 |
| 45. | Taunton | 0.41% | 0.46%(-0.054)#45 | 0.57%(-0.158)#4,120 |
| 46. | Attleboro | 0.39% | 0.46%(-0.067)#46 | 0.57%(-0.171)#4,182 |
| 47. | Haverhill | 0.39% | 0.46%(-0.075)#47 | 0.57%(-0.179)#4,216 |
| 48. | Watertown Town | 0.36% | 0.46%(-0.097)#48 | 0.57%(-0.202)#4,336 |
| 49. | West Yarmouth | 0.36% | 0.46%(-0.100)#49 | 0.57%(-0.205)#4,352 |
| 50. | Bridgewater Town | 0.36% | 0.46%(-0.104)#50 | 0.57%(-0.208)#4,375 |
| 51. | The Pinehills | 0.33% | 0.46%(-0.130)#51 | 0.57%(-0.234)#4,519 |
| 52. | Fall River | 0.33% | 0.46%(-0.136)#52 | 0.57%(-0.240)#4,548 |
| 53. | Dedham | 0.31% | 0.46%(-0.155)#53 | 0.57%(-0.259)#4,665 |
| 54. | Housatonic | 0.30% | 0.46%(-0.157)#54 | 0.57%(-0.261)#4,677 |
| 55. | Holbrook | 0.30% | 0.46%(-0.161)#55 | 0.57%(-0.265)#4,702 |
| 56. | Lexington | 0.30% | 0.46%(-0.163)#56 | 0.57%(-0.267)#4,712 |
| 57. | Northborough | 0.27% | 0.46%(-0.192)#57 | 0.57%(-0.296)#4,911 |
| 58. | Lawrence | 0.26% | 0.46%(-0.202)#58 | 0.57%(-0.306)#4,985 |
| 59. | Saugus | 0.25% | 0.46%(-0.209)#59 | 0.57%(-0.313)#5,042 |
| 60. | Swampscott | 0.25% | 0.46%(-0.210)#60 | 0.57%(-0.314)#5,050 |
| 61. | North Attleborough | 0.25% | 0.46%(-0.211)#61 | 0.57%(-0.315)#5,056 |
| 62. | Wellesley | 0.24% | 0.46%(-0.220)#62 | 0.57%(-0.324)#5,126 |
| 63. | Arlington | 0.24% | 0.46%(-0.224)#63 | 0.57%(-0.328)#5,160 |
| 64. | Winchester | 0.24% | 0.46%(-0.224)#64 | 0.57%(-0.329)#5,166 |
| 65. | Beverly | 0.24% | 0.46%(-0.225)#65 | 0.57%(-0.330)#5,175 |
| 66. | Milton | 0.23% | 0.46%(-0.229)#66 | 0.57%(-0.333)#5,206 |
| 67. | Winthrop Town | 0.23% | 0.46%(-0.230)#67 | 0.57%(-0.334)#5,213 |
| 68. | New Bedford | 0.23% | 0.46%(-0.232)#68 | 0.57%(-0.336)#5,231 |
| 69. | Woburn | 0.23% | 0.46%(-0.234)#69 | 0.57%(-0.338)#5,254 |
| 70. | Newton | 0.22% | 0.46%(-0.237)#70 | 0.57%(-0.342)#5,276 |
| 71. | East Brookfield | 0.22% | 0.46%(-0.238)#71 | 0.57%(-0.342)#5,283 |
| 72. | Clinton | 0.22% | 0.46%(-0.244)#72 | 0.57%(-0.348)#5,319 |
| 73. | West Springfield Town | 0.21% | 0.46%(-0.256)#73 | 0.57%(-0.360)#5,422 |
| 74. | Revere | 0.20% | 0.46%(-0.257)#74 | 0.57%(-0.361)#5,427 |
| 75. | Raynham Center | 0.20% | 0.46%(-0.264)#75 | 0.57%(-0.368)#5,482 |
| 76. | Gardner | 0.19% | 0.46%(-0.267)#76 | 0.57%(-0.371)#5,513 |
| 77. | Belmont | 0.19% | 0.46%(-0.272)#77 | 0.57%(-0.376)#5,551 |
| 78. | Braintree Town | 0.19% | 0.46%(-0.275)#78 | 0.57%(-0.380)#5,578 |
| 79. | Melrose | 0.17% | 0.46%(-0.288)#79 | 0.57%(-0.392)#5,699 |
| 80. | West Concord | 0.17% | 0.46%(-0.291)#80 | 0.57%(-0.395)#5,721 |
| 81. | Medford | 0.17% | 0.46%(-0.294)#81 | 0.57%(-0.399)#5,753 |
| 82. | Ipswich | 0.14% | 0.46%(-0.318)#82 | 0.57%(-0.422)#5,957 |
| 83. | Holyoke | 0.13% | 0.46%(-0.330)#83 | 0.57%(-0.435)#6,067 |
| 84. | Gloucester | 0.13% | 0.46%(-0.330)#84 | 0.57%(-0.435)#6,069 |
| 85. | Norwood | 0.12% | 0.46%(-0.337)#85 | 0.57%(-0.441)#6,135 |
| 86. | East Falmouth | 0.12% | 0.46%(-0.339)#86 | 0.57%(-0.443)#6,163 |
| 87. | Southbridge Town | 0.12% | 0.46%(-0.342)#87 | 0.57%(-0.447)#6,194 |
| 88. | North Adams | 0.11% | 0.46%(-0.353)#88 | 0.57%(-0.457)#6,302 |
| 89. | Northampton | 0.081% | 0.46%(-0.380)#89 | 0.57%(-0.484)#6,557 |
| 90. | Nantucket | 0.076% | 0.46%(-0.385)#90 | 0.57%(-0.489)#6,596 |
| 91. | Wakefield | 0.074% | 0.46%(-0.387)#91 | 0.57%(-0.491)#6,615 |
| 92. | Brookline | 0.073% | 0.46%(-0.388)#92 | 0.57%(-0.492)#6,625 |
| 93. | Hull | 0.069% | 0.46%(-0.392)#93 | 0.57%(-0.496)#6,666 |
| 94. | Marlborough | 0.068% | 0.46%(-0.394)#94 | 0.57%(-0.498)#6,679 |
| 95. | Mansfield Center | 0.065% | 0.46%(-0.396)#95 | 0.57%(-0.500)#6,697 |
| 96. | Andover | 0.064% | 0.46%(-0.398)#96 | 0.57%(-0.502)#6,705 |
| 97. | Westfield | 0.044% | 0.46%(-0.417)#97 | 0.57%(-0.521)#6,894 |
| 98. | Peabody | 0.024% | 0.46%(-0.437)#98 | 0.57%(-0.541)#7,088 |
| 99. | Franklin Town | 0.021% | 0.46%(-0.440)#99 | 0.57%(-0.544)#7,108 |
| 100. | Easthampton Town | 0.012% | 0.46%(-0.449)#100 | 0.57%(-0.553)#7,177 |
Common Questions
What are the Top 10 Cities with the Highest Percentage of African Population in Massachusetts?
Top 10 Cities with the Highest Percentage of African Population in Massachusetts are:
#1
2.68%
#2
2.14%
#3
2.08%
#4
1.92%
#5
1.80%
#6
1.78%
#7
1.64%
#8
1.53%
#9
1.51%
#10
1.43%
What city has the Highest Percentage of African Population in Massachusetts?
Randolph Town has the Highest Percentage of African Population in Massachusetts with 2.68%.
What is the Percentage of African Population in the State of Massachusetts?
Percentage of African Population in Massachusetts is 0.46%.
What is the Percentage of African Population in the United States?
Percentage of African Population in the United States is 0.57%.