Country Club, CA Map & Demographics
Country Club Map
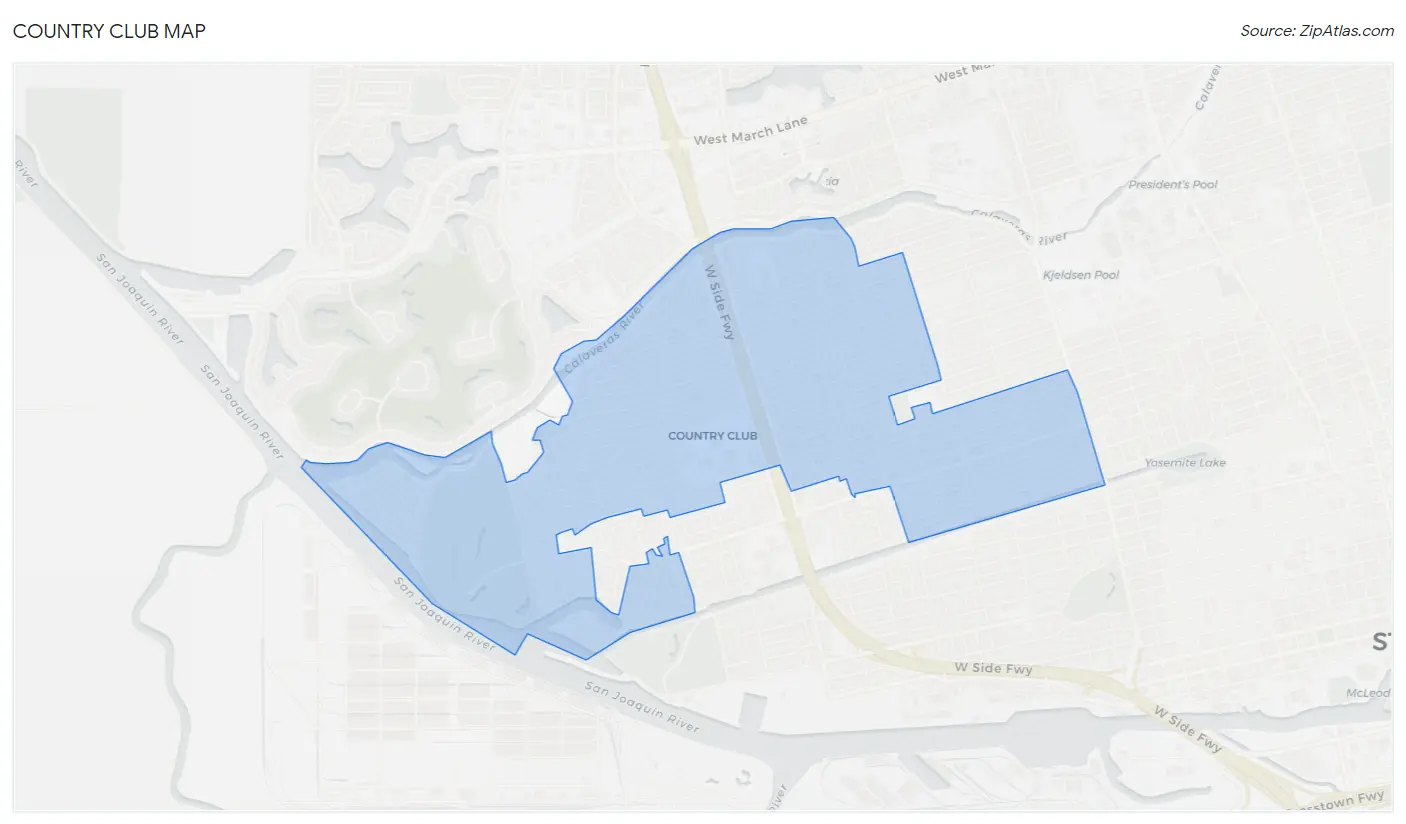
Country Club Overview
$32,480
PER CAPITA INCOME
$80,735
AVG FAMILY INCOME
$76,758
AVG HOUSEHOLD INCOME
26.3%
WAGE / INCOME GAP [ % ]
73.7¢/ $1
WAGE / INCOME GAP [ $ ]
0.42
INEQUALITY / GINI INDEX
9,686
TOTAL POPULATION
4,636
MALE POPULATION
5,050
FEMALE POPULATION
91.80
MALES / 100 FEMALES
108.93
FEMALES / 100 MALES
36.2
MEDIAN AGE
3.4
AVG FAMILY SIZE
2.9
AVG HOUSEHOLD SIZE
4,602
LABOR FORCE [ PEOPLE ]
58.8%
PERCENT IN LABOR FORCE
8.1%
UNEMPLOYMENT RATE
Income in Country Club
Income Overview in Country Club
Per Capita Income in Country Club is $32,480, while median incomes of families and households are $80,735 and $76,758 respectively.
| Characteristic | Number | Measure |
| Per Capita Income | 9,686 | $32,480 |
| Median Family Income | 2,350 | $80,735 |
| Mean Family Income | 2,350 | $100,002 |
| Median Household Income | 3,333 | $76,758 |
| Mean Household Income | 3,333 | $91,944 |
| Income Deficit | 2,350 | $0 |
| Wage / Income Gap (%) | 9,686 | 26.34% |
| Wage / Income Gap ($) | 9,686 | 73.66¢ per $1 |
| Gini / Inequality Index | 9,686 | 0.42 |
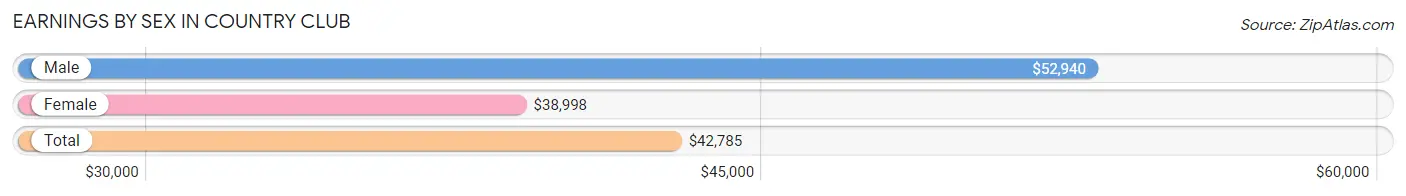
Earnings by Sex in Country Club
Average Earnings in Country Club are $42,785, $52,940 for men and $38,998 for women, a difference of 26.3%.
| Sex | Number | Average Earnings |
| Male | 2,448 (51.9%) | $52,940 |
| Female | 2,269 (48.1%) | $38,998 |
| Total | 4,717 (100.0%) | $42,785 |
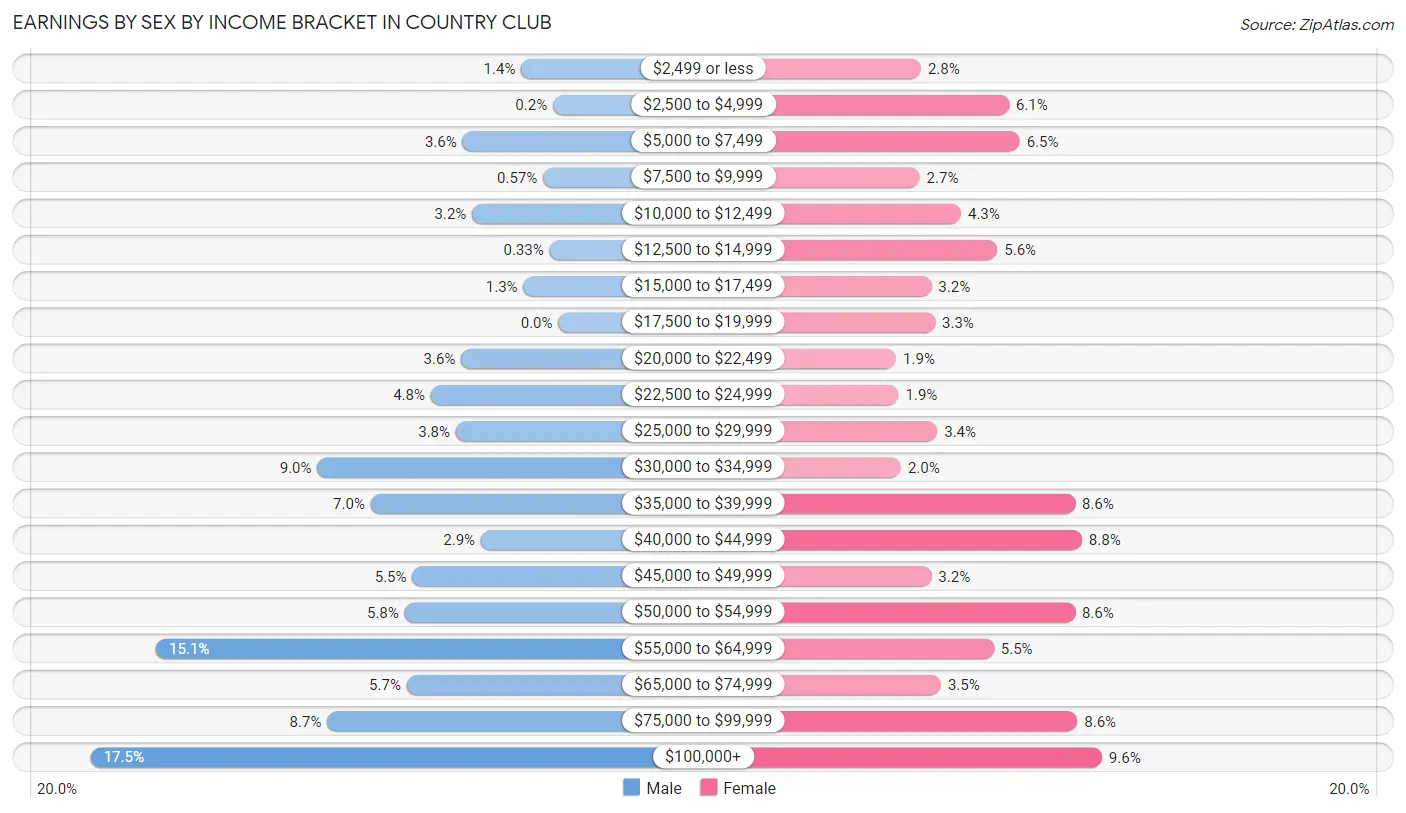
Earnings by Sex by Income Bracket in Country Club
The most common earnings brackets in Country Club are $100,000+ for men (429 | 17.5%) and $100,000+ for women (217 | 9.6%).
| Income | Male | Female |
| $2,499 or less | 34 (1.4%) | 63 (2.8%) |
| $2,500 to $4,999 | 5 (0.2%) | 138 (6.1%) |
| $5,000 to $7,499 | 88 (3.6%) | 147 (6.5%) |
| $7,500 to $9,999 | 14 (0.6%) | 62 (2.7%) |
| $10,000 to $12,499 | 79 (3.2%) | 97 (4.3%) |
| $12,500 to $14,999 | 8 (0.3%) | 128 (5.6%) |
| $15,000 to $17,499 | 32 (1.3%) | 72 (3.2%) |
| $17,500 to $19,999 | 0 (0.0%) | 75 (3.3%) |
| $20,000 to $22,499 | 89 (3.6%) | 42 (1.8%) |
| $22,500 to $24,999 | 117 (4.8%) | 44 (1.9%) |
| $25,000 to $29,999 | 94 (3.8%) | 77 (3.4%) |
| $30,000 to $34,999 | 221 (9.0%) | 46 (2.0%) |
| $35,000 to $39,999 | 172 (7.0%) | 194 (8.6%) |
| $40,000 to $44,999 | 71 (2.9%) | 200 (8.8%) |
| $45,000 to $49,999 | 134 (5.5%) | 72 (3.2%) |
| $50,000 to $54,999 | 141 (5.8%) | 194 (8.6%) |
| $55,000 to $64,999 | 369 (15.1%) | 125 (5.5%) |
| $65,000 to $74,999 | 139 (5.7%) | 80 (3.5%) |
| $75,000 to $99,999 | 212 (8.7%) | 196 (8.6%) |
| $100,000+ | 429 (17.5%) | 217 (9.6%) |
| Total | 2,448 (100.0%) | 2,269 (100.0%) |
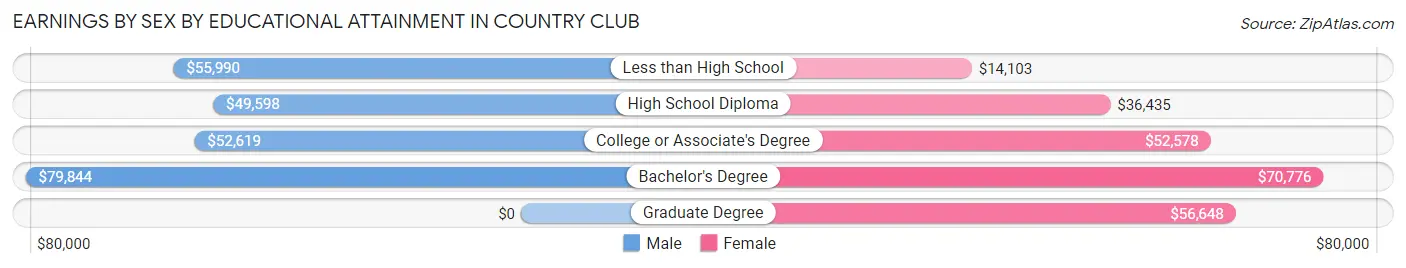
Earnings by Sex by Educational Attainment in Country Club
Average earnings in Country Club are $54,863 for men and $41,469 for women, a difference of 24.4%. Men with an educational attainment of bachelor's degree enjoy the highest average annual earnings of $79,844, while those with high school diploma education earn the least with $49,598. Women with an educational attainment of bachelor's degree earn the most with the average annual earnings of $70,776, while those with less than high school education have the smallest earnings of $14,103.
| Educational Attainment | Male Income | Female Income |
| Less than High School | $55,990 | $14,103 |
| High School Diploma | $49,598 | $36,435 |
| College or Associate's Degree | $52,619 | $52,578 |
| Bachelor's Degree | $79,844 | $70,776 |
| Graduate Degree | - | - |
| Total | $54,863 | $41,469 |
Family Income in Country Club
Family Income Brackets in Country Club
According to the Country Club family income data, there are 548 families falling into the $100,000 to $149,999 income range, which is the most common income bracket and makes up 23.3% of all families. Conversely, the $10,000 to $14,999 income bracket is the least frequent group with only 21 families (0.9%) belonging to this category.
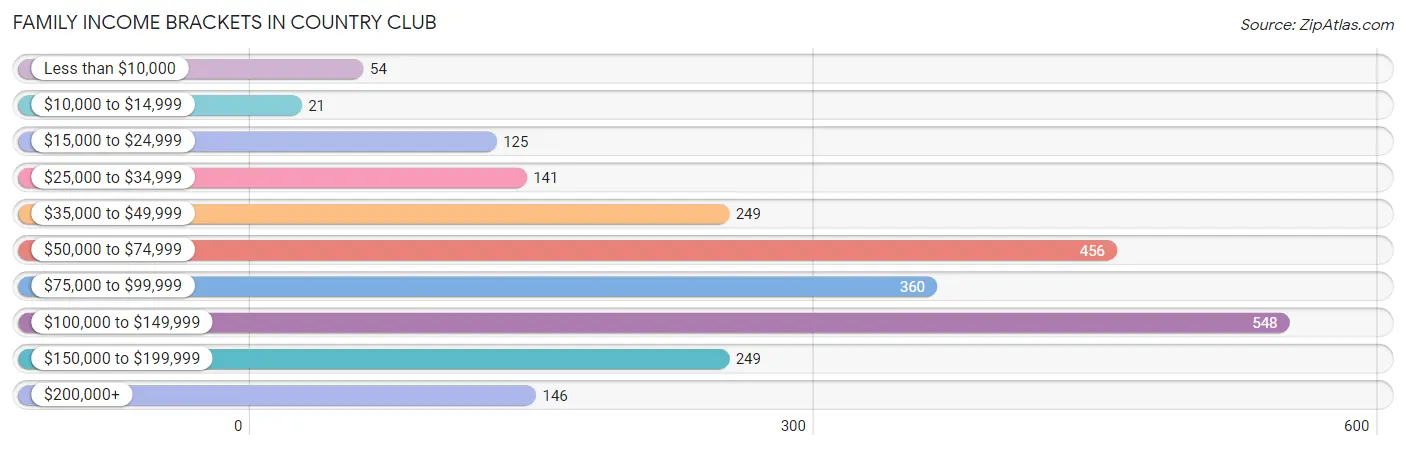
| Income Bracket | # Families | % Families |
| Less than $10,000 | 54 | 2.3% |
| $10,000 to $14,999 | 21 | 0.9% |
| $15,000 to $24,999 | 125 | 5.3% |
| $25,000 to $34,999 | 141 | 6.0% |
| $35,000 to $49,999 | 249 | 10.6% |
| $50,000 to $74,999 | 456 | 19.4% |
| $75,000 to $99,999 | 360 | 15.3% |
| $100,000 to $149,999 | 548 | 23.3% |
| $150,000 to $199,999 | 249 | 10.6% |
| $200,000+ | 146 | 6.2% |
Family Income by Famaliy Size in Country Club
6-person families (118 | 5.0%) account for the highest median family income in Country Club with $162,951 per family, while 2-person families (1,002 | 42.6%) have the highest median income of $32,353 per family member.
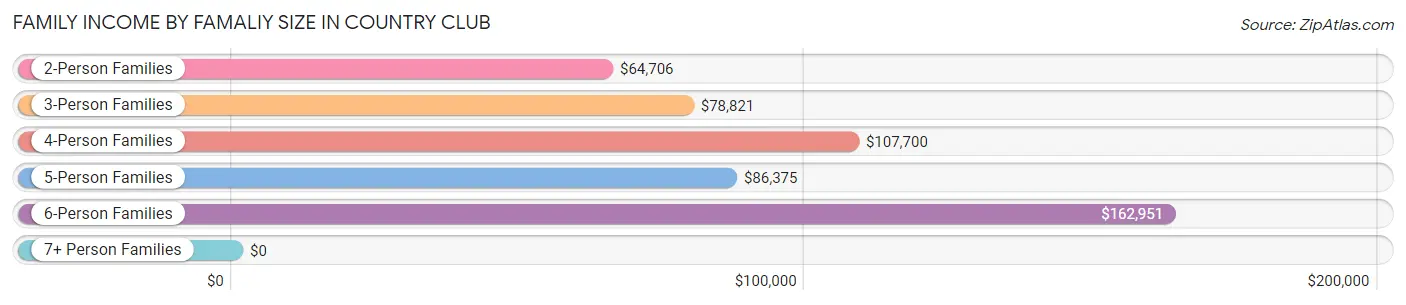
| Income Bracket | # Families | Median Income |
| 2-Person Families | 1,002 (42.6%) | $64,706 |
| 3-Person Families | 441 (18.8%) | $78,821 |
| 4-Person Families | 580 (24.7%) | $107,700 |
| 5-Person Families | 185 (7.9%) | $86,375 |
| 6-Person Families | 118 (5.0%) | $162,951 |
| 7+ Person Families | 24 (1.0%) | $0 |
| Total | 2,350 (100.0%) | $80,735 |
Family Income by Number of Earners in Country Club
The median family income in Country Club is $80,735, with families comprising 3+ earners (309) having the highest median family income of $148,281, while families with no earners (309) have the lowest median family income of $41,960, accounting for 13.2% and 13.2% of families, respectively.

| Number of Earners | # Families | Median Income |
| No Earners | 309 (13.2%) | $41,960 |
| 1 Earner | 860 (36.6%) | $59,939 |
| 2 Earners | 872 (37.1%) | $107,921 |
| 3+ Earners | 309 (13.2%) | $148,281 |
| Total | 2,350 (100.0%) | $80,735 |
Household Income in Country Club
Household Income Brackets in Country Club
With 750 households falling in the category, the $100,000 to $149,999 income range is the most frequent in Country Club, accounting for 22.5% of all households. In contrast, only 47 households (1.4%) fall into the $10,000 to $14,999 income bracket, making it the least populous group.
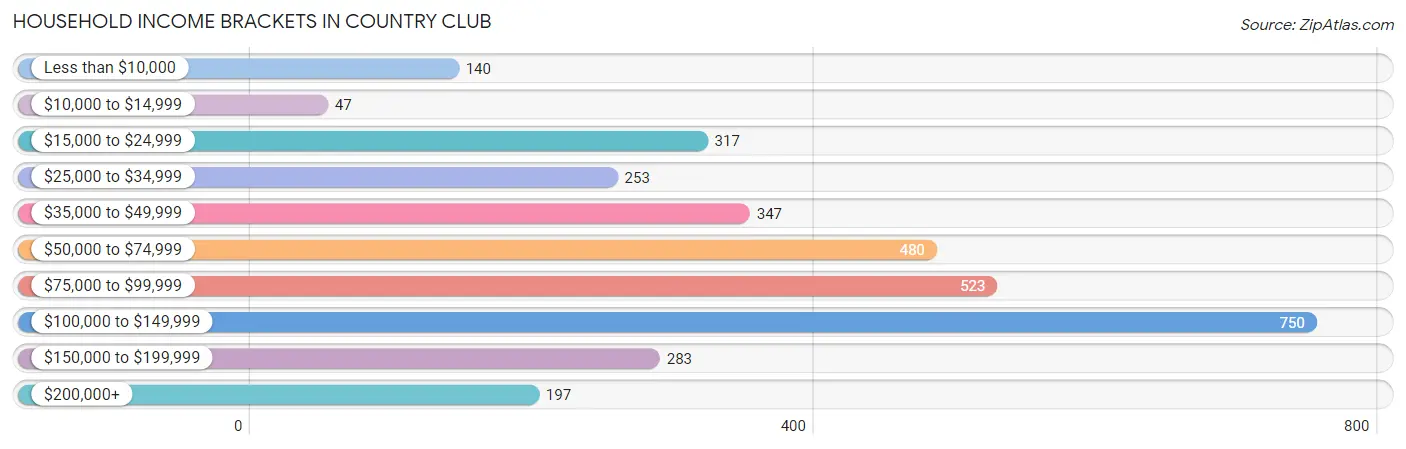
| Income Bracket | # Households | % Households |
| Less than $10,000 | 140 | 4.2% |
| $10,000 to $14,999 | 47 | 1.4% |
| $15,000 to $24,999 | 317 | 9.5% |
| $25,000 to $34,999 | 253 | 7.6% |
| $35,000 to $49,999 | 347 | 10.4% |
| $50,000 to $74,999 | 480 | 14.4% |
| $75,000 to $99,999 | 523 | 15.7% |
| $100,000 to $149,999 | 750 | 22.5% |
| $150,000 to $199,999 | 283 | 8.5% |
| $200,000+ | 197 | 5.9% |
Household Income by Householder Age in Country Club
The median household income in Country Club is $76,758, with the highest median household income of $90,096 found in the 45 to 64 years age bracket for the primary householder. A total of 1,179 households (35.4%) fall into this category. Meanwhile, the 15 to 24 years age bracket for the primary householder has the lowest median household income of $0, with 25 households (0.7%) in this group.
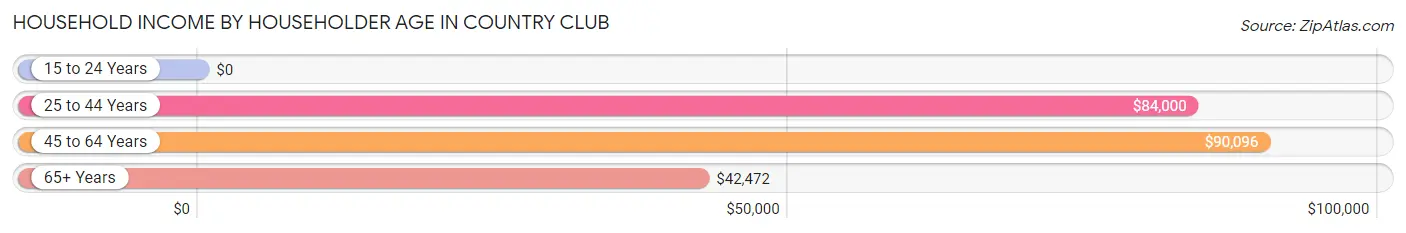
| Income Bracket | # Households | Median Income |
| 15 to 24 Years | 25 (0.7%) | $0 |
| 25 to 44 Years | 1,310 (39.3%) | $84,000 |
| 45 to 64 Years | 1,179 (35.4%) | $90,096 |
| 65+ Years | 819 (24.6%) | $42,472 |
| Total | 3,333 (100.0%) | $76,758 |
Poverty in Country Club
Income Below Poverty by Sex and Age in Country Club
With 14.2% poverty level for males and 13.4% for females among the residents of Country Club, 6 to 11 year old males and 6 to 11 year old females are the most vulnerable to poverty, with 125 males (28.0%) and 60 females (27.9%) in their respective age groups living below the poverty level.
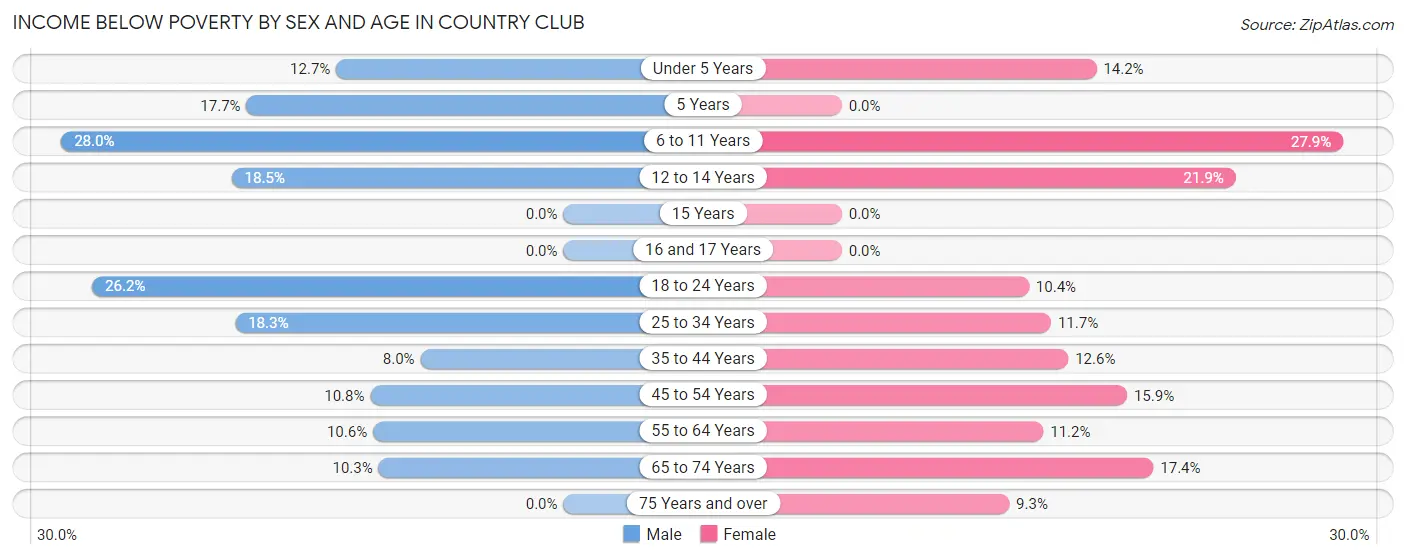
| Age Bracket | Male | Female |
| Under 5 Years | 31 (12.7%) | 38 (14.2%) |
| 5 Years | 3 (17.6%) | 0 (0.0%) |
| 6 to 11 Years | 125 (28.0%) | 60 (27.9%) |
| 12 to 14 Years | 41 (18.5%) | 41 (21.9%) |
| 15 Years | 0 (0.0%) | 0 (0.0%) |
| 16 and 17 Years | 0 (0.0%) | 0 (0.0%) |
| 18 to 24 Years | 74 (26.2%) | 59 (10.4%) |
| 25 to 34 Years | 154 (18.3%) | 116 (11.7%) |
| 35 to 44 Years | 54 (8.0%) | 72 (12.6%) |
| 45 to 54 Years | 66 (10.7%) | 107 (15.9%) |
| 55 to 64 Years | 55 (10.6%) | 69 (11.2%) |
| 65 to 74 Years | 46 (10.3%) | 76 (17.3%) |
| 75 Years and over | 0 (0.0%) | 33 (9.3%) |
| Total | 649 (14.2%) | 671 (13.4%) |
Income Above Poverty by Sex and Age in Country Club
According to the poverty statistics in Country Club, males aged 15 years and females aged 5 years are the age groups that are most secure financially, with 100.0% of males and 100.0% of females in these age groups living above the poverty line.
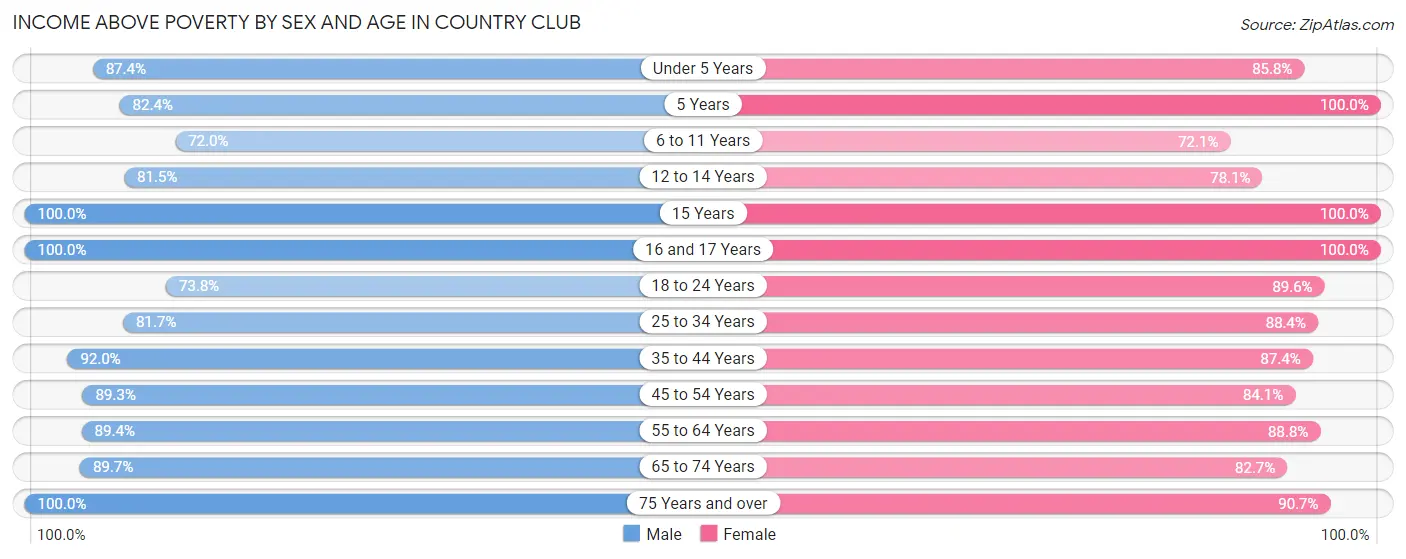
| Age Bracket | Male | Female |
| Under 5 Years | 214 (87.4%) | 230 (85.8%) |
| 5 Years | 14 (82.4%) | 22 (100.0%) |
| 6 to 11 Years | 322 (72.0%) | 155 (72.1%) |
| 12 to 14 Years | 181 (81.5%) | 146 (78.1%) |
| 15 Years | 77 (100.0%) | 32 (100.0%) |
| 16 and 17 Years | 65 (100.0%) | 58 (100.0%) |
| 18 to 24 Years | 208 (73.8%) | 507 (89.6%) |
| 25 to 34 Years | 689 (81.7%) | 880 (88.3%) |
| 35 to 44 Years | 624 (92.0%) | 499 (87.4%) |
| 45 to 54 Years | 548 (89.2%) | 567 (84.1%) |
| 55 to 64 Years | 464 (89.4%) | 546 (88.8%) |
| 65 to 74 Years | 401 (89.7%) | 362 (82.7%) |
| 75 Years and over | 105 (100.0%) | 321 (90.7%) |
| Total | 3,912 (85.8%) | 4,325 (86.6%) |
Income Below Poverty Among Married-Couple Families in Country Club
The poverty statistics for married-couple families in Country Club show that 7.2% or 128 of the total 1,777 families live below the poverty line. Families with 3 or 4 children have the highest poverty rate of 17.4%, comprising of 20 families. On the other hand, families with no children have the lowest poverty rate of 2.5%, which includes 24 families.
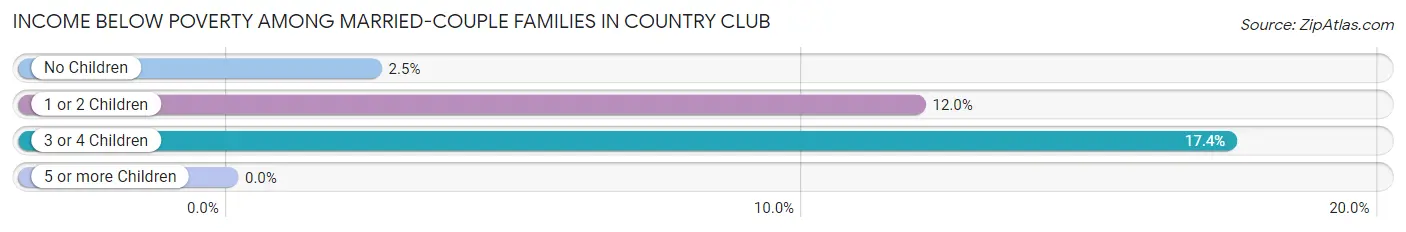
| Children | Above Poverty | Below Poverty |
| No Children | 936 (97.5%) | 24 (2.5%) |
| 1 or 2 Children | 618 (88.0%) | 84 (12.0%) |
| 3 or 4 Children | 95 (82.6%) | 20 (17.4%) |
| 5 or more Children | 0 (0.0%) | 0 (0.0%) |
| Total | 1,649 (92.8%) | 128 (7.2%) |
Income Below Poverty Among Single-Parent Households in Country Club
According to the poverty data in Country Club, 3.3% or 7 single-father households and 24.3% or 88 single-mother households are living below the poverty line. Among single-father households, those with 1 or 2 children have the highest poverty rate, with 7 households (17.9%) experiencing poverty. Likewise, among single-mother households, those with 1 or 2 children have the highest poverty rate, with 62 households (48.4%) falling below the poverty line.
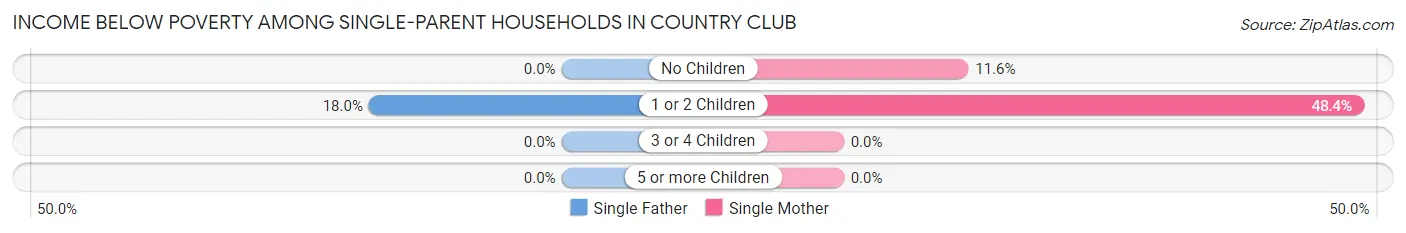
| Children | Single Father | Single Mother |
| No Children | 0 (0.0%) | 26 (11.6%) |
| 1 or 2 Children | 7 (17.9%) | 62 (48.4%) |
| 3 or 4 Children | 0 (0.0%) | 0 (0.0%) |
| 5 or more Children | 0 (0.0%) | 0 (0.0%) |
| Total | 7 (3.3%) | 88 (24.3%) |
Income Below Poverty Among Married-Couple vs Single-Parent Households in Country Club
The poverty data for Country Club shows that 128 of the married-couple family households (7.2%) and 95 of the single-parent households (16.6%) are living below the poverty level. Within the married-couple family households, those with 3 or 4 children have the highest poverty rate, with 20 households (17.4%) falling below the poverty line. Among the single-parent households, those with 1 or 2 children have the highest poverty rate, with 69 household (41.3%) living below poverty.
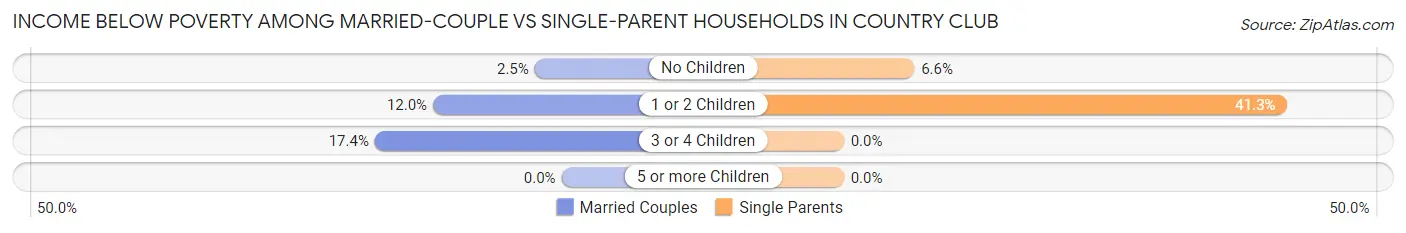
| Children | Married-Couple Families | Single-Parent Households |
| No Children | 24 (2.5%) | 26 (6.6%) |
| 1 or 2 Children | 84 (12.0%) | 69 (41.3%) |
| 3 or 4 Children | 20 (17.4%) | 0 (0.0%) |
| 5 or more Children | 0 (0.0%) | 0 (0.0%) |
| Total | 128 (7.2%) | 95 (16.6%) |
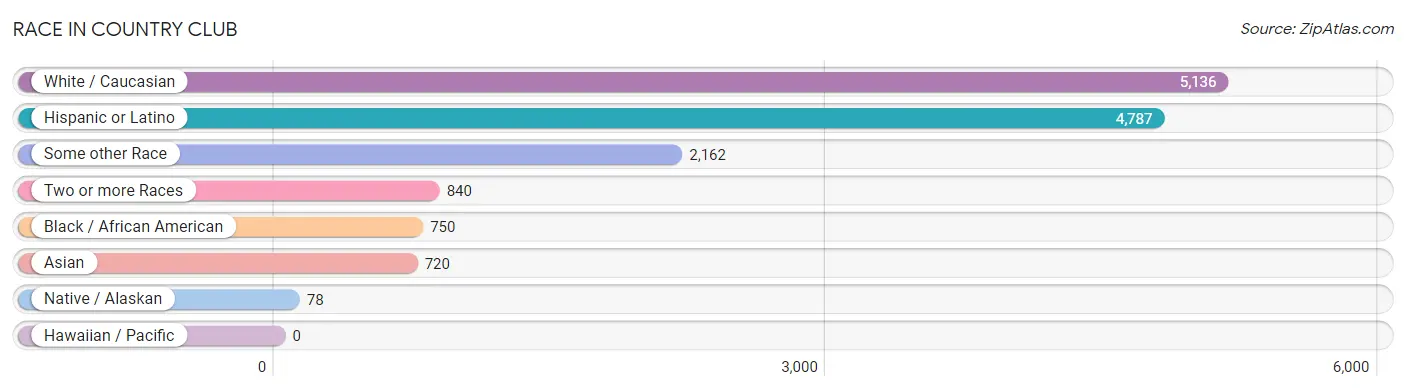
Race in Country Club
The most populous races in Country Club are White / Caucasian (5,136 | 53.0%), Hispanic or Latino (4,787 | 49.4%), and Some other Race (2,162 | 22.3%).
| Race | # Population | % Population |
| Asian | 720 | 7.4% |
| Black / African American | 750 | 7.7% |
| Hawaiian / Pacific | 0 | 0.0% |
| Hispanic or Latino | 4,787 | 49.4% |
| Native / Alaskan | 78 | 0.8% |
| White / Caucasian | 5,136 | 53.0% |
| Two or more Races | 840 | 8.7% |
| Some other Race | 2,162 | 22.3% |
| Total | 9,686 | 100.0% |
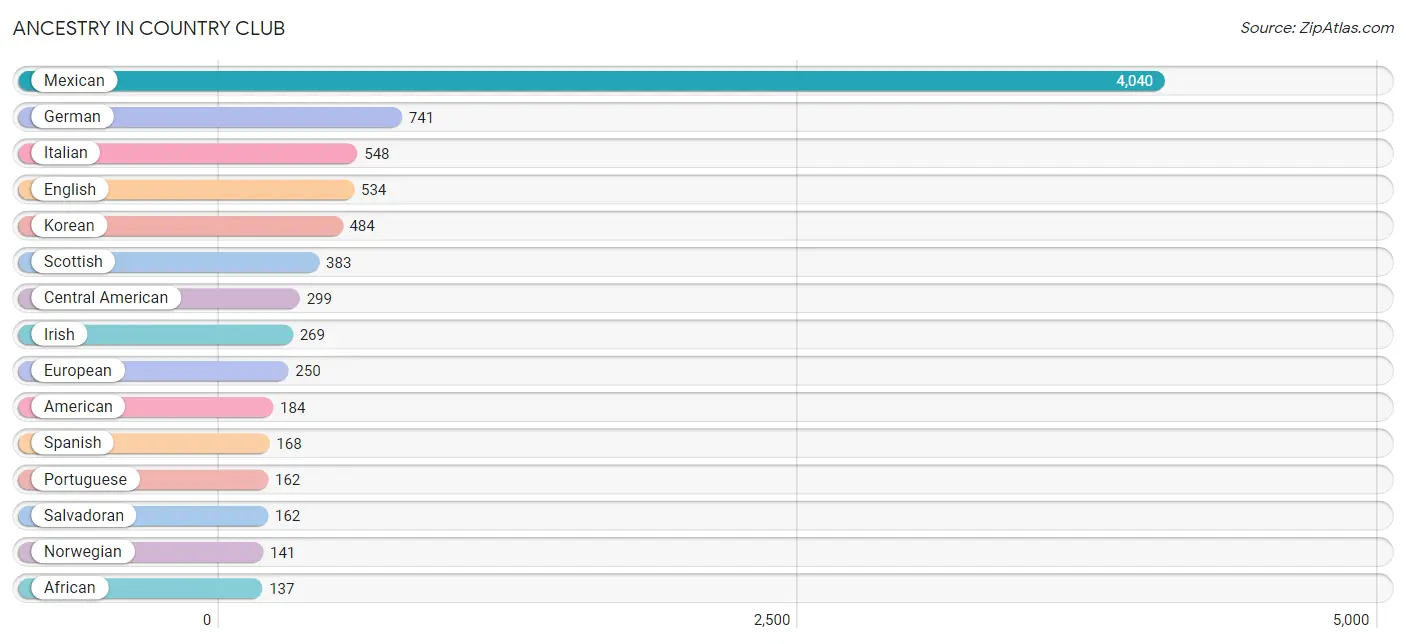
Ancestry in Country Club
The most populous ancestries reported in Country Club are Mexican (4,040 | 41.7%), German (741 | 7.6%), Italian (548 | 5.7%), English (534 | 5.5%), and Korean (484 | 5.0%), together accounting for 65.5% of all Country Club residents.
| Ancestry | # Population | % Population |
| African | 137 | 1.4% |
| American | 184 | 1.9% |
| Apache | 39 | 0.4% |
| Austrian | 22 | 0.2% |
| Bhutanese | 112 | 1.2% |
| Brazilian | 7 | 0.1% |
| British | 19 | 0.2% |
| Burmese | 30 | 0.3% |
| Central American | 299 | 3.1% |
| Cherokee | 10 | 0.1% |
| Chickasaw | 8 | 0.1% |
| Choctaw | 7 | 0.1% |
| Colombian | 7 | 0.1% |
| Cuban | 10 | 0.1% |
| Dutch | 30 | 0.3% |
| Ecuadorian | 9 | 0.1% |
| English | 534 | 5.5% |
| European | 250 | 2.6% |
| French | 67 | 0.7% |
| German | 741 | 7.6% |
| Greek | 25 | 0.3% |
| Guamanian / Chamorro | 23 | 0.2% |
| Indian (Asian) | 81 | 0.8% |
| Irish | 269 | 2.8% |
| Italian | 548 | 5.7% |
| Korean | 484 | 5.0% |
| Mexican | 4,040 | 41.7% |
| Mexican American Indian | 59 | 0.6% |
| Native Hawaiian | 10 | 0.1% |
| Nicaraguan | 137 | 1.4% |
| Norwegian | 141 | 1.5% |
| Pakistani | 6 | 0.1% |
| Polish | 68 | 0.7% |
| Portuguese | 162 | 1.7% |
| Puerto Rican | 17 | 0.2% |
| Salvadoran | 162 | 1.7% |
| Scandinavian | 11 | 0.1% |
| Scotch-Irish | 65 | 0.7% |
| Scottish | 383 | 4.0% |
| South American | 16 | 0.2% |
| Spaniard | 43 | 0.4% |
| Spanish | 168 | 1.7% |
| Sri Lankan | 67 | 0.7% |
| Subsaharan African | 137 | 1.4% |
| Swedish | 93 | 1.0% |
| Swiss | 34 | 0.4% |
| Thai | 49 | 0.5% |
| Welsh | 13 | 0.1% |
| West Indian | 17 | 0.2% |
| Yaqui | 9 | 0.1% | View All 50 Rows |
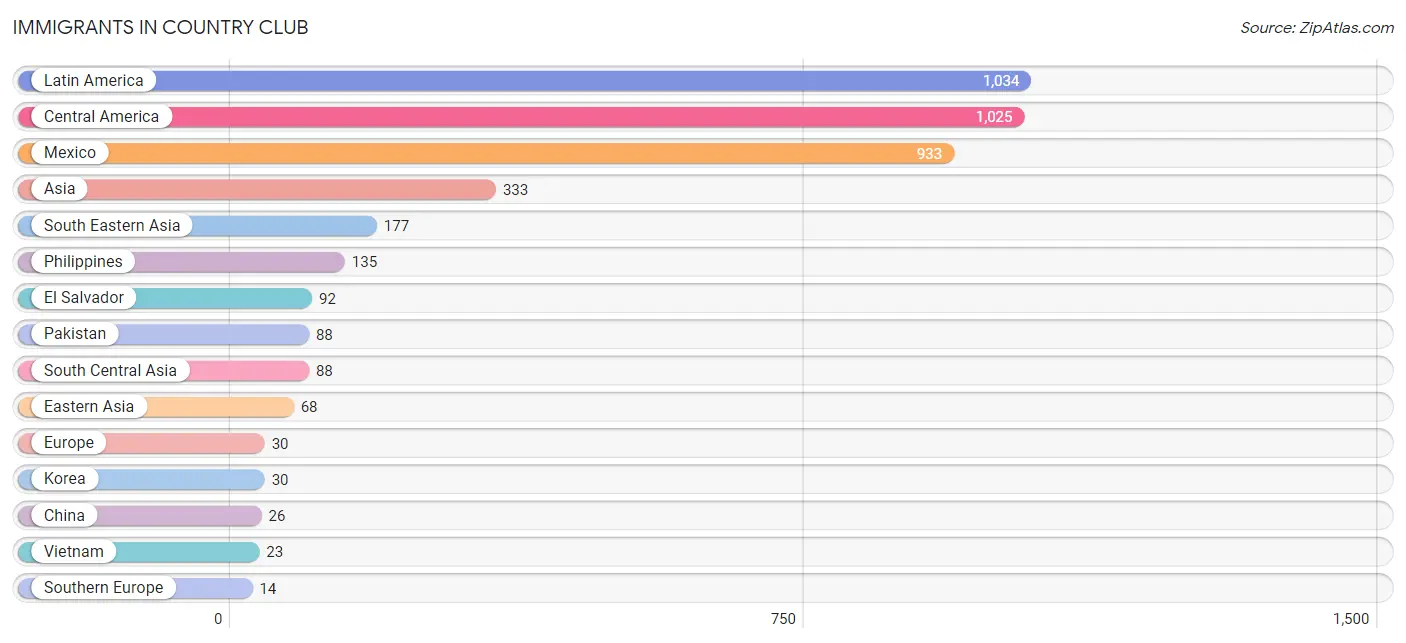
Immigrants in Country Club
The most numerous immigrant groups reported in Country Club came from Latin America (1,034 | 10.7%), Central America (1,025 | 10.6%), Mexico (933 | 9.6%), Asia (333 | 3.4%), and South Eastern Asia (177 | 1.8%), together accounting for 36.2% of all Country Club residents.
| Immigration Origin | # Population | % Population |
| Asia | 333 | 3.4% |
| Australia | 1 | 0.0% |
| Central America | 1,025 | 10.6% |
| China | 26 | 0.3% |
| Eastern Asia | 68 | 0.7% |
| Ecuador | 9 | 0.1% |
| El Salvador | 92 | 0.9% |
| England | 7 | 0.1% |
| Europe | 30 | 0.3% |
| France | 9 | 0.1% |
| Italy | 7 | 0.1% |
| Japan | 12 | 0.1% |
| Korea | 30 | 0.3% |
| Latin America | 1,034 | 10.7% |
| Mexico | 933 | 9.6% |
| Northern Europe | 7 | 0.1% |
| Oceania | 1 | 0.0% |
| Pakistan | 88 | 0.9% |
| Philippines | 135 | 1.4% |
| South America | 9 | 0.1% |
| South Central Asia | 88 | 0.9% |
| South Eastern Asia | 177 | 1.8% |
| Southern Europe | 14 | 0.1% |
| Spain | 7 | 0.1% |
| Thailand | 6 | 0.1% |
| Vietnam | 23 | 0.2% |
| Western Europe | 9 | 0.1% | View All 27 Rows |
Sex and Age in Country Club
Sex and Age in Country Club
The most populous age groups in Country Club are 30 to 34 Years (526 | 11.4%) for men and 30 to 34 Years (720 | 14.3%) for women.
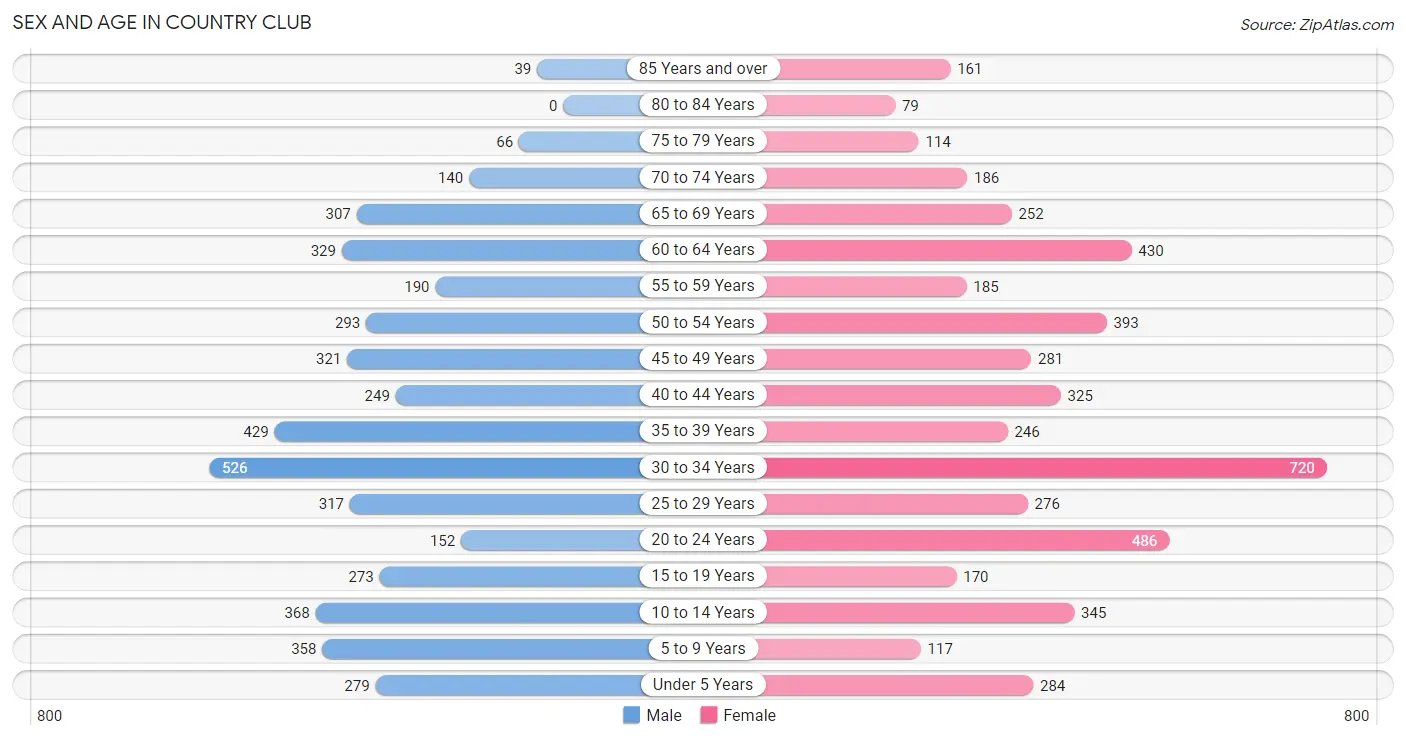
| Age Bracket | Male | Female |
| Under 5 Years | 279 (6.0%) | 284 (5.6%) |
| 5 to 9 Years | 358 (7.7%) | 117 (2.3%) |
| 10 to 14 Years | 368 (7.9%) | 345 (6.8%) |
| 15 to 19 Years | 273 (5.9%) | 170 (3.4%) |
| 20 to 24 Years | 152 (3.3%) | 486 (9.6%) |
| 25 to 29 Years | 317 (6.8%) | 276 (5.5%) |
| 30 to 34 Years | 526 (11.4%) | 720 (14.3%) |
| 35 to 39 Years | 429 (9.2%) | 246 (4.9%) |
| 40 to 44 Years | 249 (5.4%) | 325 (6.4%) |
| 45 to 49 Years | 321 (6.9%) | 281 (5.6%) |
| 50 to 54 Years | 293 (6.3%) | 393 (7.8%) |
| 55 to 59 Years | 190 (4.1%) | 185 (3.7%) |
| 60 to 64 Years | 329 (7.1%) | 430 (8.5%) |
| 65 to 69 Years | 307 (6.6%) | 252 (5.0%) |
| 70 to 74 Years | 140 (3.0%) | 186 (3.7%) |
| 75 to 79 Years | 66 (1.4%) | 114 (2.3%) |
| 80 to 84 Years | 0 (0.0%) | 79 (1.6%) |
| 85 Years and over | 39 (0.8%) | 161 (3.2%) |
| Total | 4,636 (100.0%) | 5,050 (100.0%) |
Families and Households in Country Club
Median Family Size in Country Club
The median family size in Country Club is 3.36 persons per family, with married-couple families (1,777 | 75.6%) accounting for the largest median family size of 3.58 persons per family. On the other hand, single female/mother families (362 | 15.4%) represent the smallest median family size with 2.59 persons per family.
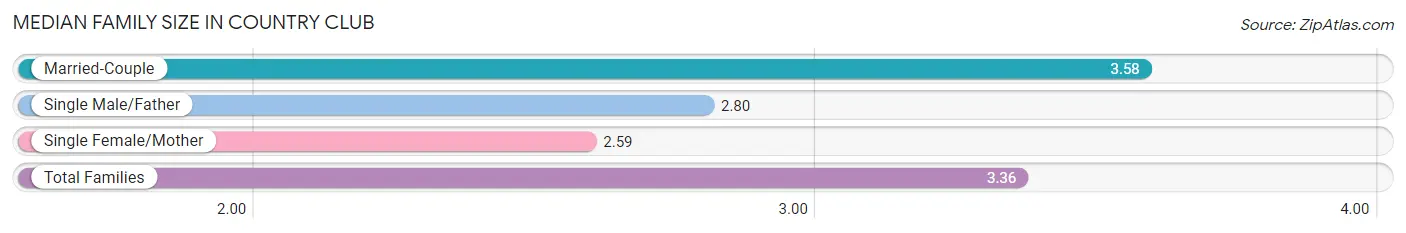
| Family Type | # Families | Family Size |
| Married-Couple | 1,777 (75.6%) | 3.58 |
| Single Male/Father | 211 (9.0%) | 2.80 |
| Single Female/Mother | 362 (15.4%) | 2.59 |
| Total Families | 2,350 (100.0%) | 3.36 |
Median Household Size in Country Club
The median household size in Country Club is 2.90 persons per household, with married-couple households (1,777 | 53.3%) accounting for the largest median household size of 3.74 persons per household. non-family households (983 | 29.5%) represent the smallest median household size with 1.37 persons per household.
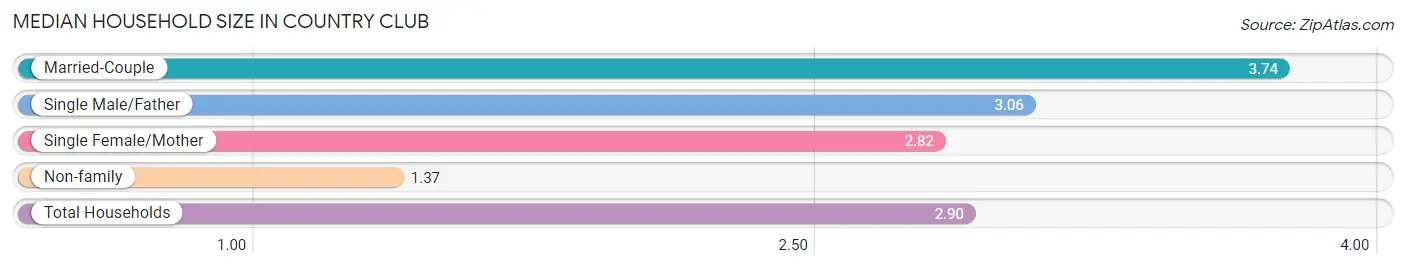
| Household Type | # Households | Household Size |
| Married-Couple | 1,777 (53.3%) | 3.74 |
| Single Male/Father | 211 (6.3%) | 3.06 |
| Single Female/Mother | 362 (10.9%) | 2.82 |
| Non-family | 983 (29.5%) | 1.37 |
| Total Households | 3,333 (100.0%) | 2.90 |
Household Size by Marriage Status in Country Club
Out of a total of 3,333 households in Country Club, 2,350 (70.5%) are family households, while 983 (29.5%) are nonfamily households. The most numerous type of family households are 2-person households, comprising 878, and the most common type of nonfamily households are 1-person households, comprising 855.
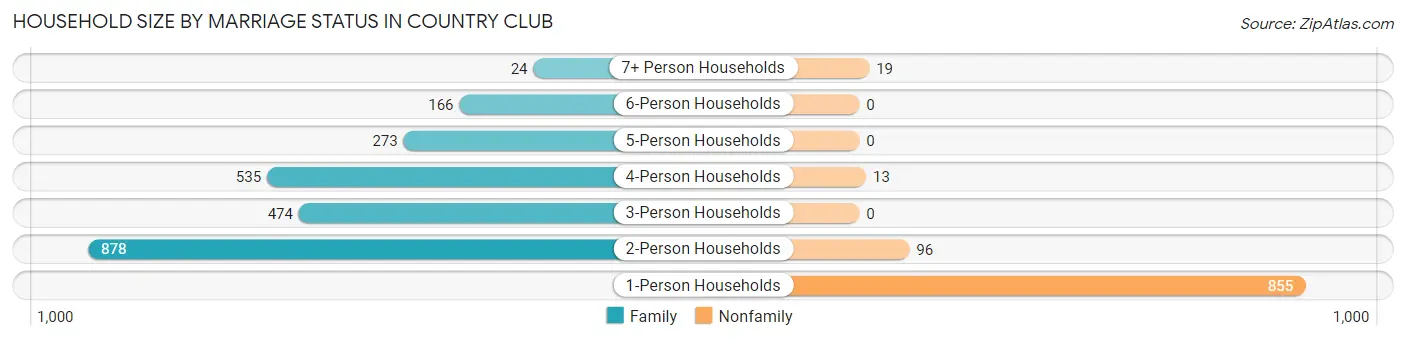
| Household Size | Family Households | Nonfamily Households |
| 1-Person Households | - | 855 (25.7%) |
| 2-Person Households | 878 (26.3%) | 96 (2.9%) |
| 3-Person Households | 474 (14.2%) | 0 (0.0%) |
| 4-Person Households | 535 (16.1%) | 13 (0.4%) |
| 5-Person Households | 273 (8.2%) | 0 (0.0%) |
| 6-Person Households | 166 (5.0%) | 0 (0.0%) |
| 7+ Person Households | 24 (0.7%) | 19 (0.6%) |
| Total | 2,350 (70.5%) | 983 (29.5%) |
Female Fertility in Country Club
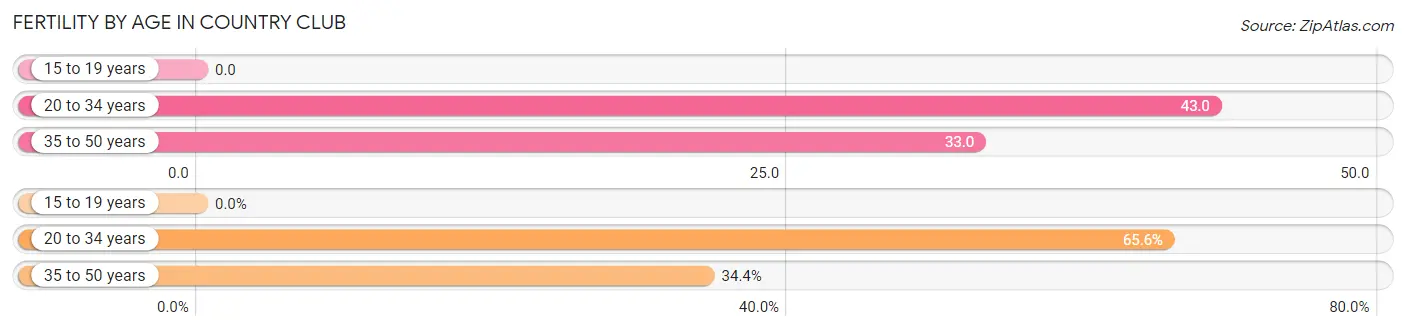
Fertility by Age in Country Club
Average fertility rate in Country Club is 36.0 births per 1,000 women. Women in the age bracket of 20 to 34 years have the highest fertility rate with 43.0 births per 1,000 women. Women in the age bracket of 20 to 34 years acount for 65.6% of all women with births.
| Age Bracket | Women with Births | Births / 1,000 Women |
| 15 to 19 years | 0 (0.0%) | 0.0 |
| 20 to 34 years | 63 (65.6%) | 43.0 |
| 35 to 50 years | 33 (34.4%) | 33.0 |
| Total | 96 (100.0%) | 36.0 |
Fertility by Age by Marriage Status in Country Club
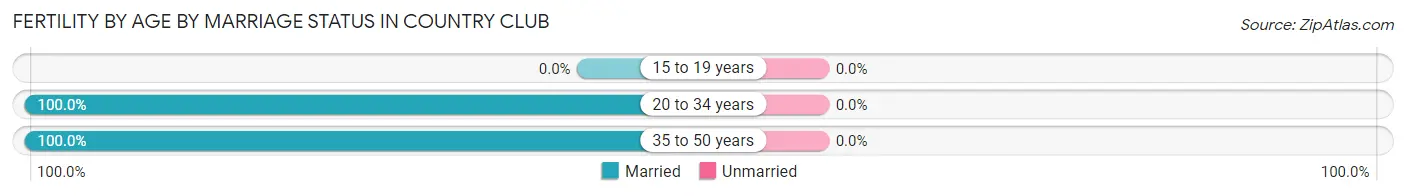
| Age Bracket | Married | Unmarried |
| 15 to 19 years | 0 (0.0%) | 0 (0.0%) |
| 20 to 34 years | 63 (100.0%) | 0 (0.0%) |
| 35 to 50 years | 33 (100.0%) | 0 (0.0%) |
| Total | 96 (100.0%) | 0 (0.0%) |
Fertility by Education in Country Club
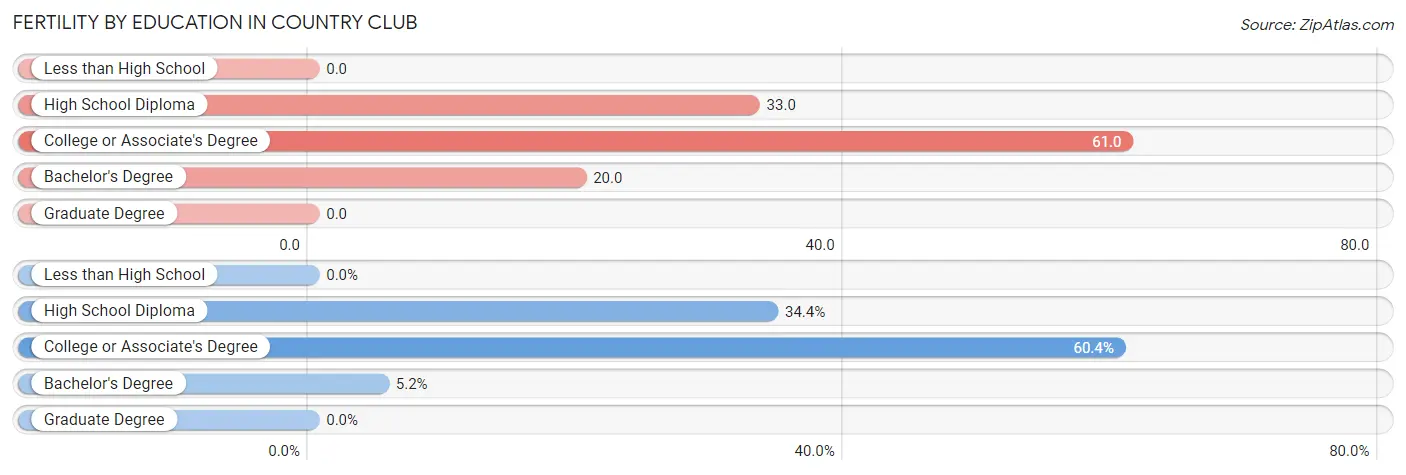
| Educational Attainment | Women with Births | Births / 1,000 Women |
| Less than High School | 0 (0.0%) | 0.0 |
| High School Diploma | 33 (34.4%) | 33.0 |
| College or Associate's Degree | 58 (60.4%) | 61.0 |
| Bachelor's Degree | 5 (5.2%) | 20.0 |
| Graduate Degree | 0 (0.0%) | 0.0 |
| Total | 96 (100.0%) | 36.0 |
Fertility by Education by Marriage Status in Country Club
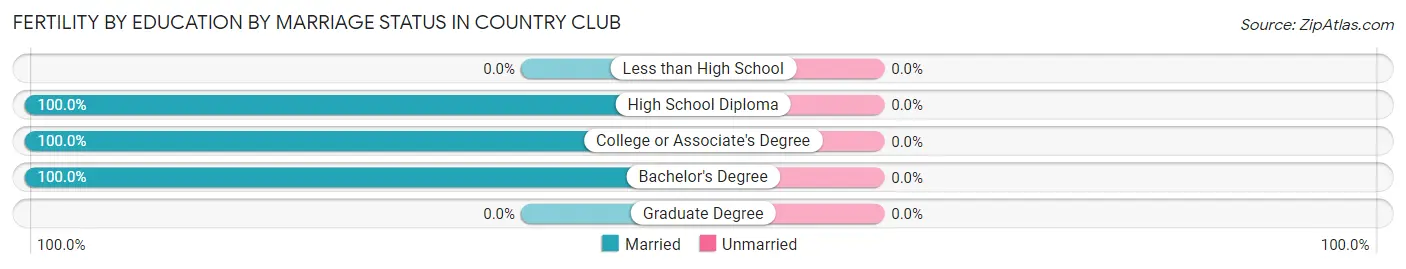
| Educational Attainment | Married | Unmarried |
| Less than High School | 0 (0.0%) | 0 (0.0%) |
| High School Diploma | 33 (100.0%) | 0 (0.0%) |
| College or Associate's Degree | 58 (100.0%) | 0 (0.0%) |
| Bachelor's Degree | 5 (100.0%) | 0 (0.0%) |
| Graduate Degree | 0 (0.0%) | 0 (0.0%) |
| Total | 96 (100.0%) | 0 (0.0%) |
Employment Characteristics in Country Club
Employment by Class of Employer in Country Club
Among the 4,172 employed individuals in Country Club, private company employees (2,903 | 69.6%), local government employees (448 | 10.7%), and self-employed (not incorporated) (240 | 5.8%) make up the most common classes of employment.
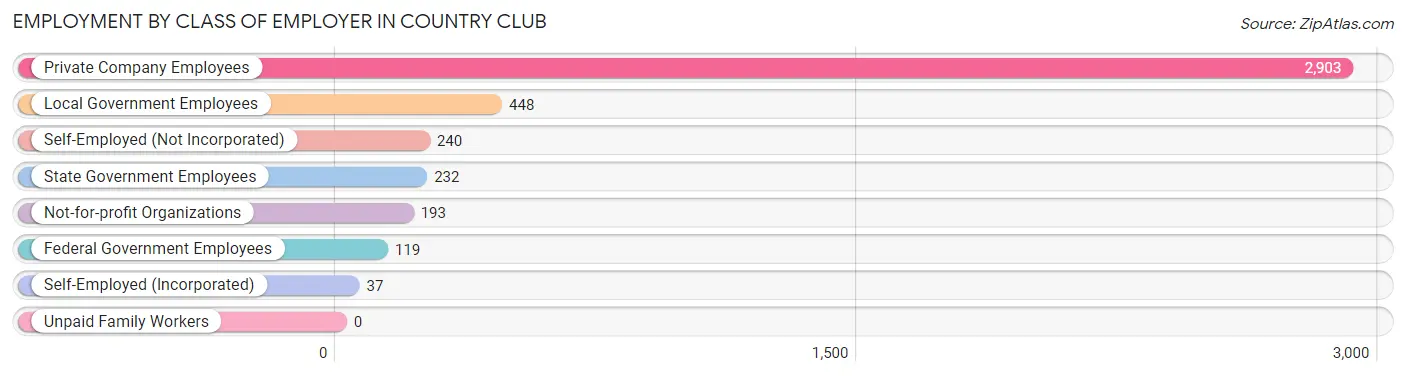
| Employer Class | # Employees | % Employees |
| Private Company Employees | 2,903 | 69.6% |
| Self-Employed (Incorporated) | 37 | 0.9% |
| Self-Employed (Not Incorporated) | 240 | 5.8% |
| Not-for-profit Organizations | 193 | 4.6% |
| Local Government Employees | 448 | 10.7% |
| State Government Employees | 232 | 5.6% |
| Federal Government Employees | 119 | 2.9% |
| Unpaid Family Workers | 0 | 0.0% |
| Total | 4,172 | 100.0% |
Employment Status by Age in Country Club
According to the labor force statistics for Country Club, out of the total population over 16 years of age (7,826), 58.8% or 4,602 individuals are in the labor force, with 8.1% or 373 of them unemployed. The age group with the highest labor force participation rate is 35 to 44 years, with 86.1% or 1,075 individuals in the labor force. Within the labor force, the 30 to 34 years age range has the highest percentage of unemployed individuals, with 15.2% or 126 of them being unemployed.
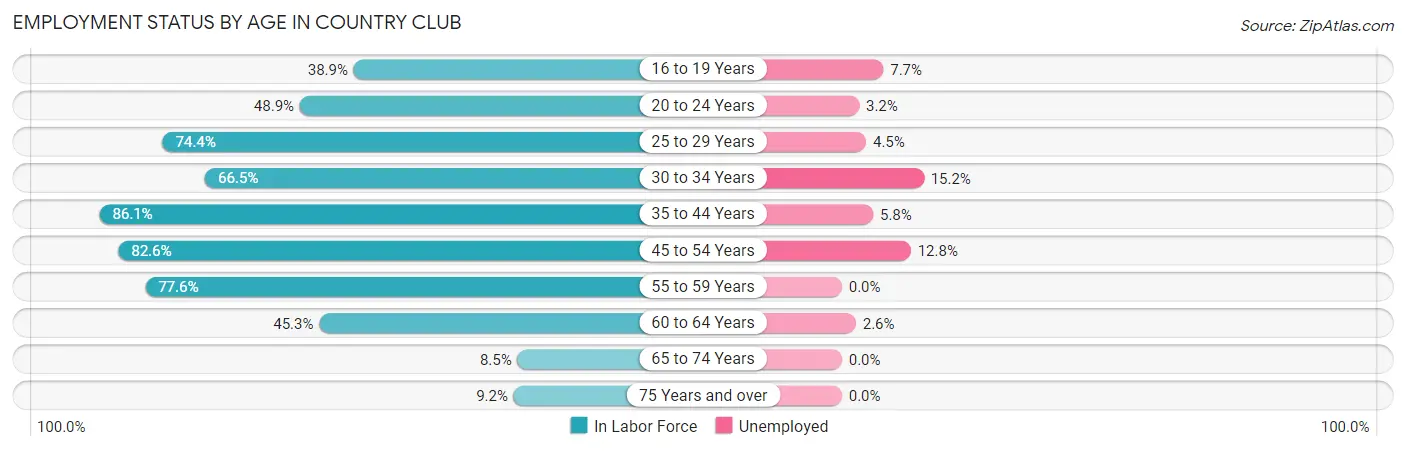
| Age Bracket | In Labor Force | Unemployed |
| 16 to 19 Years | 130 (38.9%) | 10 (7.7%) |
| 20 to 24 Years | 312 (48.9%) | 10 (3.2%) |
| 25 to 29 Years | 441 (74.4%) | 20 (4.5%) |
| 30 to 34 Years | 829 (66.5%) | 126 (15.2%) |
| 35 to 44 Years | 1,075 (86.1%) | 62 (5.8%) |
| 45 to 54 Years | 1,064 (82.6%) | 136 (12.8%) |
| 55 to 59 Years | 291 (77.6%) | 0 (0.0%) |
| 60 to 64 Years | 344 (45.3%) | 9 (2.6%) |
| 65 to 74 Years | 75 (8.5%) | 0 (0.0%) |
| 75 Years and over | 42 (9.2%) | 0 (0.0%) |
| Total | 4,602 (58.8%) | 373 (8.1%) |
Employment Status by Educational Attainment in Country Club
According to labor force statistics for Country Club, 73.4% of individuals (4,044) out of the total population between 25 and 64 years of age (5,510) are in the labor force, with 8.7% or 352 of them being unemployed. The group with the highest labor force participation rate are those with the educational attainment of bachelor's degree or higher, with 83.2% or 741 individuals in the labor force. Within the labor force, individuals with high school diploma education have the highest percentage of unemployment, with 16.0% or 225 of them being unemployed.
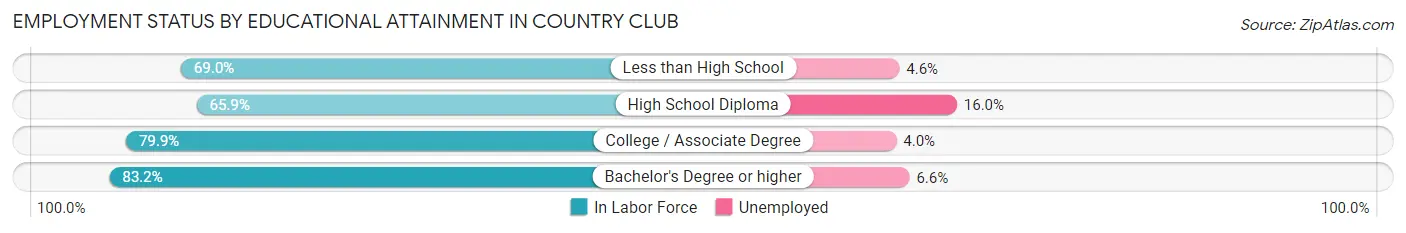
| Educational Attainment | In Labor Force | Unemployed |
| Less than High School | 560 (69.0%) | 37 (4.6%) |
| High School Diploma | 1,405 (65.9%) | 341 (16.0%) |
| College / Associate Degree | 1,338 (79.9%) | 67 (4.0%) |
| Bachelor's Degree or higher | 741 (83.2%) | 59 (6.6%) |
| Total | 4,044 (73.4%) | 479 (8.7%) |
Employment Occupations by Sex in Country Club
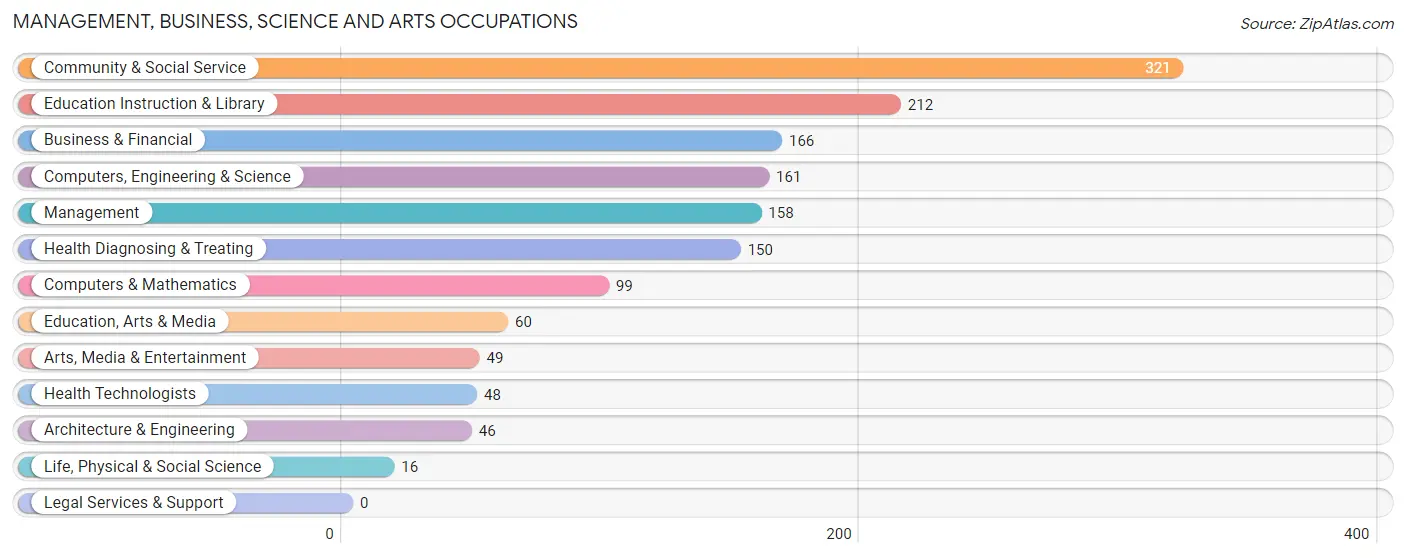
Management, Business, Science and Arts Occupations
The most common Management, Business, Science and Arts occupations in Country Club are Community & Social Service (321 | 7.6%), Education Instruction & Library (212 | 5.0%), Business & Financial (166 | 3.9%), Computers, Engineering & Science (161 | 3.8%), and Management (158 | 3.7%).
Management, Business, Science and Arts Occupations by Sex
Within the Management, Business, Science and Arts occupations in Country Club, the most male-oriented occupations are Architecture & Engineering (100.0%), Computers, Engineering & Science (83.9%), and Computers & Mathematics (79.8%), while the most female-oriented occupations are Education, Arts & Media (100.0%), Health Diagnosing & Treating (91.3%), and Education Instruction & Library (90.1%).
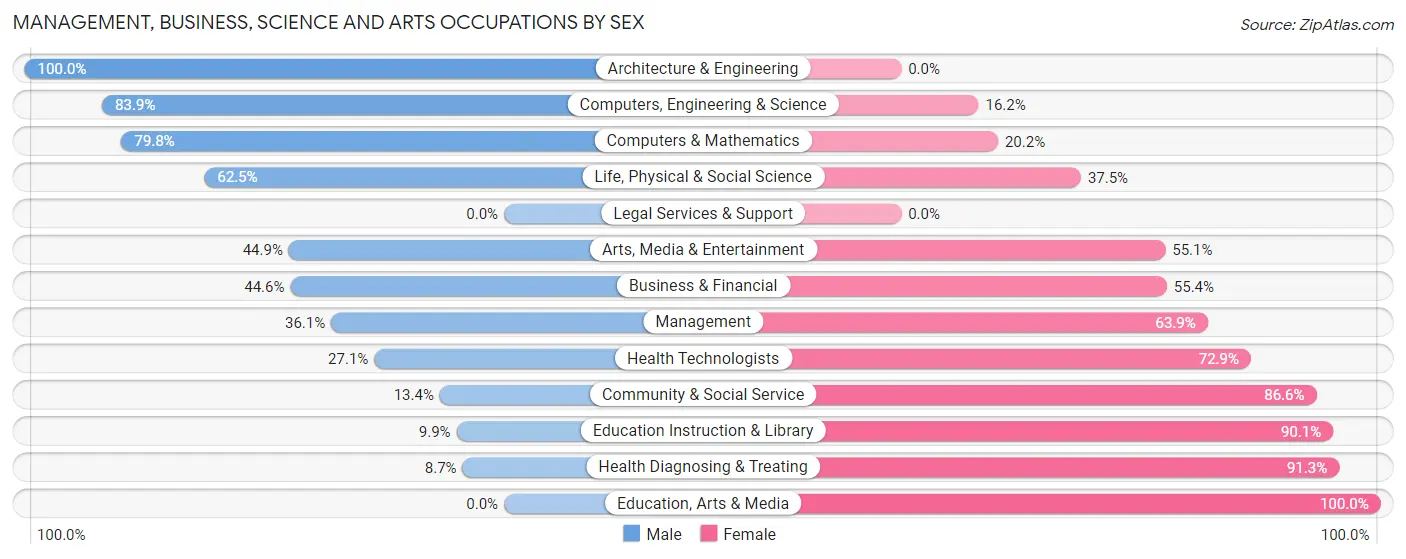
| Occupation | Male | Female |
| Management | 57 (36.1%) | 101 (63.9%) |
| Business & Financial | 74 (44.6%) | 92 (55.4%) |
| Computers, Engineering & Science | 135 (83.9%) | 26 (16.2%) |
| Computers & Mathematics | 79 (79.8%) | 20 (20.2%) |
| Architecture & Engineering | 46 (100.0%) | 0 (0.0%) |
| Life, Physical & Social Science | 10 (62.5%) | 6 (37.5%) |
| Community & Social Service | 43 (13.4%) | 278 (86.6%) |
| Education, Arts & Media | 0 (0.0%) | 60 (100.0%) |
| Legal Services & Support | 0 (0.0%) | 0 (0.0%) |
| Education Instruction & Library | 21 (9.9%) | 191 (90.1%) |
| Arts, Media & Entertainment | 22 (44.9%) | 27 (55.1%) |
| Health Diagnosing & Treating | 13 (8.7%) | 137 (91.3%) |
| Health Technologists | 13 (27.1%) | 35 (72.9%) |
| Total (Category) | 322 (33.7%) | 634 (66.3%) |
| Total (Overall) | 2,239 (52.9%) | 1,991 (47.1%) |
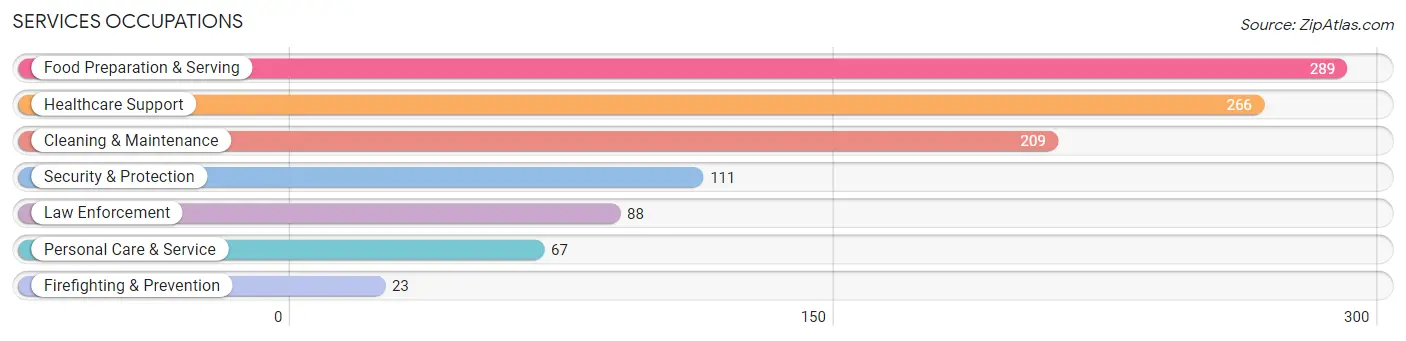
Services Occupations
The most common Services occupations in Country Club are Food Preparation & Serving (289 | 6.8%), Healthcare Support (266 | 6.3%), Cleaning & Maintenance (209 | 4.9%), Security & Protection (111 | 2.6%), and Law Enforcement (88 | 2.1%).
Services Occupations by Sex
Within the Services occupations in Country Club, the most male-oriented occupations are Security & Protection (100.0%), Firefighting & Prevention (100.0%), and Law Enforcement (100.0%), while the most female-oriented occupations are Personal Care & Service (79.1%), Healthcare Support (75.2%), and Food Preparation & Serving (70.2%).
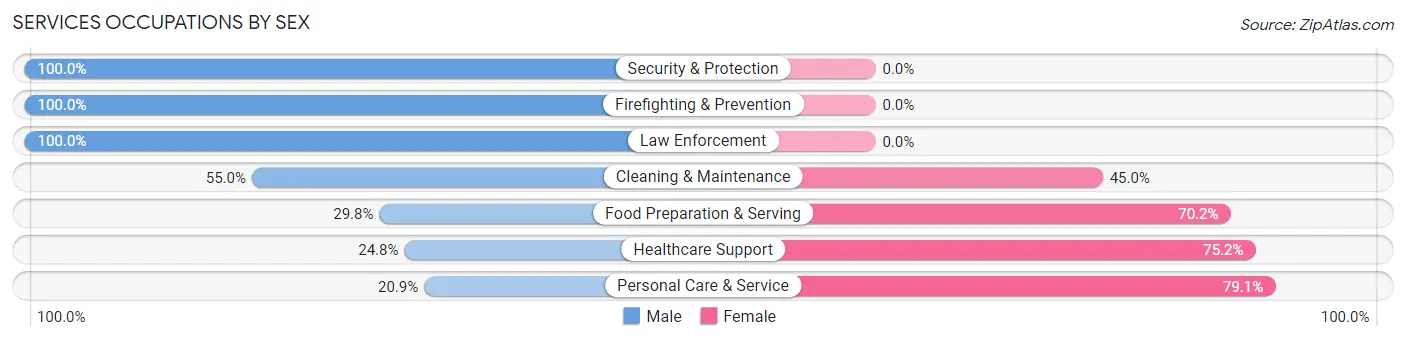
| Occupation | Male | Female |
| Healthcare Support | 66 (24.8%) | 200 (75.2%) |
| Security & Protection | 111 (100.0%) | 0 (0.0%) |
| Firefighting & Prevention | 23 (100.0%) | 0 (0.0%) |
| Law Enforcement | 88 (100.0%) | 0 (0.0%) |
| Food Preparation & Serving | 86 (29.8%) | 203 (70.2%) |
| Cleaning & Maintenance | 115 (55.0%) | 94 (45.0%) |
| Personal Care & Service | 14 (20.9%) | 53 (79.1%) |
| Total (Category) | 392 (41.6%) | 550 (58.4%) |
| Total (Overall) | 2,239 (52.9%) | 1,991 (47.1%) |
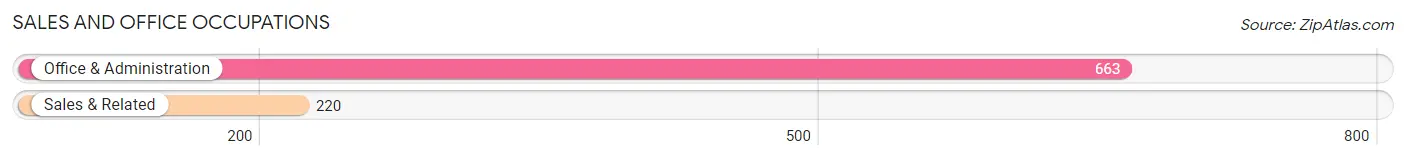
Sales and Office Occupations
The most common Sales and Office occupations in Country Club are Office & Administration (663 | 15.7%), and Sales & Related (220 | 5.2%).
Sales and Office Occupations by Sex
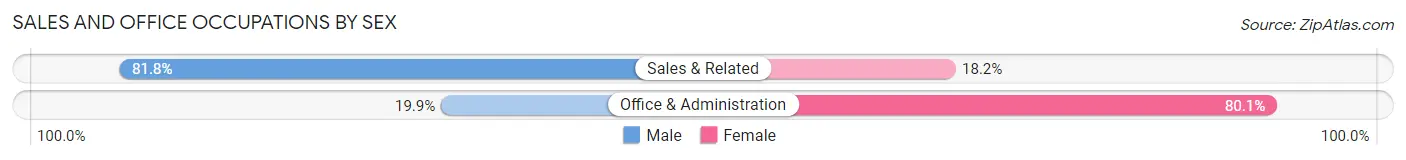
| Occupation | Male | Female |
| Sales & Related | 180 (81.8%) | 40 (18.2%) |
| Office & Administration | 132 (19.9%) | 531 (80.1%) |
| Total (Category) | 312 (35.3%) | 571 (64.7%) |
| Total (Overall) | 2,239 (52.9%) | 1,991 (47.1%) |
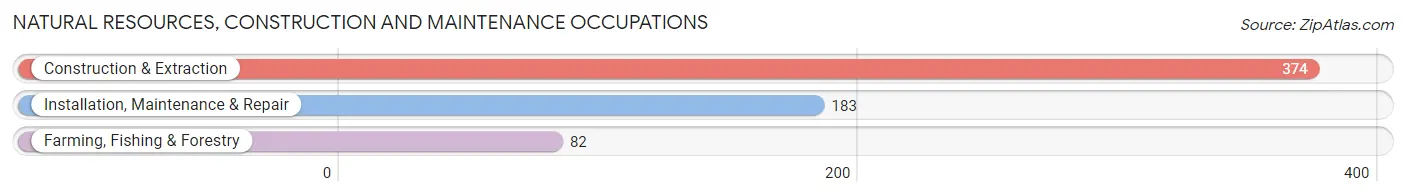
Natural Resources, Construction and Maintenance Occupations
The most common Natural Resources, Construction and Maintenance occupations in Country Club are Construction & Extraction (374 | 8.8%), Installation, Maintenance & Repair (183 | 4.3%), and Farming, Fishing & Forestry (82 | 1.9%).
Natural Resources, Construction and Maintenance Occupations by Sex
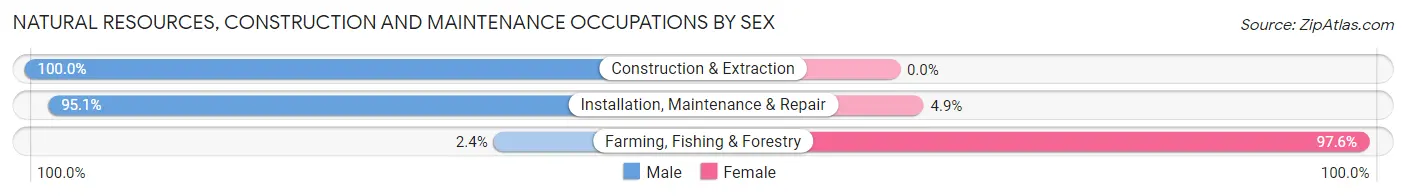
| Occupation | Male | Female |
| Farming, Fishing & Forestry | 2 (2.4%) | 80 (97.6%) |
| Construction & Extraction | 374 (100.0%) | 0 (0.0%) |
| Installation, Maintenance & Repair | 174 (95.1%) | 9 (4.9%) |
| Total (Category) | 550 (86.1%) | 89 (13.9%) |
| Total (Overall) | 2,239 (52.9%) | 1,991 (47.1%) |
Production, Transportation and Moving Occupations
The most common Production, Transportation and Moving occupations in Country Club are Material Moving (327 | 7.7%), Transportation (272 | 6.4%), and Production (211 | 5.0%).
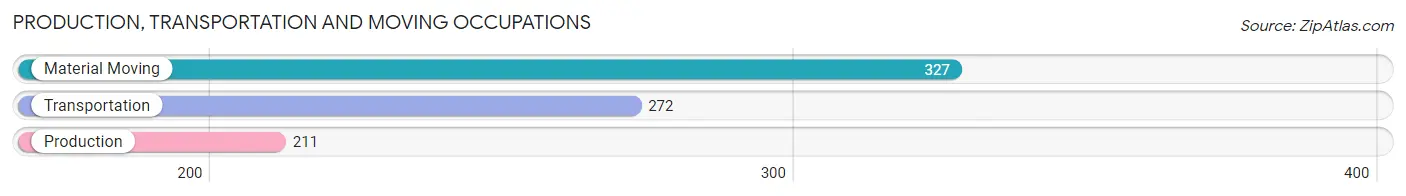
Production, Transportation and Moving Occupations by Sex
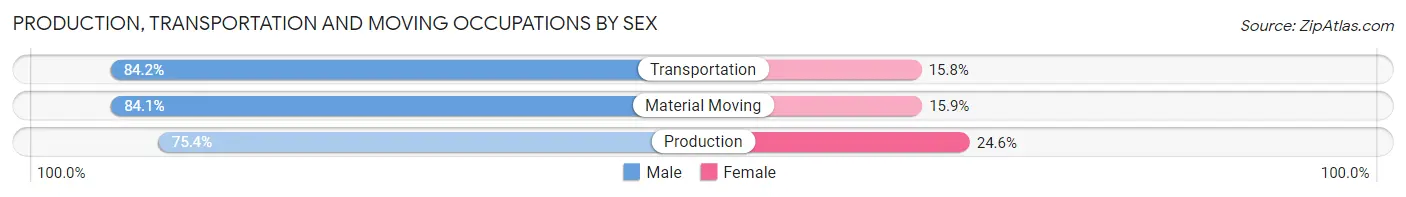
| Occupation | Male | Female |
| Production | 159 (75.4%) | 52 (24.6%) |
| Transportation | 229 (84.2%) | 43 (15.8%) |
| Material Moving | 275 (84.1%) | 52 (15.9%) |
| Total (Category) | 663 (81.9%) | 147 (18.1%) |
| Total (Overall) | 2,239 (52.9%) | 1,991 (47.1%) |
Employment Industries by Sex in Country Club
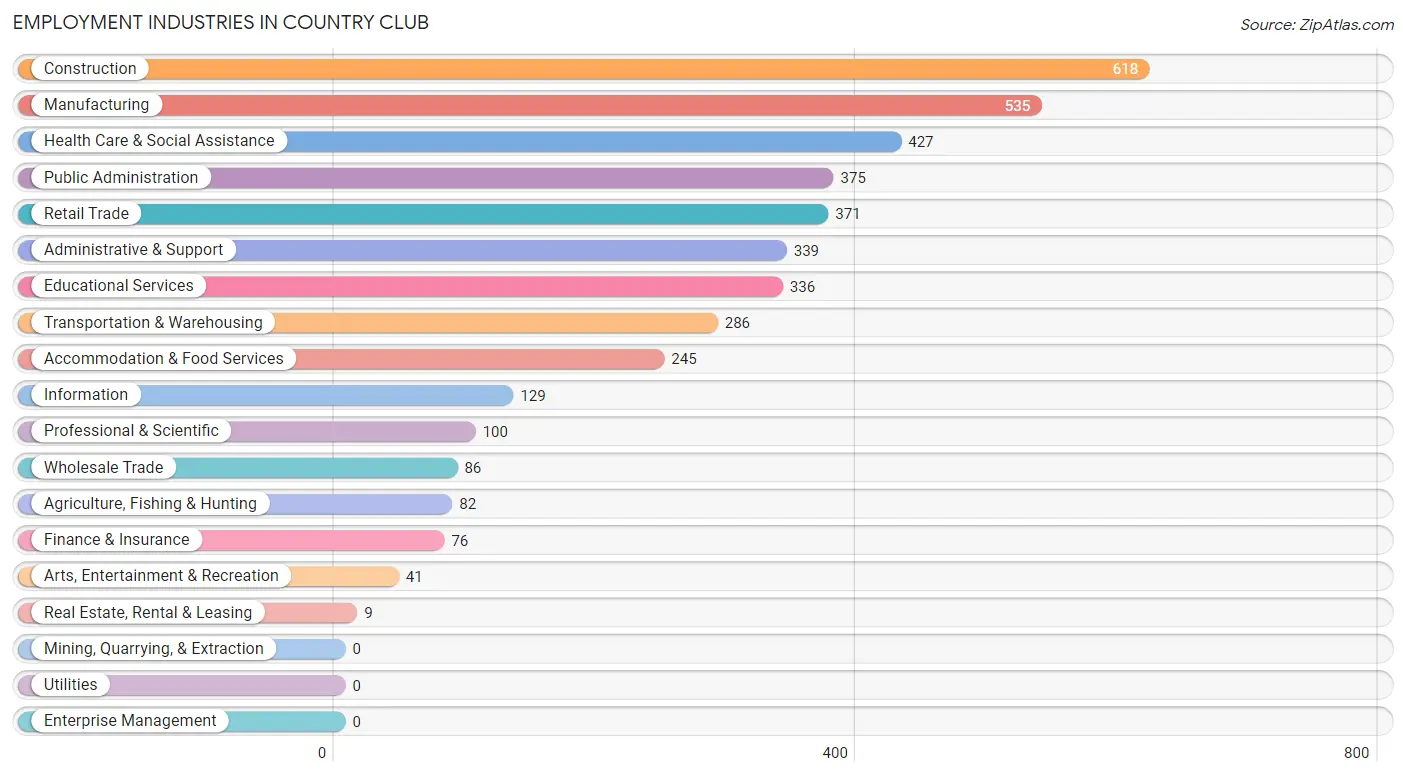
Employment Industries in Country Club
The major employment industries in Country Club include Construction (618 | 14.6%), Manufacturing (535 | 12.7%), Health Care & Social Assistance (427 | 10.1%), Public Administration (375 | 8.9%), and Retail Trade (371 | 8.8%).
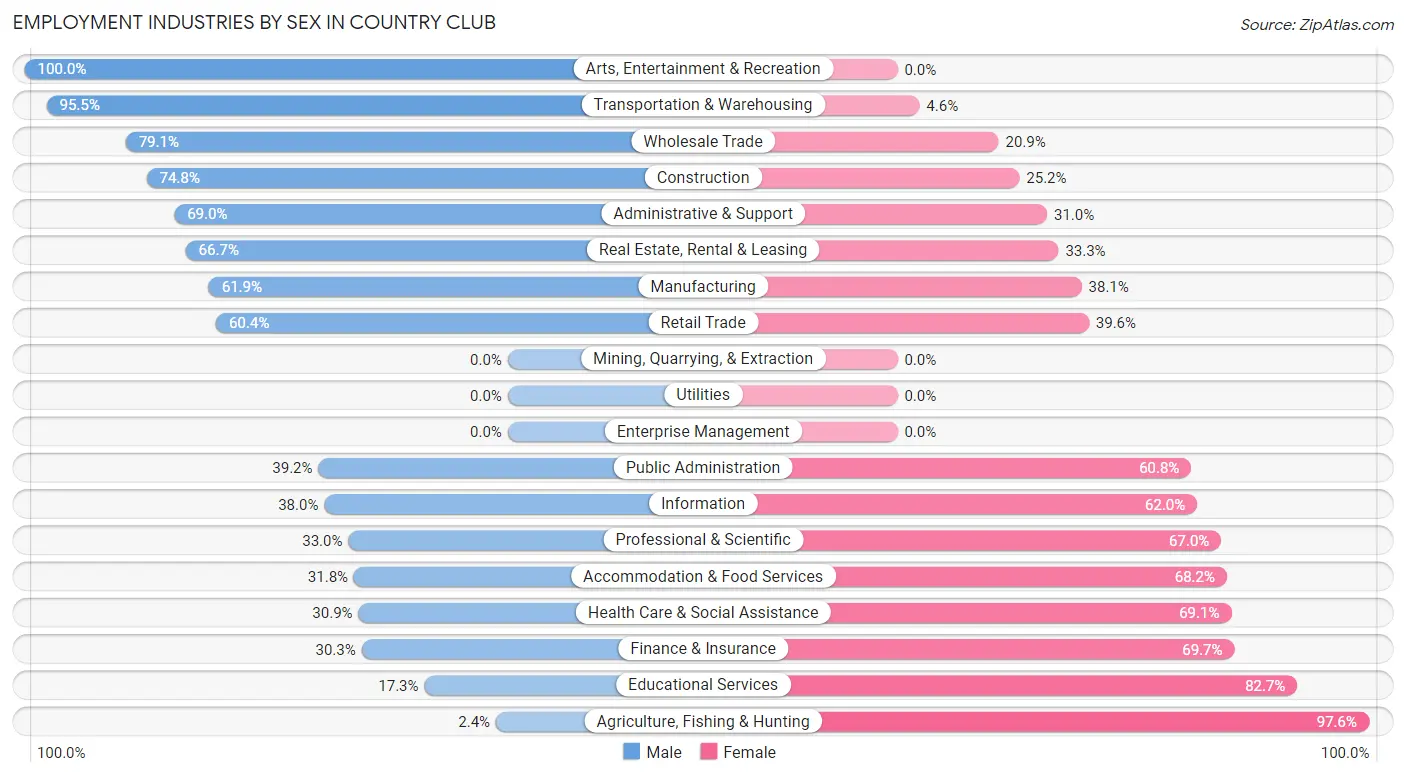
Employment Industries by Sex in Country Club
The Country Club industries that see more men than women are Arts, Entertainment & Recreation (100.0%), Transportation & Warehousing (95.5%), and Wholesale Trade (79.1%), whereas the industries that tend to have a higher number of women are Agriculture, Fishing & Hunting (97.6%), Educational Services (82.7%), and Finance & Insurance (69.7%).
| Industry | Male | Female |
| Agriculture, Fishing & Hunting | 2 (2.4%) | 80 (97.6%) |
| Mining, Quarrying, & Extraction | 0 (0.0%) | 0 (0.0%) |
| Construction | 462 (74.8%) | 156 (25.2%) |
| Manufacturing | 331 (61.9%) | 204 (38.1%) |
| Wholesale Trade | 68 (79.1%) | 18 (20.9%) |
| Retail Trade | 224 (60.4%) | 147 (39.6%) |
| Transportation & Warehousing | 273 (95.5%) | 13 (4.5%) |
| Utilities | 0 (0.0%) | 0 (0.0%) |
| Information | 49 (38.0%) | 80 (62.0%) |
| Finance & Insurance | 23 (30.3%) | 53 (69.7%) |
| Real Estate, Rental & Leasing | 6 (66.7%) | 3 (33.3%) |
| Professional & Scientific | 33 (33.0%) | 67 (67.0%) |
| Enterprise Management | 0 (0.0%) | 0 (0.0%) |
| Administrative & Support | 234 (69.0%) | 105 (31.0%) |
| Educational Services | 58 (17.3%) | 278 (82.7%) |
| Health Care & Social Assistance | 132 (30.9%) | 295 (69.1%) |
| Arts, Entertainment & Recreation | 41 (100.0%) | 0 (0.0%) |
| Accommodation & Food Services | 78 (31.8%) | 167 (68.2%) |
| Public Administration | 147 (39.2%) | 228 (60.8%) |
| Total | 2,239 (52.9%) | 1,991 (47.1%) |
Education in Country Club
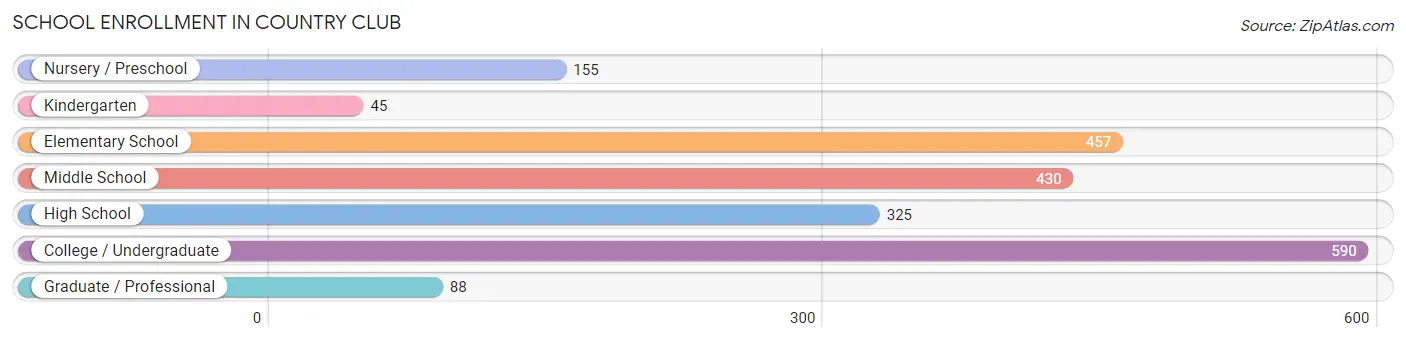
School Enrollment in Country Club
The most common levels of schooling among the 2,090 students in Country Club are college / undergraduate (590 | 28.2%), elementary school (457 | 21.9%), and middle school (430 | 20.6%).
| School Level | # Students | % Students |
| Nursery / Preschool | 155 | 7.4% |
| Kindergarten | 45 | 2.1% |
| Elementary School | 457 | 21.9% |
| Middle School | 430 | 20.6% |
| High School | 325 | 15.5% |
| College / Undergraduate | 590 | 28.2% |
| Graduate / Professional | 88 | 4.2% |
| Total | 2,090 | 100.0% |
School Enrollment by Age by Funding Source in Country Club
Out of a total of 2,090 students who are enrolled in schools in Country Club, 318 (15.2%) attend a private institution, while the remaining 1,772 (84.8%) are enrolled in public schools. The age group of 25 to 34 year olds has the highest likelihood of being enrolled in private schools, with 102 (85.0% in the age bracket) enrolled. Conversely, the age group of 15 to 17 year olds has the lowest likelihood of being enrolled in a private school, with 209 (100.0% in the age bracket) attending a public institution.
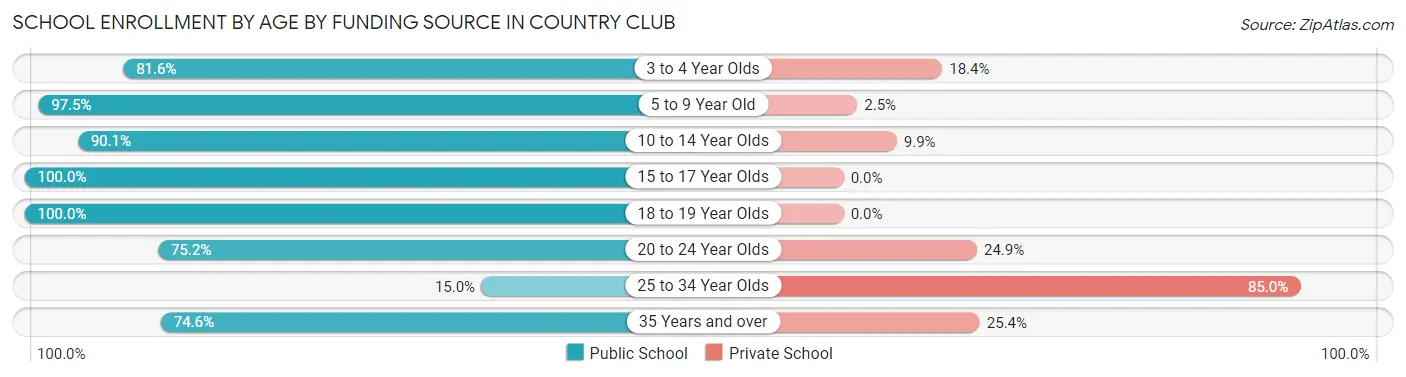
| Age Bracket | Public School | Private School |
| 3 to 4 Year Olds | 120 (81.6%) | 27 (18.4%) |
| 5 to 9 Year Old | 422 (97.5%) | 11 (2.5%) |
| 10 to 14 Year Olds | 546 (90.1%) | 60 (9.9%) |
| 15 to 17 Year Olds | 209 (100.0%) | 0 (0.0%) |
| 18 to 19 Year Olds | 107 (100.0%) | 0 (0.0%) |
| 20 to 24 Year Olds | 251 (75.1%) | 83 (24.8%) |
| 25 to 34 Year Olds | 18 (15.0%) | 102 (85.0%) |
| 35 Years and over | 100 (74.6%) | 34 (25.4%) |
| Total | 1,772 (84.8%) | 318 (15.2%) |
Educational Attainment by Field of Study in Country Club
Business (185 | 16.8%), social sciences (163 | 14.8%), education (145 | 13.2%), psychology (144 | 13.1%), and arts & humanities (122 | 11.1%) are the most common fields of study among 1,099 individuals in Country Club who have obtained a bachelor's degree or higher.
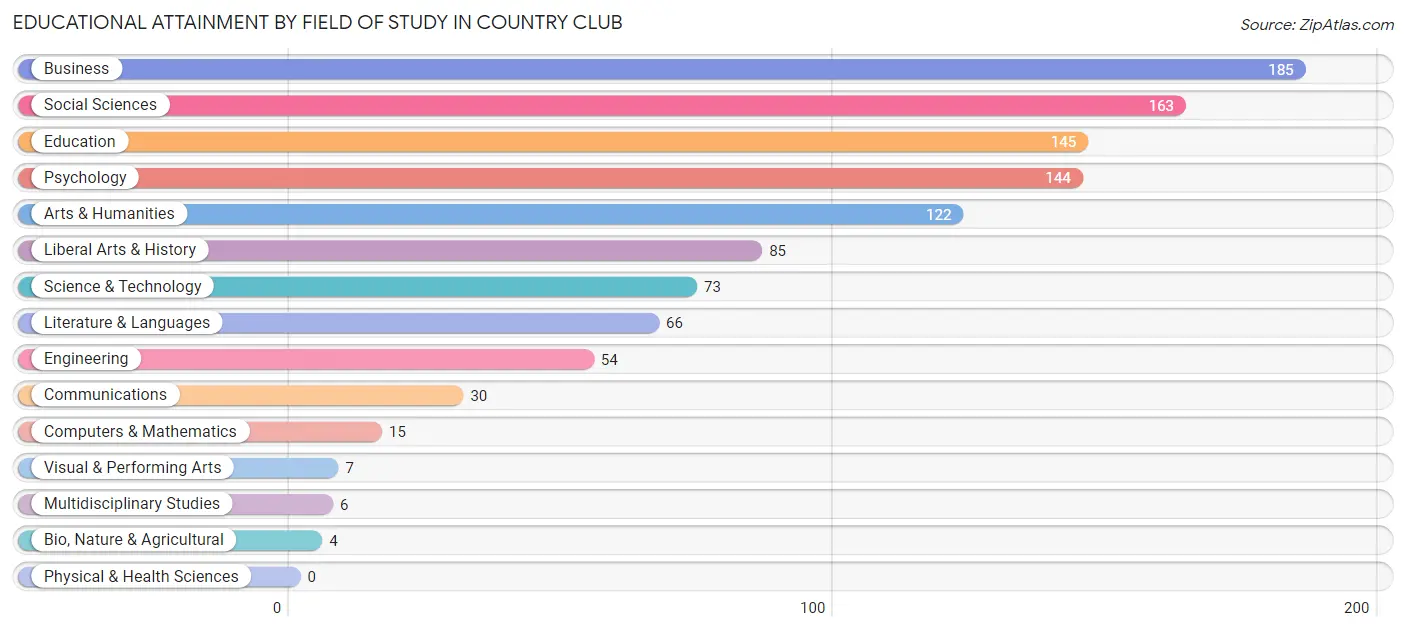
| Field of Study | # Graduates | % Graduates |
| Computers & Mathematics | 15 | 1.4% |
| Bio, Nature & Agricultural | 4 | 0.4% |
| Physical & Health Sciences | 0 | 0.0% |
| Psychology | 144 | 13.1% |
| Social Sciences | 163 | 14.8% |
| Engineering | 54 | 4.9% |
| Multidisciplinary Studies | 6 | 0.5% |
| Science & Technology | 73 | 6.6% |
| Business | 185 | 16.8% |
| Education | 145 | 13.2% |
| Literature & Languages | 66 | 6.0% |
| Liberal Arts & History | 85 | 7.7% |
| Visual & Performing Arts | 7 | 0.6% |
| Communications | 30 | 2.7% |
| Arts & Humanities | 122 | 11.1% |
| Total | 1,099 | 100.0% |
Transportation & Commute in Country Club
Vehicle Availability by Sex in Country Club
The most prevalent vehicle ownership categories in Country Club are males with 2 vehicles (808, accounting for 36.1%) and females with 2 vehicles (537, making up 41.9%).
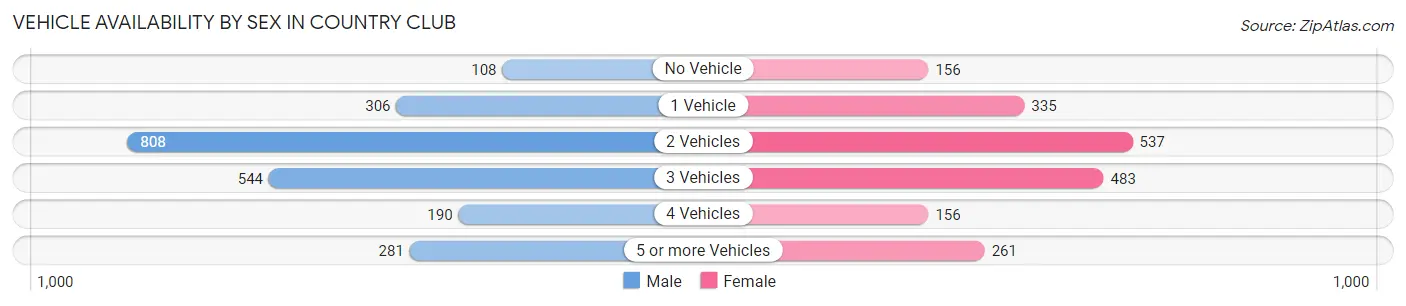
| Vehicles Available | Male | Female |
| No Vehicle | 108 (4.8%) | 156 (8.1%) |
| 1 Vehicle | 306 (13.7%) | 335 (17.4%) |
| 2 Vehicles | 808 (36.1%) | 537 (27.9%) |
| 3 Vehicles | 544 (24.3%) | 483 (25.1%) |
| 4 Vehicles | 190 (8.5%) | 156 (8.1%) |
| 5 or more Vehicles | 281 (12.6%) | 261 (13.5%) |
| Total | 2,237 (100.0%) | 1,928 (100.0%) |
Commute Time in Country Club
The most frequently occuring commute durations in Country Club are 10 to 14 minutes (877 commuters, 22.0%), 15 to 19 minutes (733 commuters, 18.4%), and 20 to 24 minutes (666 commuters, 16.7%).
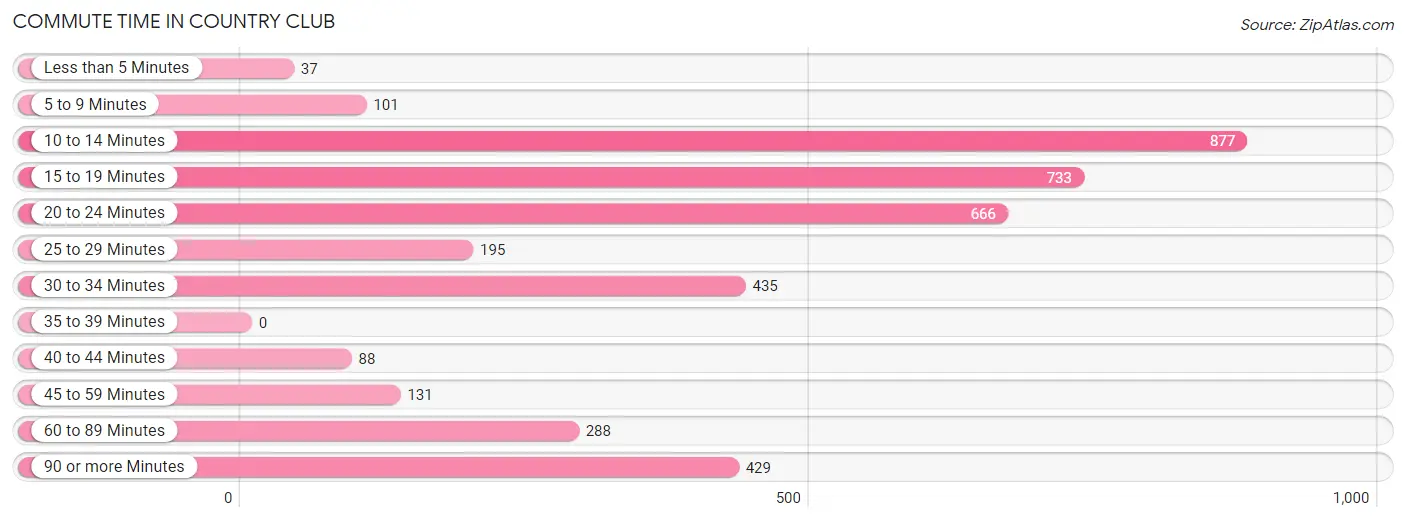
| Commute Time | # Commuters | % Commuters |
| Less than 5 Minutes | 37 | 0.9% |
| 5 to 9 Minutes | 101 | 2.5% |
| 10 to 14 Minutes | 877 | 22.0% |
| 15 to 19 Minutes | 733 | 18.4% |
| 20 to 24 Minutes | 666 | 16.7% |
| 25 to 29 Minutes | 195 | 4.9% |
| 30 to 34 Minutes | 435 | 10.9% |
| 35 to 39 Minutes | 0 | 0.0% |
| 40 to 44 Minutes | 88 | 2.2% |
| 45 to 59 Minutes | 131 | 3.3% |
| 60 to 89 Minutes | 288 | 7.2% |
| 90 or more Minutes | 429 | 10.8% |
Commute Time by Sex in Country Club
The most common commute times in Country Club are 20 to 24 minutes (430 commuters, 19.7%) for males and 10 to 14 minutes (585 commuters, 32.5%) for females.
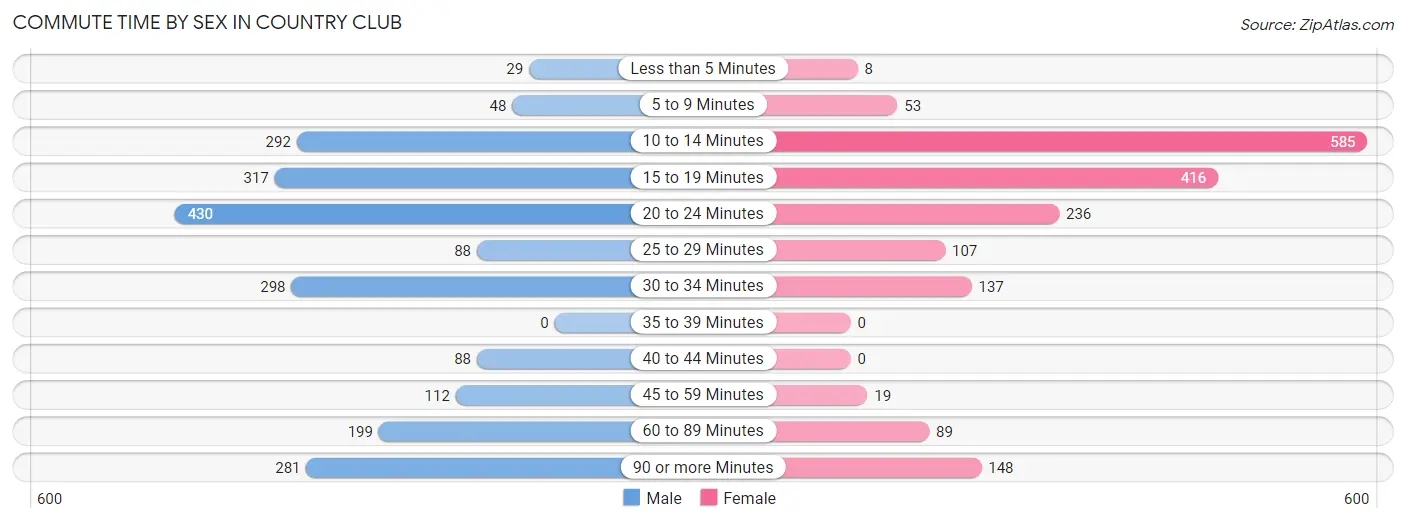
| Commute Time | Male | Female |
| Less than 5 Minutes | 29 (1.3%) | 8 (0.4%) |
| 5 to 9 Minutes | 48 (2.2%) | 53 (2.9%) |
| 10 to 14 Minutes | 292 (13.4%) | 585 (32.5%) |
| 15 to 19 Minutes | 317 (14.5%) | 416 (23.1%) |
| 20 to 24 Minutes | 430 (19.7%) | 236 (13.1%) |
| 25 to 29 Minutes | 88 (4.0%) | 107 (5.9%) |
| 30 to 34 Minutes | 298 (13.7%) | 137 (7.6%) |
| 35 to 39 Minutes | 0 (0.0%) | 0 (0.0%) |
| 40 to 44 Minutes | 88 (4.0%) | 0 (0.0%) |
| 45 to 59 Minutes | 112 (5.1%) | 19 (1.1%) |
| 60 to 89 Minutes | 199 (9.1%) | 89 (5.0%) |
| 90 or more Minutes | 281 (12.9%) | 148 (8.2%) |
Time of Departure to Work by Sex in Country Club
The most frequent times of departure to work in Country Club are 7:00 AM to 7:29 AM (404, 18.5%) for males and 7:30 AM to 7:59 AM (286, 15.9%) for females.
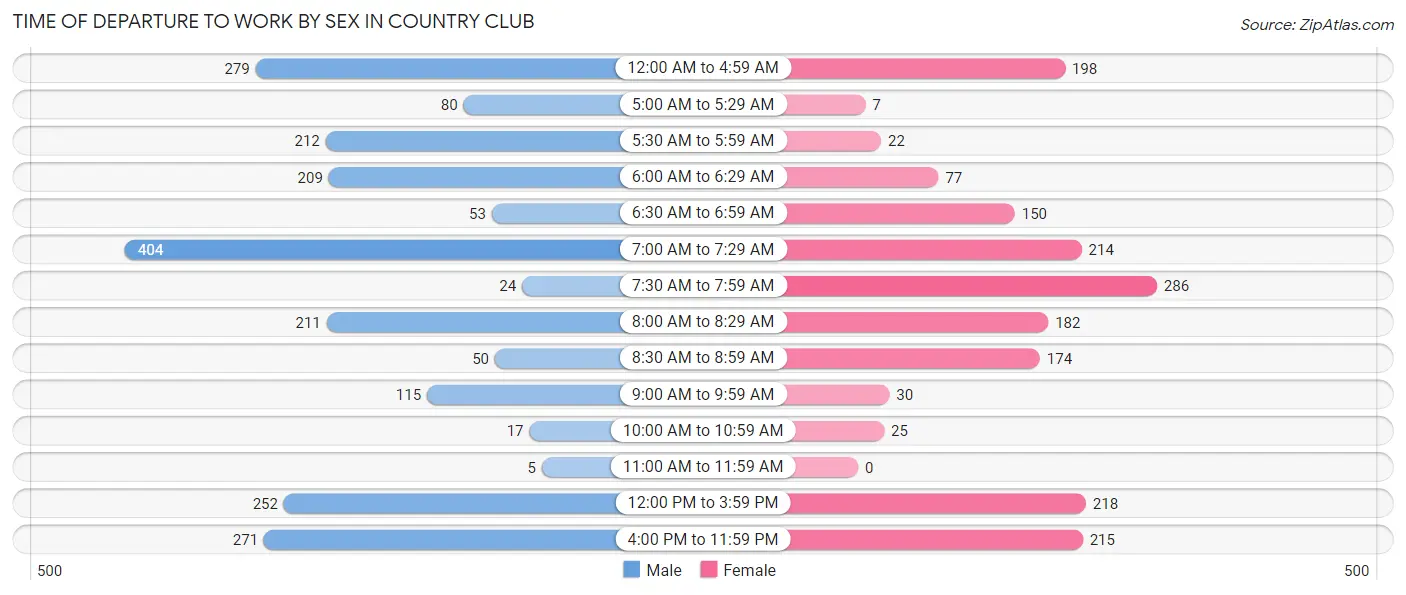
| Time of Departure | Male | Female |
| 12:00 AM to 4:59 AM | 279 (12.8%) | 198 (11.0%) |
| 5:00 AM to 5:29 AM | 80 (3.7%) | 7 (0.4%) |
| 5:30 AM to 5:59 AM | 212 (9.7%) | 22 (1.2%) |
| 6:00 AM to 6:29 AM | 209 (9.6%) | 77 (4.3%) |
| 6:30 AM to 6:59 AM | 53 (2.4%) | 150 (8.3%) |
| 7:00 AM to 7:29 AM | 404 (18.5%) | 214 (11.9%) |
| 7:30 AM to 7:59 AM | 24 (1.1%) | 286 (15.9%) |
| 8:00 AM to 8:29 AM | 211 (9.7%) | 182 (10.1%) |
| 8:30 AM to 8:59 AM | 50 (2.3%) | 174 (9.7%) |
| 9:00 AM to 9:59 AM | 115 (5.3%) | 30 (1.7%) |
| 10:00 AM to 10:59 AM | 17 (0.8%) | 25 (1.4%) |
| 11:00 AM to 11:59 AM | 5 (0.2%) | 0 (0.0%) |
| 12:00 PM to 3:59 PM | 252 (11.6%) | 218 (12.1%) |
| 4:00 PM to 11:59 PM | 271 (12.4%) | 215 (12.0%) |
| Total | 2,182 (100.0%) | 1,798 (100.0%) |
Housing Occupancy in Country Club
Occupancy by Ownership in Country Club
Of the total 3,333 dwellings in Country Club, owner-occupied units account for 2,265 (68.0%), while renter-occupied units make up 1,068 (32.0%).
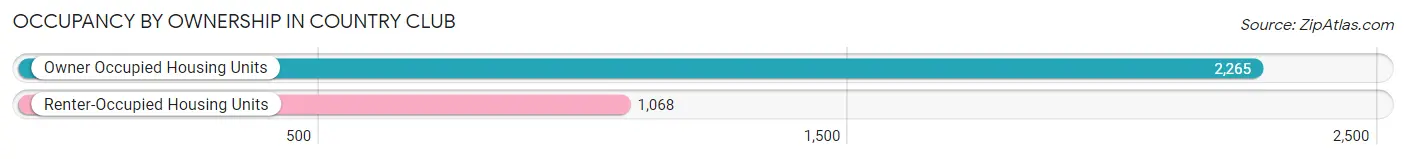
| Occupancy | # Housing Units | % Housing Units |
| Owner Occupied Housing Units | 2,265 | 68.0% |
| Renter-Occupied Housing Units | 1,068 | 32.0% |
| Total Occupied Housing Units | 3,333 | 100.0% |
Occupancy by Household Size in Country Club
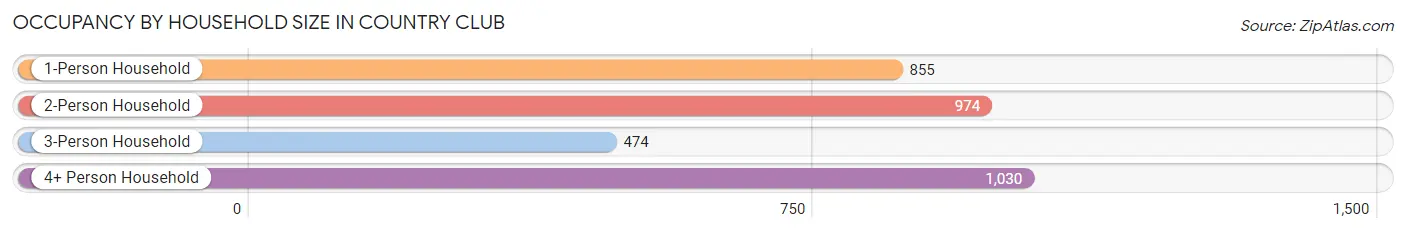
| Household Size | # Housing Units | % Housing Units |
| 1-Person Household | 855 | 25.7% |
| 2-Person Household | 974 | 29.2% |
| 3-Person Household | 474 | 14.2% |
| 4+ Person Household | 1,030 | 30.9% |
| Total Housing Units | 3,333 | 100.0% |
Occupancy by Ownership by Household Size in Country Club
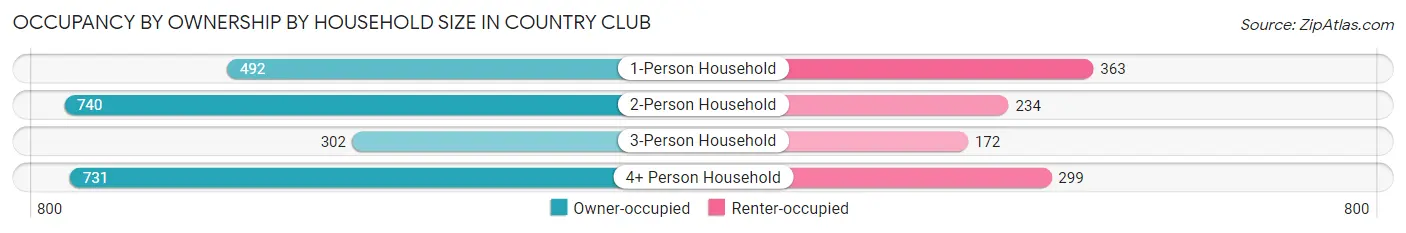
| Household Size | Owner-occupied | Renter-occupied |
| 1-Person Household | 492 (57.5%) | 363 (42.5%) |
| 2-Person Household | 740 (76.0%) | 234 (24.0%) |
| 3-Person Household | 302 (63.7%) | 172 (36.3%) |
| 4+ Person Household | 731 (71.0%) | 299 (29.0%) |
| Total Housing Units | 2,265 (68.0%) | 1,068 (32.0%) |
Occupancy by Educational Attainment in Country Club
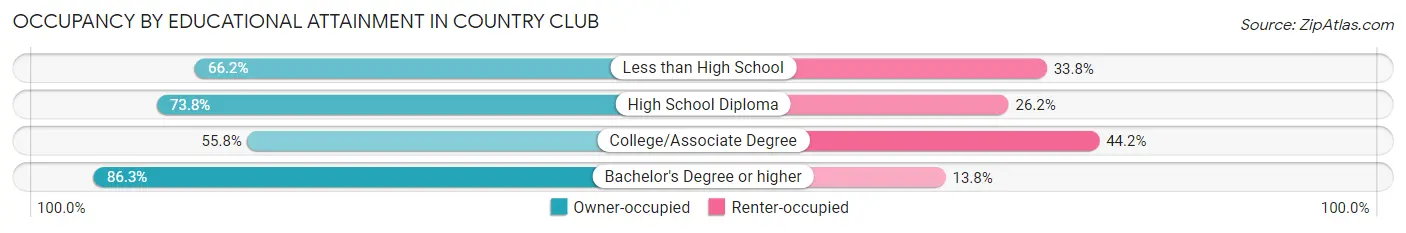
| Household Size | Owner-occupied | Renter-occupied |
| Less than High School | 280 (66.2%) | 143 (33.8%) |
| High School Diploma | 821 (73.8%) | 292 (26.2%) |
| College/Associate Degree | 706 (55.8%) | 560 (44.2%) |
| Bachelor's Degree or higher | 458 (86.3%) | 73 (13.8%) |
Occupancy by Age of Householder in Country Club
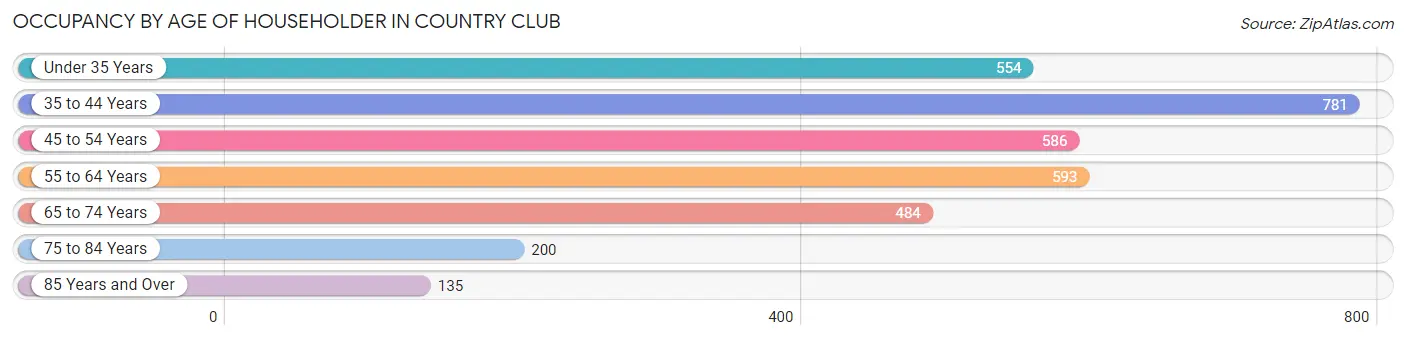
| Age Bracket | # Households | % Households |
| Under 35 Years | 554 | 16.6% |
| 35 to 44 Years | 781 | 23.4% |
| 45 to 54 Years | 586 | 17.6% |
| 55 to 64 Years | 593 | 17.8% |
| 65 to 74 Years | 484 | 14.5% |
| 75 to 84 Years | 200 | 6.0% |
| 85 Years and Over | 135 | 4.1% |
| Total | 3,333 | 100.0% |
Housing Finances in Country Club
Median Income by Occupancy in Country Club
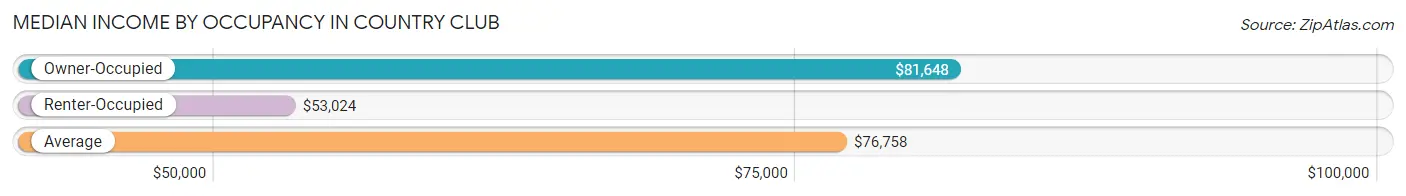
| Occupancy Type | # Households | Median Income |
| Owner-Occupied | 2,265 (68.0%) | $81,648 |
| Renter-Occupied | 1,068 (32.0%) | $53,024 |
| Average | 3,333 (100.0%) | $76,758 |
Occupancy by Householder Income Bracket in Country Club
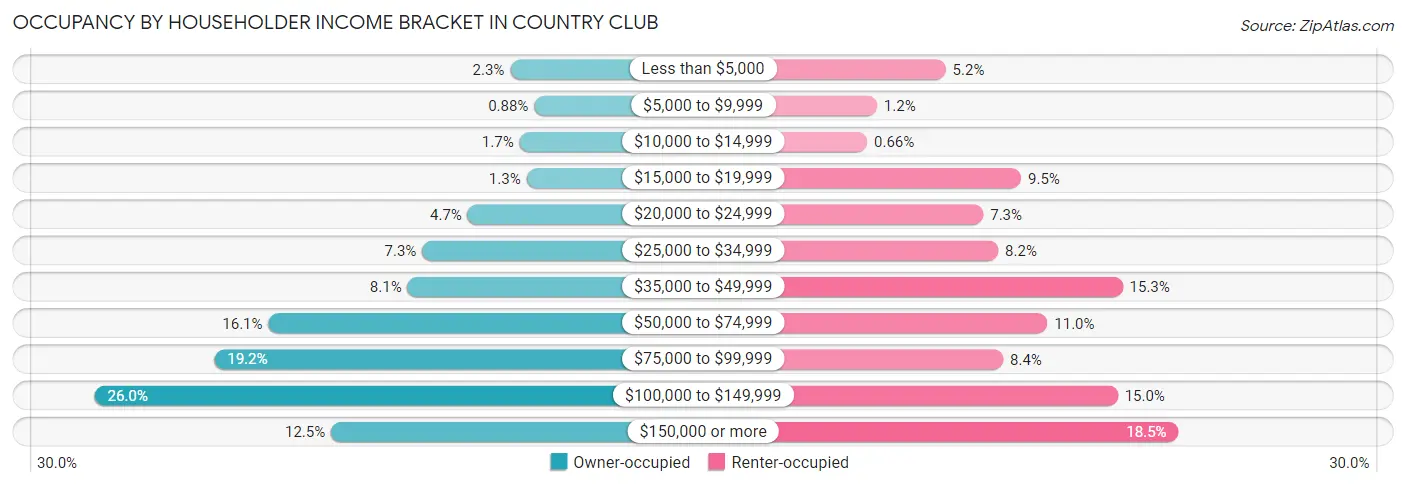
| Income Bracket | Owner-occupied | Renter-occupied |
| Less than $5,000 | 51 (2.2%) | 55 (5.1%) |
| $5,000 to $9,999 | 20 (0.9%) | 13 (1.2%) |
| $10,000 to $14,999 | 39 (1.7%) | 7 (0.7%) |
| $15,000 to $19,999 | 30 (1.3%) | 101 (9.5%) |
| $20,000 to $24,999 | 106 (4.7%) | 78 (7.3%) |
| $25,000 to $34,999 | 165 (7.3%) | 87 (8.2%) |
| $35,000 to $49,999 | 184 (8.1%) | 163 (15.3%) |
| $50,000 to $74,999 | 364 (16.1%) | 117 (11.0%) |
| $75,000 to $99,999 | 434 (19.2%) | 90 (8.4%) |
| $100,000 to $149,999 | 589 (26.0%) | 160 (15.0%) |
| $150,000 or more | 283 (12.5%) | 197 (18.4%) |
| Total | 2,265 (100.0%) | 1,068 (100.0%) |
Monthly Housing Cost Tiers in Country Club
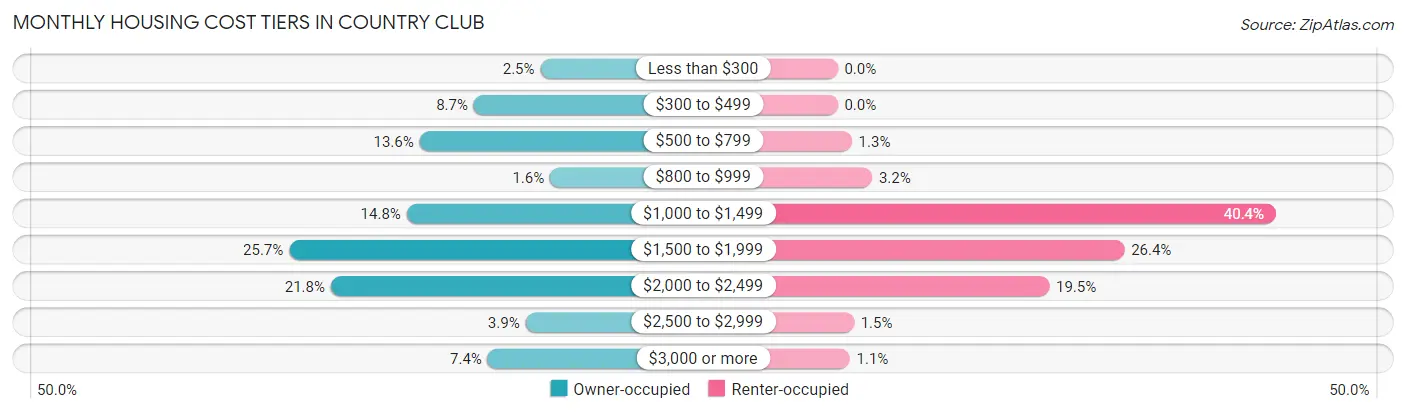
| Monthly Cost | Owner-occupied | Renter-occupied |
| Less than $300 | 57 (2.5%) | 0 (0.0%) |
| $300 to $499 | 196 (8.6%) | 0 (0.0%) |
| $500 to $799 | 309 (13.6%) | 14 (1.3%) |
| $800 to $999 | 37 (1.6%) | 34 (3.2%) |
| $1,000 to $1,499 | 336 (14.8%) | 431 (40.4%) |
| $1,500 to $1,999 | 581 (25.7%) | 282 (26.4%) |
| $2,000 to $2,499 | 494 (21.8%) | 208 (19.5%) |
| $2,500 to $2,999 | 88 (3.9%) | 16 (1.5%) |
| $3,000 or more | 167 (7.4%) | 12 (1.1%) |
| Total | 2,265 (100.0%) | 1,068 (100.0%) |
Physical Housing Characteristics in Country Club
Housing Structures in Country Club
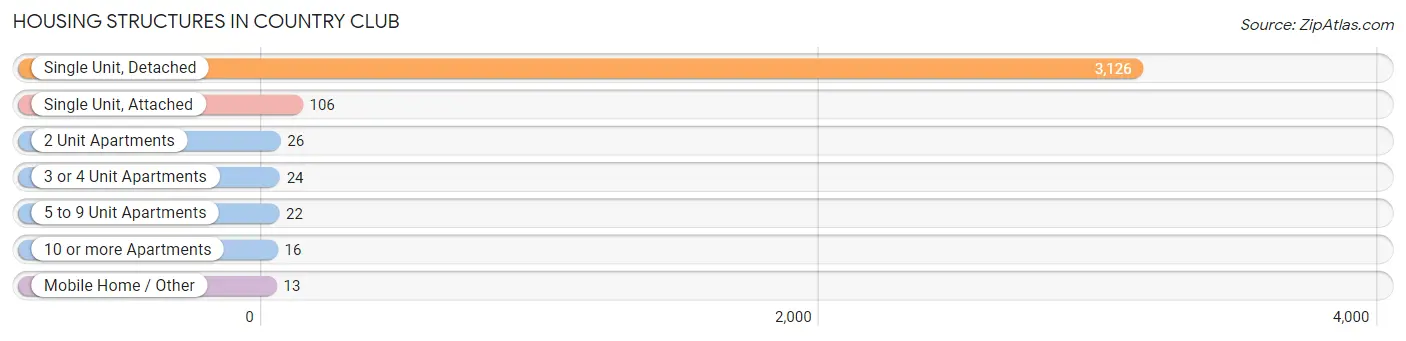
| Structure Type | # Housing Units | % Housing Units |
| Single Unit, Detached | 3,126 | 93.8% |
| Single Unit, Attached | 106 | 3.2% |
| 2 Unit Apartments | 26 | 0.8% |
| 3 or 4 Unit Apartments | 24 | 0.7% |
| 5 to 9 Unit Apartments | 22 | 0.7% |
| 10 or more Apartments | 16 | 0.5% |
| Mobile Home / Other | 13 | 0.4% |
| Total | 3,333 | 100.0% |
Housing Structures by Occupancy in Country Club
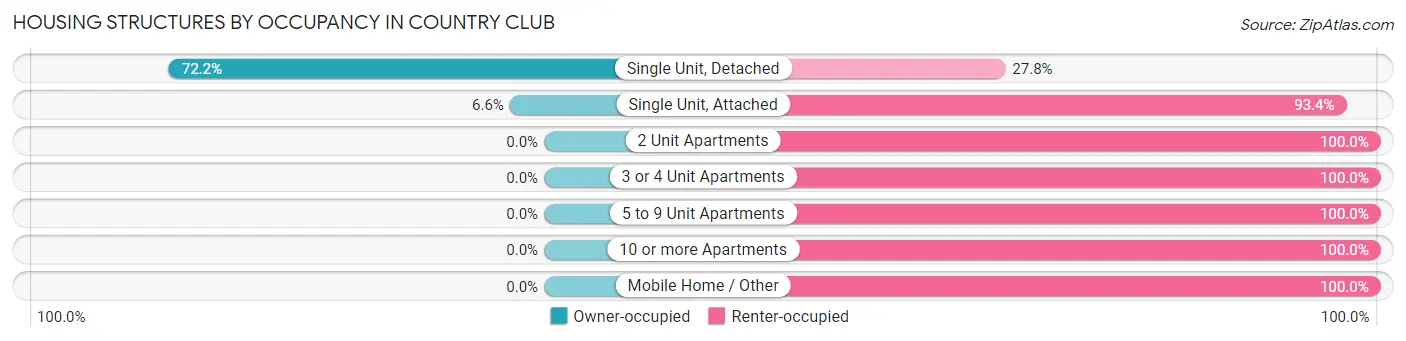
| Structure Type | Owner-occupied | Renter-occupied |
| Single Unit, Detached | 2,258 (72.2%) | 868 (27.8%) |
| Single Unit, Attached | 7 (6.6%) | 99 (93.4%) |
| 2 Unit Apartments | 0 (0.0%) | 26 (100.0%) |
| 3 or 4 Unit Apartments | 0 (0.0%) | 24 (100.0%) |
| 5 to 9 Unit Apartments | 0 (0.0%) | 22 (100.0%) |
| 10 or more Apartments | 0 (0.0%) | 16 (100.0%) |
| Mobile Home / Other | 0 (0.0%) | 13 (100.0%) |
| Total | 2,265 (68.0%) | 1,068 (32.0%) |
Housing Structures by Number of Rooms in Country Club
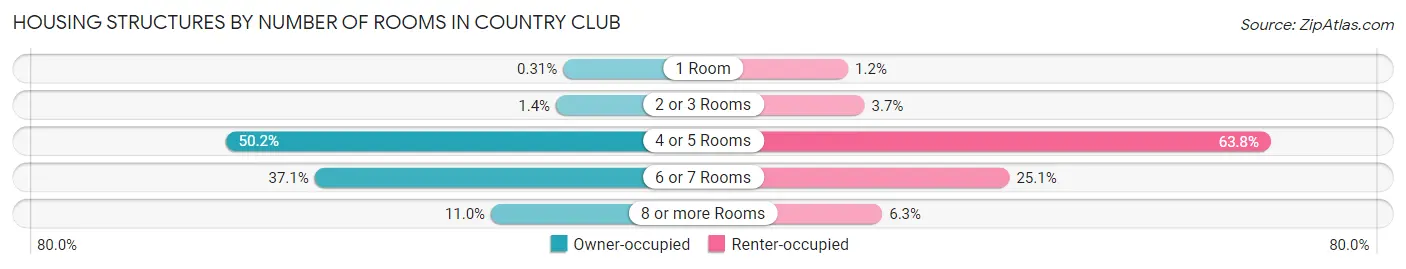
| Number of Rooms | Owner-occupied | Renter-occupied |
| 1 Room | 7 (0.3%) | 13 (1.2%) |
| 2 or 3 Rooms | 31 (1.4%) | 39 (3.6%) |
| 4 or 5 Rooms | 1,138 (50.2%) | 681 (63.8%) |
| 6 or 7 Rooms | 840 (37.1%) | 268 (25.1%) |
| 8 or more Rooms | 249 (11.0%) | 67 (6.3%) |
| Total | 2,265 (100.0%) | 1,068 (100.0%) |
Housing Structure by Heating Type in Country Club
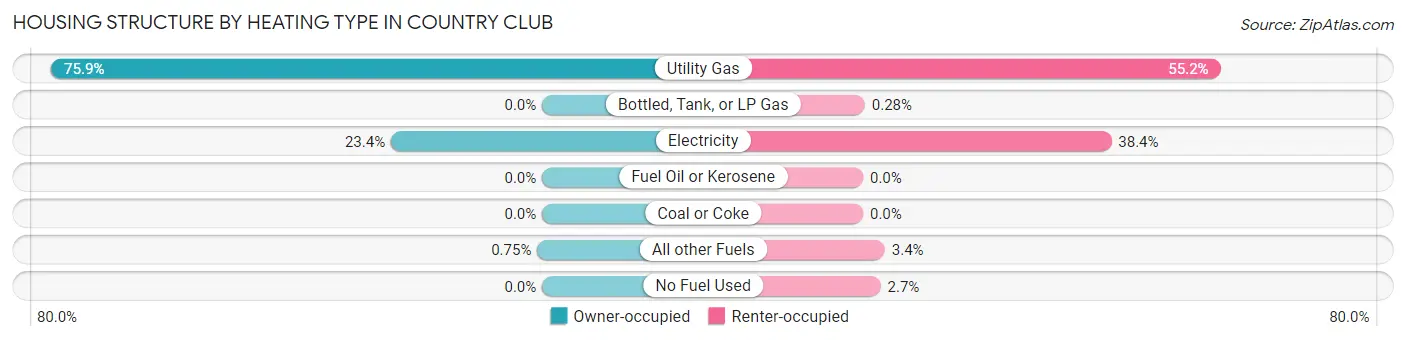
| Heating Type | Owner-occupied | Renter-occupied |
| Utility Gas | 1,719 (75.9%) | 590 (55.2%) |
| Bottled, Tank, or LP Gas | 0 (0.0%) | 3 (0.3%) |
| Electricity | 529 (23.4%) | 410 (38.4%) |
| Fuel Oil or Kerosene | 0 (0.0%) | 0 (0.0%) |
| Coal or Coke | 0 (0.0%) | 0 (0.0%) |
| All other Fuels | 17 (0.7%) | 36 (3.4%) |
| No Fuel Used | 0 (0.0%) | 29 (2.7%) |
| Total | 2,265 (100.0%) | 1,068 (100.0%) |
Household Vehicle Usage in Country Club
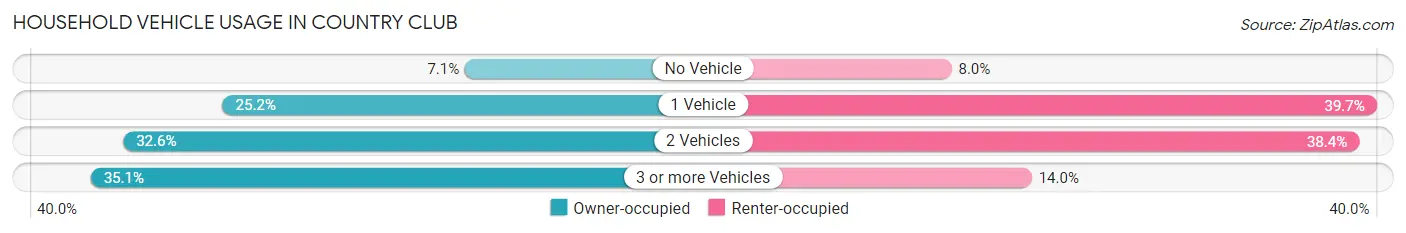
| Vehicles per Household | Owner-occupied | Renter-occupied |
| No Vehicle | 161 (7.1%) | 85 (8.0%) |
| 1 Vehicle | 571 (25.2%) | 424 (39.7%) |
| 2 Vehicles | 739 (32.6%) | 410 (38.4%) |
| 3 or more Vehicles | 794 (35.1%) | 149 (14.0%) |
| Total | 2,265 (100.0%) | 1,068 (100.0%) |
Real Estate & Mortgages in Country Club
Real Estate and Mortgage Overview in Country Club
| Characteristic | Without Mortgage | With Mortgage |
| Housing Units | 652 | 1,613 |
| Median Property Value | $314,500 | $340,500 |
| Median Household Income | $68,500 | $168 |
| Monthly Housing Costs | $541 | $167 |
| Real Estate Taxes | $2,342 | $65 |
Property Value by Mortgage Status in Country Club
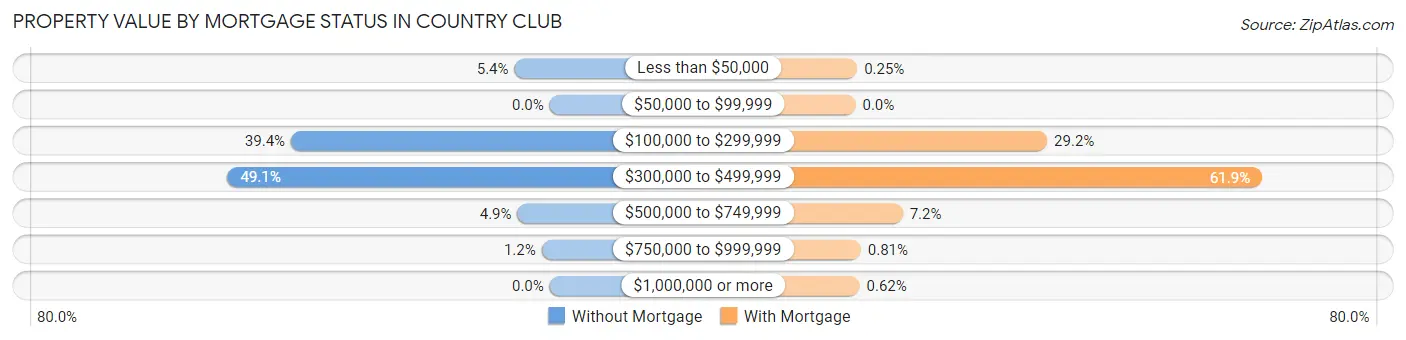
| Property Value | Without Mortgage | With Mortgage |
| Less than $50,000 | 35 (5.4%) | 4 (0.3%) |
| $50,000 to $99,999 | 0 (0.0%) | 0 (0.0%) |
| $100,000 to $299,999 | 257 (39.4%) | 471 (29.2%) |
| $300,000 to $499,999 | 320 (49.1%) | 999 (61.9%) |
| $500,000 to $749,999 | 32 (4.9%) | 116 (7.2%) |
| $750,000 to $999,999 | 8 (1.2%) | 13 (0.8%) |
| $1,000,000 or more | 0 (0.0%) | 10 (0.6%) |
| Total | 652 (100.0%) | 1,613 (100.0%) |
Household Income by Mortgage Status in Country Club
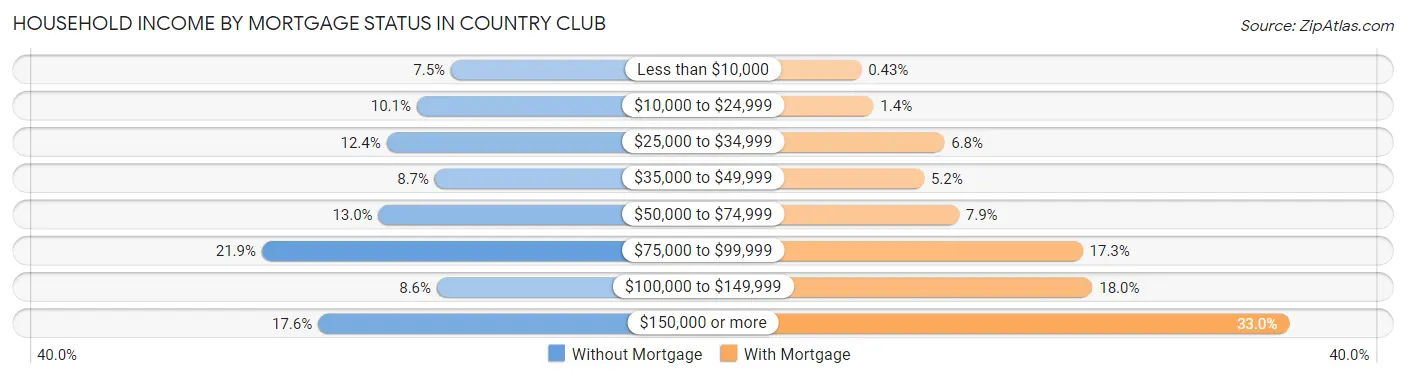
| Household Income | Without Mortgage | With Mortgage |
| Less than $10,000 | 49 (7.5%) | 7 (0.4%) |
| $10,000 to $24,999 | 66 (10.1%) | 22 (1.4%) |
| $25,000 to $34,999 | 81 (12.4%) | 109 (6.8%) |
| $35,000 to $49,999 | 57 (8.7%) | 84 (5.2%) |
| $50,000 to $74,999 | 85 (13.0%) | 127 (7.9%) |
| $75,000 to $99,999 | 143 (21.9%) | 279 (17.3%) |
| $100,000 to $149,999 | 56 (8.6%) | 291 (18.0%) |
| $150,000 or more | 115 (17.6%) | 533 (33.0%) |
| Total | 652 (100.0%) | 1,613 (100.0%) |
Property Value to Household Income Ratio in Country Club
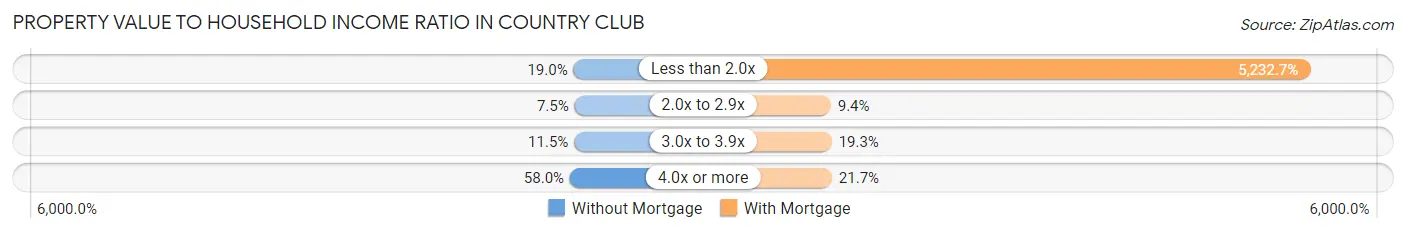
| Value-to-Income Ratio | Without Mortgage | With Mortgage |
| Less than 2.0x | 124 (19.0%) | 84,404 (5,232.7%) |
| 2.0x to 2.9x | 49 (7.5%) | 152 (9.4%) |
| 3.0x to 3.9x | 75 (11.5%) | 311 (19.3%) |
| 4.0x or more | 378 (58.0%) | 350 (21.7%) |
| Total | 652 (100.0%) | 1,613 (100.0%) |
Real Estate Taxes by Mortgage Status in Country Club
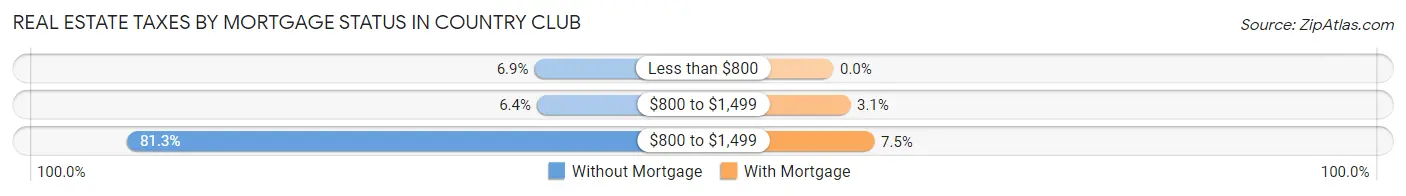
| Property Taxes | Without Mortgage | With Mortgage |
| Less than $800 | 45 (6.9%) | 0 (0.0%) |
| $800 to $1,499 | 42 (6.4%) | 50 (3.1%) |
| $800 to $1,499 | 530 (81.3%) | 121 (7.5%) |
| Total | 652 (100.0%) | 1,613 (100.0%) |
Health & Disability in Country Club
Health Insurance Coverage by Age in Country Club
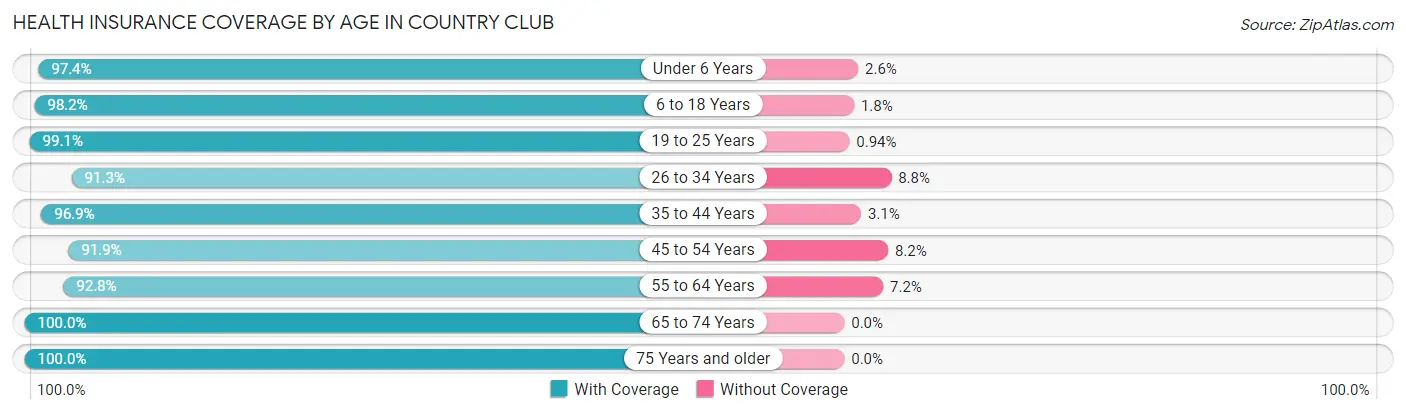
| Age Bracket | With Coverage | Without Coverage |
| Under 6 Years | 606 (97.4%) | 16 (2.6%) |
| 6 to 18 Years | 1,411 (98.2%) | 26 (1.8%) |
| 19 to 25 Years | 945 (99.1%) | 9 (0.9%) |
| 26 to 34 Years | 1,512 (91.2%) | 145 (8.7%) |
| 35 to 44 Years | 1,210 (96.9%) | 39 (3.1%) |
| 45 to 54 Years | 1,183 (91.8%) | 105 (8.2%) |
| 55 to 64 Years | 1,052 (92.8%) | 82 (7.2%) |
| 65 to 74 Years | 885 (100.0%) | 0 (0.0%) |
| 75 Years and older | 459 (100.0%) | 0 (0.0%) |
| Total | 9,263 (95.6%) | 422 (4.4%) |
Health Insurance Coverage by Citizenship Status in Country Club
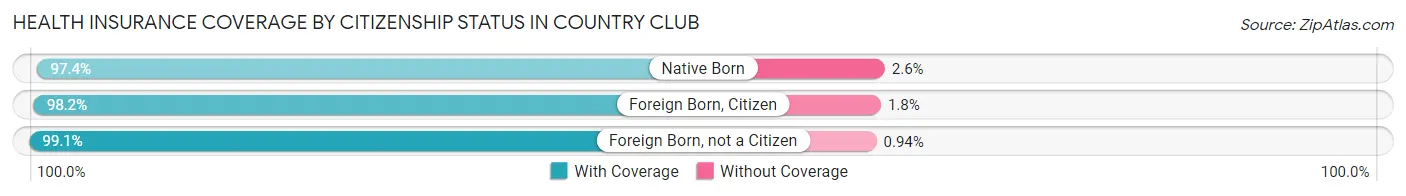
| Citizenship Status | With Coverage | Without Coverage |
| Native Born | 606 (97.4%) | 16 (2.6%) |
| Foreign Born, Citizen | 1,411 (98.2%) | 26 (1.8%) |
| Foreign Born, not a Citizen | 945 (99.1%) | 9 (0.9%) |
Health Insurance Coverage by Household Income in Country Club
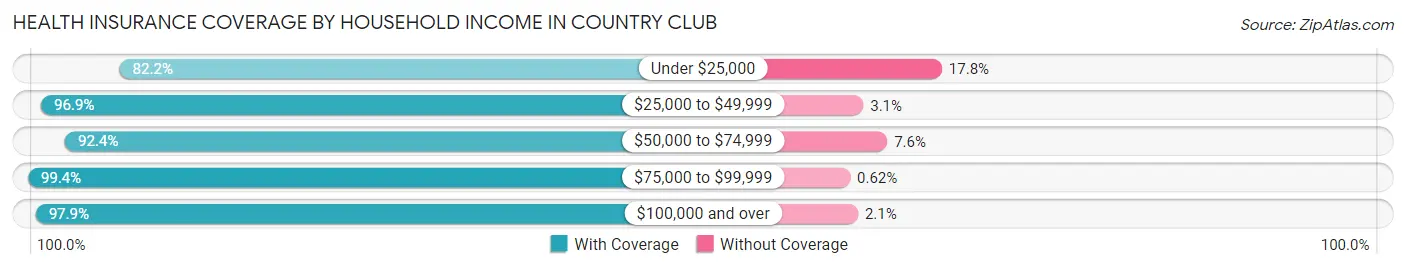
| Household Income | With Coverage | Without Coverage |
| Under $25,000 | 830 (82.2%) | 180 (17.8%) |
| $25,000 to $49,999 | 1,319 (96.9%) | 42 (3.1%) |
| $50,000 to $74,999 | 1,183 (92.4%) | 97 (7.6%) |
| $75,000 to $99,999 | 1,599 (99.4%) | 10 (0.6%) |
| $100,000 and over | 4,312 (97.9%) | 92 (2.1%) |
Public vs Private Health Insurance Coverage by Age in Country Club
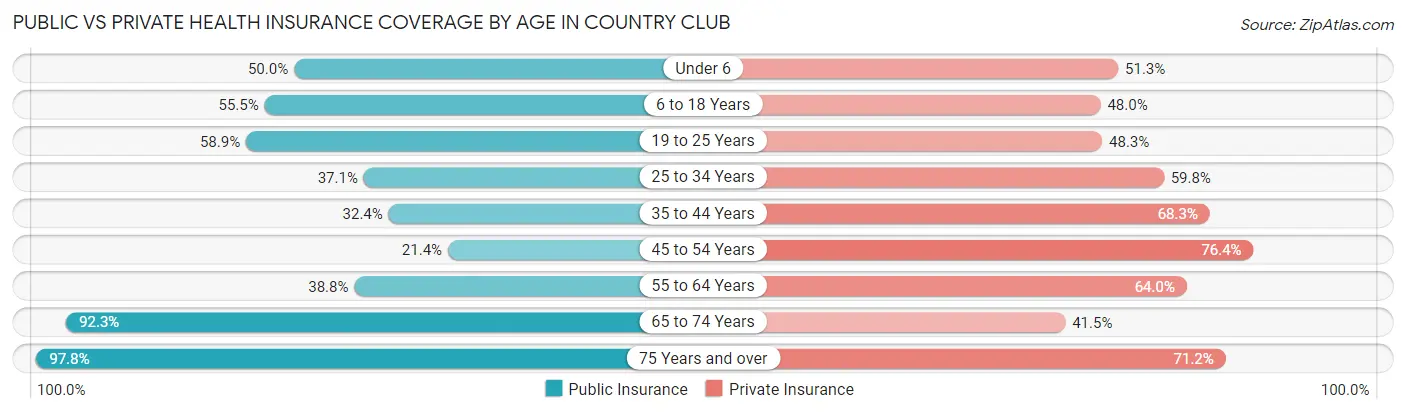
| Age Bracket | Public Insurance | Private Insurance |
| Under 6 | 311 (50.0%) | 319 (51.3%) |
| 6 to 18 Years | 797 (55.5%) | 690 (48.0%) |
| 19 to 25 Years | 562 (58.9%) | 461 (48.3%) |
| 25 to 34 Years | 614 (37.0%) | 990 (59.8%) |
| 35 to 44 Years | 405 (32.4%) | 853 (68.3%) |
| 45 to 54 Years | 276 (21.4%) | 984 (76.4%) |
| 55 to 64 Years | 440 (38.8%) | 726 (64.0%) |
| 65 to 74 Years | 817 (92.3%) | 367 (41.5%) |
| 75 Years and over | 449 (97.8%) | 327 (71.2%) |
| Total | 4,671 (48.2%) | 5,717 (59.0%) |
Disability Status by Sex by Age in Country Club
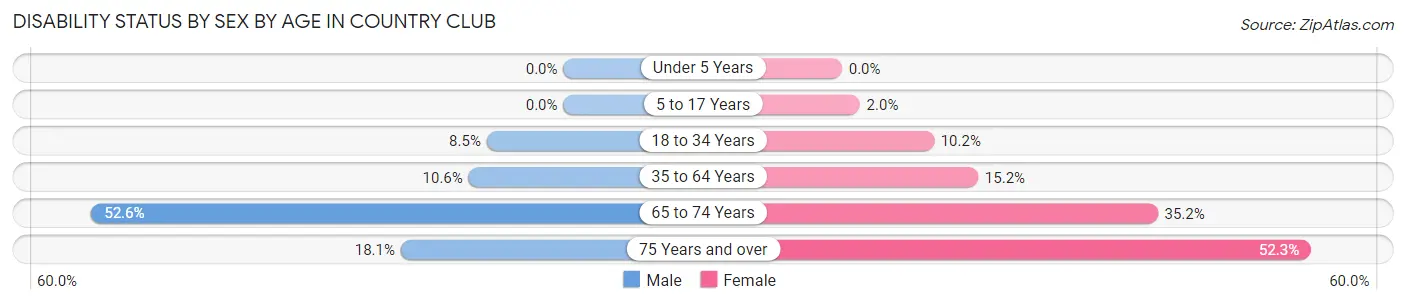
| Age Bracket | Male | Female |
| Under 5 Years | 0 (0.0%) | 0 (0.0%) |
| 5 to 17 Years | 0 (0.0%) | 11 (2.0%) |
| 18 to 34 Years | 96 (8.5%) | 160 (10.2%) |
| 35 to 64 Years | 191 (10.5%) | 282 (15.2%) |
| 65 to 74 Years | 235 (52.6%) | 154 (35.2%) |
| 75 Years and over | 19 (18.1%) | 185 (52.3%) |
Disability Class by Sex by Age in Country Club
Disability Class: Hearing Difficulty
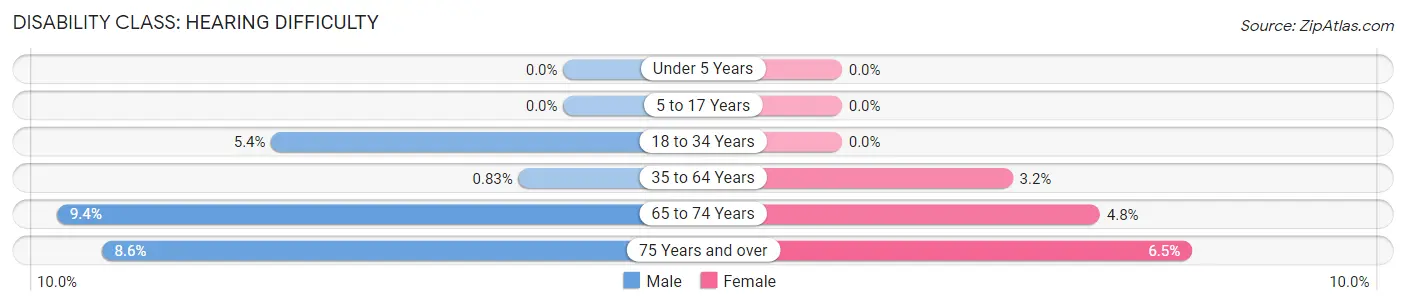
| Age Bracket | Male | Female |
| Under 5 Years | 0 (0.0%) | 0 (0.0%) |
| 5 to 17 Years | 0 (0.0%) | 0 (0.0%) |
| 18 to 34 Years | 61 (5.4%) | 0 (0.0%) |
| 35 to 64 Years | 15 (0.8%) | 59 (3.2%) |
| 65 to 74 Years | 42 (9.4%) | 21 (4.8%) |
| 75 Years and over | 9 (8.6%) | 23 (6.5%) |
Disability Class: Vision Difficulty
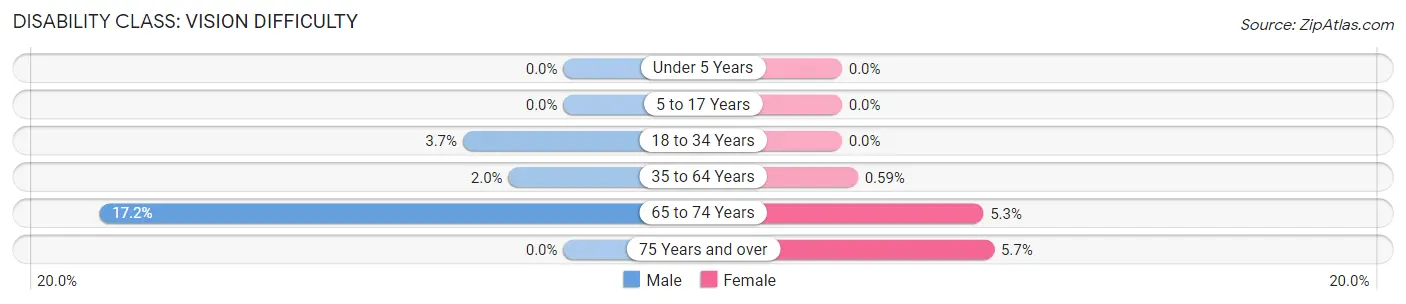
| Age Bracket | Male | Female |
| Under 5 Years | 0 (0.0%) | 0 (0.0%) |
| 5 to 17 Years | 0 (0.0%) | 0 (0.0%) |
| 18 to 34 Years | 42 (3.7%) | 0 (0.0%) |
| 35 to 64 Years | 37 (2.0%) | 11 (0.6%) |
| 65 to 74 Years | 77 (17.2%) | 23 (5.2%) |
| 75 Years and over | 0 (0.0%) | 20 (5.7%) |
Disability Class: Cognitive Difficulty
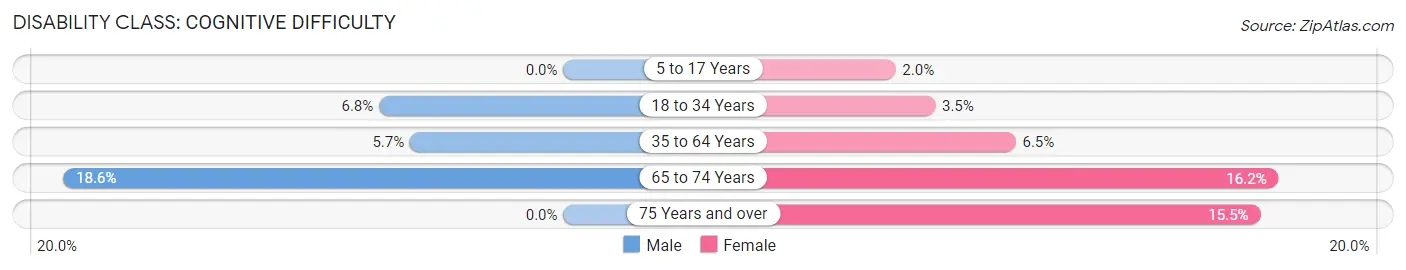
| Age Bracket | Male | Female |
| 5 to 17 Years | 0 (0.0%) | 11 (2.0%) |
| 18 to 34 Years | 77 (6.8%) | 54 (3.5%) |
| 35 to 64 Years | 103 (5.7%) | 120 (6.5%) |
| 65 to 74 Years | 83 (18.6%) | 71 (16.2%) |
| 75 Years and over | 0 (0.0%) | 55 (15.5%) |
Disability Class: Ambulatory Difficulty
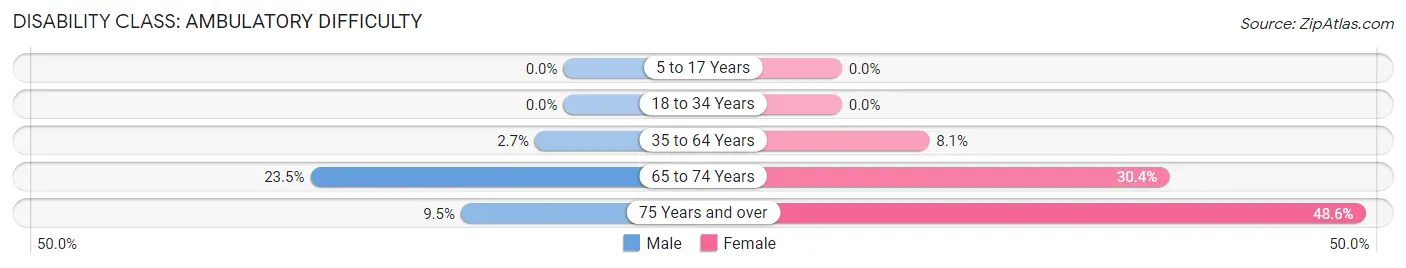
| Age Bracket | Male | Female |
| 5 to 17 Years | 0 (0.0%) | 0 (0.0%) |
| 18 to 34 Years | 0 (0.0%) | 0 (0.0%) |
| 35 to 64 Years | 48 (2.6%) | 151 (8.1%) |
| 65 to 74 Years | 105 (23.5%) | 133 (30.4%) |
| 75 Years and over | 10 (9.5%) | 172 (48.6%) |
Disability Class: Self-Care Difficulty
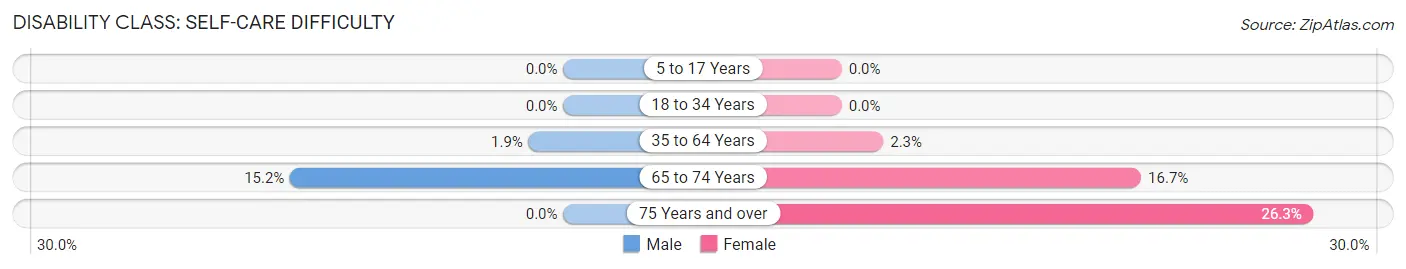
| Age Bracket | Male | Female |
| 5 to 17 Years | 0 (0.0%) | 0 (0.0%) |
| 18 to 34 Years | 0 (0.0%) | 0 (0.0%) |
| 35 to 64 Years | 35 (1.9%) | 43 (2.3%) |
| 65 to 74 Years | 68 (15.2%) | 73 (16.7%) |
| 75 Years and over | 0 (0.0%) | 93 (26.3%) |
Technology Access in Country Club
Computing Device Access in Country Club
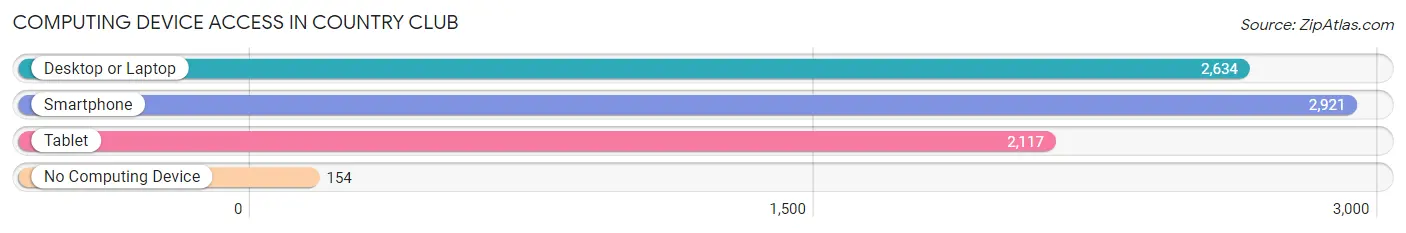
| Device Type | # Households | % Households |
| Desktop or Laptop | 2,634 | 79.0% |
| Smartphone | 2,921 | 87.6% |
| Tablet | 2,117 | 63.5% |
| No Computing Device | 154 | 4.6% |
| Total | 3,333 | 100.0% |
Internet Access in Country Club
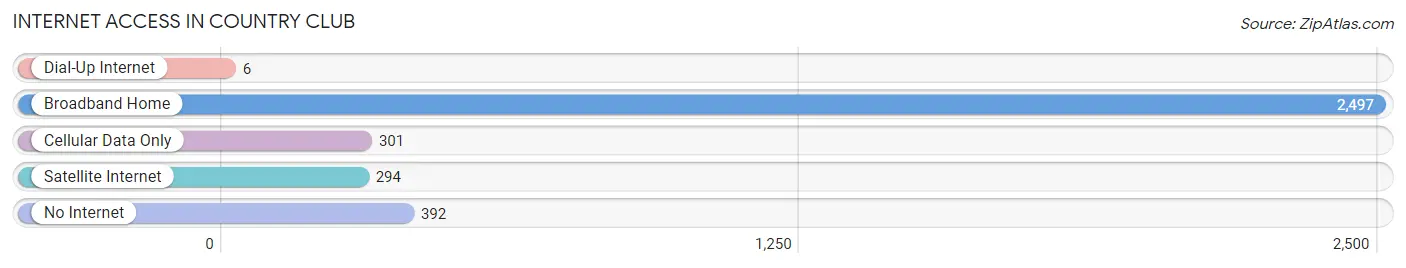
| Internet Type | # Households | % Households |
| Dial-Up Internet | 6 | 0.2% |
| Broadband Home | 2,497 | 74.9% |
| Cellular Data Only | 301 | 9.0% |
| Satellite Internet | 294 | 8.8% |
| No Internet | 392 | 11.8% |
| Total | 3,333 | 100.0% |
Country Club Summary
Club, CA is a small unincorporated community located in the San Bernardino County of California. It is situated in the foothills of the San Bernardino Mountains, approximately 10 miles east of the city of San Bernardino. The community is surrounded by the San Bernardino National Forest and is home to a population of approximately 1,000 people.
History
The area that is now known as Country Club, CA was originally inhabited by the Serrano Indians. The Serrano Indians were a peaceful tribe that lived in the area for centuries before the arrival of the Spanish in the late 1700s. The Spanish were the first Europeans to settle in the area and they established a mission in the area in 1810. The mission was named San Bernardino de Sena Estancia and it served as a base for the Spanish to explore the area and to convert the local Indians to Christianity.
In the late 1800s, the area was settled by ranchers and farmers who established small towns and villages in the area. One of these towns was called Country Club, which was established in the early 1900s. The town was named after the Country Club of San Bernardino, which was a popular golf course in the area. The town grew slowly over the years and by the 1950s, it had become a popular destination for tourists and vacationers.
Geography
Country Club, CA is located in the foothills of the San Bernardino Mountains in the San Bernardino County of California. The community is situated at an elevation of approximately 3,000 feet and is surrounded by the San Bernardino National Forest. The area is characterized by rolling hills, lush vegetation, and a variety of wildlife. The climate in the area is mild and temperate, with temperatures ranging from the low 40s in the winter to the high 80s in the summer.
Economy
The economy of Country Club, CA is largely based on tourism and recreation. The area is home to a variety of outdoor activities, including hiking, camping, fishing, and golfing. The Country Club of San Bernardino is a popular destination for golfers, and the area is also home to several other golf courses. In addition, the area is home to a variety of restaurants, shops, and other businesses that cater to tourists and vacationers.
Demographics
As of the 2010 census, the population of Country Club, CA was 1,000 people. The population is primarily white (90.2%), with the remaining population being made up of African Americans (3.2%), Asians (2.2%), and other races (4.4%). The median household income in the area is $50,000, and the median age is 40 years old. The area is also home to a variety of religious denominations, including Catholic, Protestant, and Mormon.
Common Questions
What is Per Capita Income in Country Club?
Per Capita income in Country Club is $32,480.
What is the Median Family Income in Country Club?
Median Family Income in Country Club is $80,735.
What is the Median Household income in Country Club?
Median Household Income in Country Club is $76,758.
What is Income or Wage Gap in Country Club?
Income or Wage Gap in Country Club is 26.3%.
Women in Country Club earn 73.7 cents for every dollar earned by a man.
What is Inequality or Gini Index in Country Club?
Inequality or Gini Index in Country Club is 0.42.
What is the Total Population of Country Club?
Total Population of Country Club is 9,686.
What is the Total Male Population of Country Club?
Total Male Population of Country Club is 4,636.
What is the Total Female Population of Country Club?
Total Female Population of Country Club is 5,050.
What is the Ratio of Males per 100 Females in Country Club?
There are 91.80 Males per 100 Females in Country Club.
What is the Ratio of Females per 100 Males in Country Club?
There are 108.93 Females per 100 Males in Country Club.
What is the Median Population Age in Country Club?
Median Population Age in Country Club is 36.2 Years.
What is the Average Family Size in Country Club
Average Family Size in Country Club is 3.4 People.
What is the Average Household Size in Country Club
Average Household Size in Country Club is 2.9 People.
How Large is the Labor Force in Country Club?
There are 4,602 People in the Labor Forcein in Country Club.
What is the Percentage of People in the Labor Force in Country Club?
58.8% of People are in the Labor Force in Country Club.
What is the Unemployment Rate in Country Club?
Unemployment Rate in Country Club is 8.1%.