Cities with the Highest Percentage of African Population in Kansas
RELATED REPORTS & OPTIONS
African
Kansas
Compare Cities
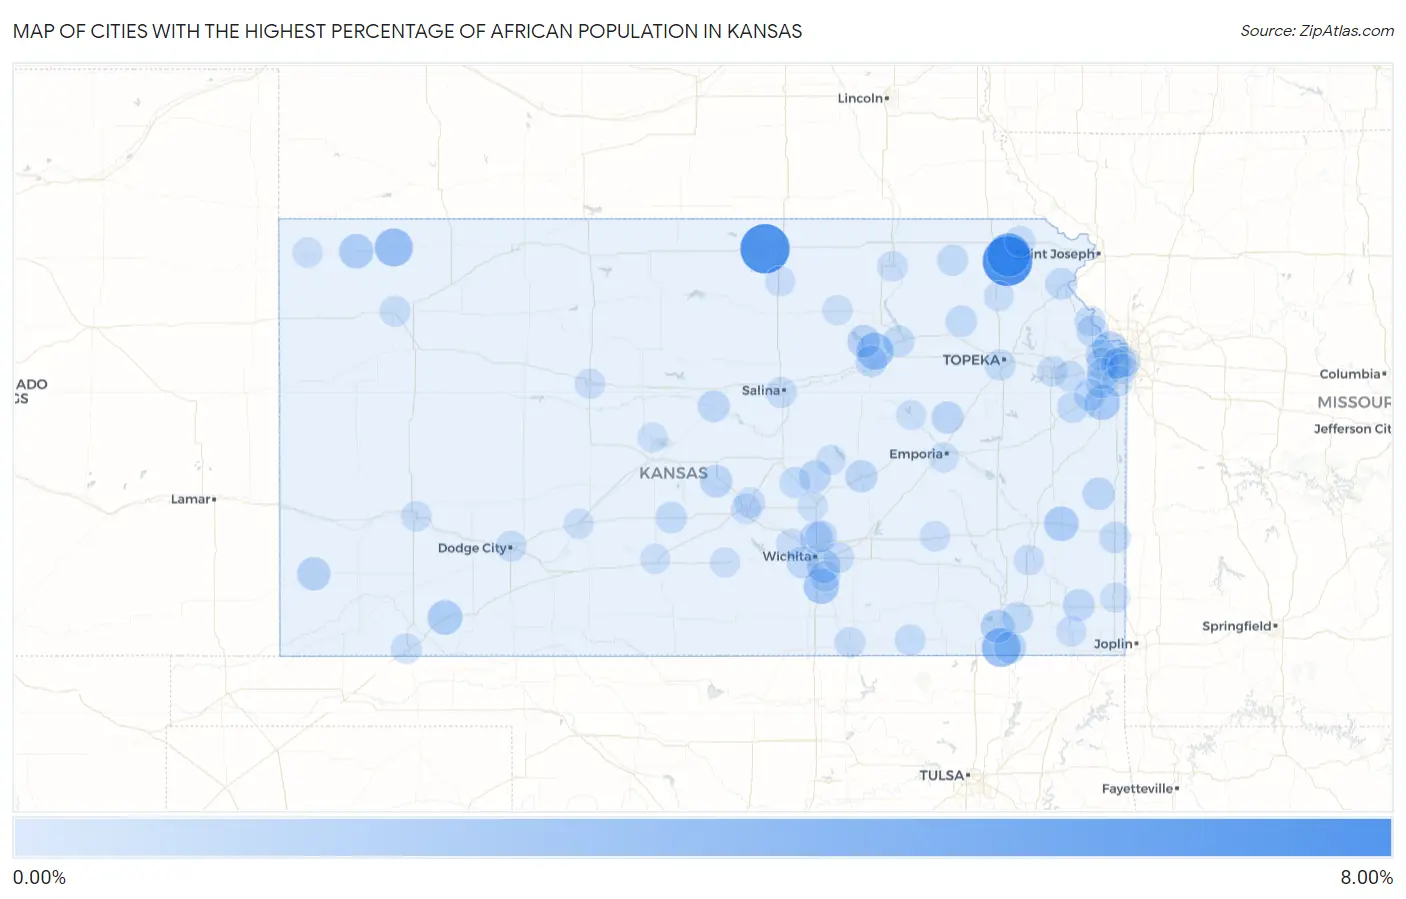
Map of Cities with the Highest Percentage of African Population in Kansas
0.00%
8.00%
Cities with the Highest Percentage of African Population in Kansas
| City | African | vs State | vs National | |
| 1. | Kickapoo Site 1 | 7.37% | 0.38%(+6.99)#1 | 0.57%(+6.80)#181 |
| 2. | Scandia | 7.25% | 0.38%(+6.87)#2 | 0.57%(+6.68)#184 |
| 3. | Powhattan | 4.94% | 0.38%(+4.56)#3 | 0.57%(+4.37)#331 |
| 4. | Dearing | 3.23% | 0.38%(+2.86)#4 | 0.57%(+2.67)#557 |
| 5. | Atwood | 2.91% | 0.38%(+2.53)#5 | 0.57%(+2.34)#654 |
| 6. | Fort Riley | 2.46% | 0.38%(+2.08)#6 | 0.57%(+1.89)#808 |
| 7. | Mulvane | 1.93% | 0.38%(+1.56)#7 | 0.57%(+1.37)#1,070 |
| 8. | Spring Hill | 1.84% | 0.38%(+1.46)#8 | 0.57%(+1.27)#1,126 |
| 9. | Plains | 1.66% | 0.38%(+1.28)#9 | 0.57%(+1.09)#1,263 |
| 10. | Moran | 1.65% | 0.38%(+1.27)#10 | 0.57%(+1.08)#1,277 |
| 11. | Kansas City | 1.63% | 0.38%(+1.26)#11 | 0.57%(+1.07)#1,297 |
| 12. | Mcdonald | 1.56% | 0.38%(+1.19)#12 | 0.57%(+0.997)#1,354 |
| 13. | Mcconnell Afb | 1.18% | 0.38%(+0.804)#13 | 0.57%(+0.616)#1,833 |
| 14. | Independence | 1.18% | 0.38%(+0.803)#14 | 0.57%(+0.615)#1,835 |
| 15. | Johnson City | 1.14% | 0.38%(+0.761)#15 | 0.57%(+0.573)#1,896 |
| 16. | Milford | 0.95% | 0.38%(+0.572)#16 | 0.57%(+0.384)#2,237 |
| 17. | Park City | 0.90% | 0.38%(+0.519)#17 | 0.57%(+0.330)#2,354 |
| 18. | Sterling | 0.84% | 0.38%(+0.460)#18 | 0.57%(+0.272)#2,487 |
| 19. | Mound City | 0.82% | 0.38%(+0.446)#19 | 0.57%(+0.258)#2,524 |
| 20. | Florence | 0.79% | 0.38%(+0.409)#20 | 0.57%(+0.220)#2,628 |
| 21. | Allen | 0.77% | 0.38%(+0.392)#21 | 0.57%(+0.204)#2,682 |
| 22. | Coffeyville | 0.77% | 0.38%(+0.392)#22 | 0.57%(+0.204)#2,683 |
| 23. | Shawnee | 0.73% | 0.38%(+0.357)#23 | 0.57%(+0.169)#2,783 |
| 24. | Goessel | 0.73% | 0.38%(+0.357)#24 | 0.57%(+0.169)#2,786 |
| 25. | Ellsworth | 0.68% | 0.38%(+0.304)#25 | 0.57%(+0.116)#2,941 |
| 26. | Wichita | 0.68% | 0.38%(+0.302)#26 | 0.57%(+0.114)#2,947 |
| 27. | Kechi | 0.68% | 0.38%(+0.301)#27 | 0.57%(+0.113)#2,950 |
| 28. | Mccune | 0.67% | 0.38%(+0.296)#28 | 0.57%(+0.108)#2,965 |
| 29. | Mission | 0.65% | 0.38%(+0.270)#29 | 0.57%(+0.081)#3,057 |
| 30. | Gardner | 0.63% | 0.38%(+0.257)#30 | 0.57%(+0.069)#3,105 |
| 31. | Lansing | 0.62% | 0.38%(+0.245)#31 | 0.57%(+0.057)#3,145 |
| 32. | Atchison | 0.57% | 0.38%(+0.195)#32 | 0.57%(+0.007)#3,346 |
| 33. | Junction City | 0.57% | 0.38%(+0.190)#33 | 0.57%(+0.002)#3,362 |
| 34. | Fort Scott | 0.55% | 0.38%(+0.178)#34 | 0.57%(-0.010)#3,419 |
| 35. | Stafford | 0.55% | 0.38%(+0.174)#35 | 0.57%(-0.014)#3,430 |
| 36. | Emmett | 0.55% | 0.38%(+0.172)#36 | 0.57%(-0.016)#3,438 |
| 37. | Olathe | 0.55% | 0.38%(+0.169)#37 | 0.57%(-0.019)#3,452 |
| 38. | Manhattan | 0.52% | 0.38%(+0.144)#38 | 0.57%(-0.044)#3,546 |
| 39. | Cherryvale | 0.48% | 0.38%(+0.098)#39 | 0.57%(-0.090)#3,753 |
| 40. | Edwardsville | 0.46% | 0.38%(+0.087)#40 | 0.57%(-0.102)#3,830 |
| 41. | Centralia | 0.45% | 0.38%(+0.076)#41 | 0.57%(-0.112)#3,872 |
| 42. | Lenexa | 0.41% | 0.38%(+0.030)#42 | 0.57%(-0.158)#4,122 |
| 43. | Topeka | 0.39% | 0.38%(+0.014)#43 | 0.57%(-0.175)#4,196 |
| 44. | Moundridge | 0.38% | 0.38%(+0.000)#44 | 0.57%(-0.188)#4,268 |
| 45. | Wellsville | 0.35% | 0.38%(-0.031)#45 | 0.57%(-0.219)#4,430 |
| 46. | Cedar Vale | 0.34% | 0.38%(-0.040)#46 | 0.57%(-0.228)#4,496 |
| 47. | Westwood | 0.33% | 0.38%(-0.049)#47 | 0.57%(-0.237)#4,539 |
| 48. | Colby | 0.31% | 0.38%(-0.063)#48 | 0.57%(-0.251)#4,620 |
| 49. | Overland Park | 0.31% | 0.38%(-0.066)#49 | 0.57%(-0.254)#4,634 |
| 50. | Derby | 0.30% | 0.38%(-0.080)#50 | 0.57%(-0.268)#4,719 |
| 51. | Hiawatha | 0.28% | 0.38%(-0.100)#51 | 0.57%(-0.288)#4,857 |
| 52. | Dodge City | 0.27% | 0.38%(-0.107)#52 | 0.57%(-0.295)#4,902 |
| 53. | Salina | 0.25% | 0.38%(-0.125)#53 | 0.57%(-0.313)#5,036 |
| 54. | Arkansas City | 0.25% | 0.38%(-0.127)#54 | 0.57%(-0.315)#5,060 |
| 55. | Eudora | 0.25% | 0.38%(-0.128)#55 | 0.57%(-0.316)#5,067 |
| 56. | Andover | 0.25% | 0.38%(-0.131)#56 | 0.57%(-0.320)#5,093 |
| 57. | Leavenworth | 0.24% | 0.38%(-0.135)#57 | 0.57%(-0.323)#5,118 |
| 58. | Merriam | 0.23% | 0.38%(-0.142)#58 | 0.57%(-0.330)#5,178 |
| 59. | Liberal | 0.23% | 0.38%(-0.152)#59 | 0.57%(-0.340)#5,268 |
| 60. | Lawrence | 0.20% | 0.38%(-0.177)#60 | 0.57%(-0.366)#5,463 |
| 61. | Hutchinson | 0.19% | 0.38%(-0.187)#61 | 0.57%(-0.375)#5,540 |
| 62. | Blue Rapids | 0.19% | 0.38%(-0.191)#62 | 0.57%(-0.379)#5,577 |
| 63. | Eureka | 0.18% | 0.38%(-0.199)#63 | 0.57%(-0.387)#5,650 |
| 64. | South Hutchinson | 0.18% | 0.38%(-0.200)#64 | 0.57%(-0.388)#5,663 |
| 65. | Chanute | 0.17% | 0.38%(-0.205)#65 | 0.57%(-0.393)#5,707 |
| 66. | Oswego | 0.17% | 0.38%(-0.210)#66 | 0.57%(-0.398)#5,750 |
| 67. | Garden City | 0.16% | 0.38%(-0.220)#67 | 0.57%(-0.408)#5,835 |
| 68. | Colwich | 0.13% | 0.38%(-0.245)#68 | 0.57%(-0.433)#6,055 |
| 69. | Holton | 0.089% | 0.38%(-0.289)#69 | 0.57%(-0.477)#6,485 |
| 70. | St Francis | 0.081% | 0.38%(-0.296)#70 | 0.57%(-0.484)#6,559 |
| 71. | Hays | 0.081% | 0.38%(-0.297)#71 | 0.57%(-0.485)#6,564 |
| 72. | Concordia | 0.079% | 0.38%(-0.298)#72 | 0.57%(-0.487)#6,578 |
| 73. | Prairie Village | 0.074% | 0.38%(-0.303)#73 | 0.57%(-0.491)#6,613 |
| 74. | Kinsley | 0.073% | 0.38%(-0.304)#74 | 0.57%(-0.492)#6,627 |
| 75. | Clay Center | 0.072% | 0.38%(-0.305)#75 | 0.57%(-0.493)#6,639 |
| 76. | Newton | 0.049% | 0.38%(-0.329)#76 | 0.57%(-0.517)#6,859 |
| 77. | Council Grove | 0.041% | 0.38%(-0.336)#77 | 0.57%(-0.525)#6,923 |
| 78. | Hoisington | 0.037% | 0.38%(-0.340)#78 | 0.57%(-0.528)#6,953 |
| 79. | Hillsboro | 0.036% | 0.38%(-0.341)#79 | 0.57%(-0.529)#6,963 |
| 80. | Kingman | 0.033% | 0.38%(-0.344)#80 | 0.57%(-0.533)#7,005 |
| 81. | Pittsburg | 0.024% | 0.38%(-0.353)#81 | 0.57%(-0.541)#7,082 |
| 82. | Emporia | 0.017% | 0.38%(-0.361)#82 | 0.57%(-0.549)#7,150 |
| 83. | Pratt | 0.015% | 0.38%(-0.362)#83 | 0.57%(-0.550)#7,157 |
Common Questions
What are the Top 10 Cities with the Highest Percentage of African Population in Kansas?
Top 10 Cities with the Highest Percentage of African Population in Kansas are:
#1
7.37%
#2
7.25%
#3
4.94%
#4
3.23%
#5
2.91%
#6
2.46%
#7
1.93%
#8
1.84%
#9
1.66%
#10
1.65%
What city has the Highest Percentage of African Population in Kansas?
Kickapoo Site 1 has the Highest Percentage of African Population in Kansas with 7.37%.
What is the Percentage of African Population in the State of Kansas?
Percentage of African Population in Kansas is 0.38%.
What is the Percentage of African Population in the United States?
Percentage of African Population in the United States is 0.57%.