Cities with the Highest Percentage of African Population in Missouri
RELATED REPORTS & OPTIONS
African
Missouri
Compare Cities
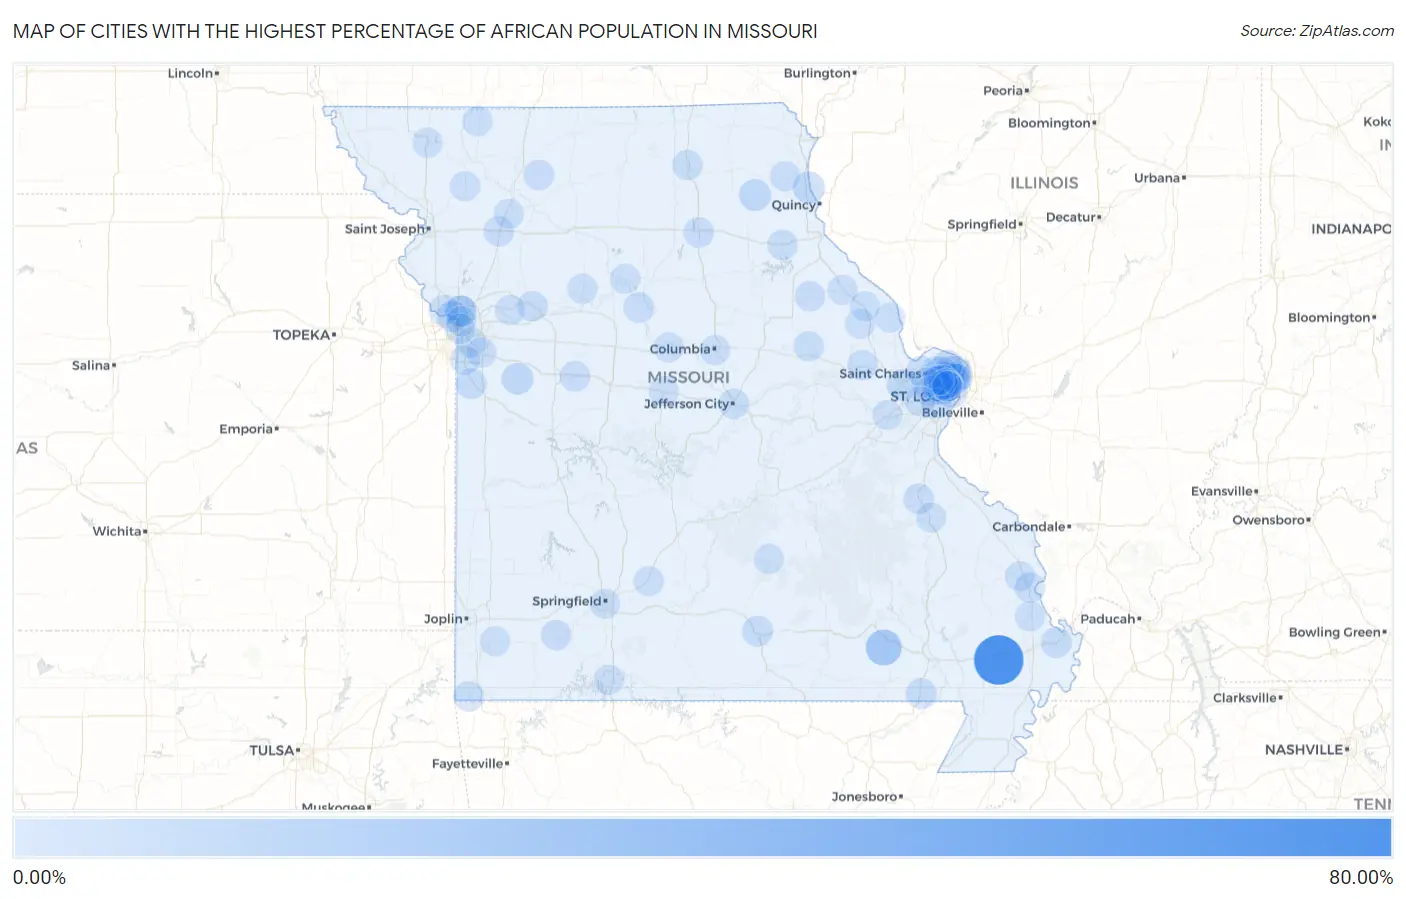
Map of Cities with the Highest Percentage of African Population in Missouri
0.00%
80.00%
Cities with the Highest Percentage of African Population in Missouri
| City | African | vs State | vs National | |
| 1. | Penermon | 68.60% | 0.39%(+68.2)#1 | 0.57%(+68.0)#3 |
| 2. | Hunter | 19.42% | 0.39%(+19.0)#2 | 0.57%(+18.9)#37 |
| 3. | Blue Summit | 10.49% | 0.39%(+10.1)#3 | 0.57%(+9.92)#97 |
| 4. | Newark | 6.25% | 0.39%(+5.86)#4 | 0.57%(+5.68)#228 |
| 5. | Kingsville | 5.84% | 0.39%(+5.44)#5 | 0.57%(+5.27)#254 |
| 6. | La Grange | 5.63% | 0.39%(+5.24)#6 | 0.57%(+5.06)#270 |
| 7. | Oakwood Park | 5.18% | 0.39%(+4.79)#7 | 0.57%(+4.61)#305 |
| 8. | Weldon Spring Heights | 4.83% | 0.39%(+4.44)#8 | 0.57%(+4.26)#336 |
| 9. | Moline Acres | 4.19% | 0.39%(+3.80)#9 | 0.57%(+3.63)#412 |
| 10. | Riverside | 3.83% | 0.39%(+3.44)#10 | 0.57%(+3.27)#454 |
| 11. | Willow Springs | 3.20% | 0.39%(+2.81)#11 | 0.57%(+2.63)#567 |
| 12. | Berkeley | 3.04% | 0.39%(+2.64)#12 | 0.57%(+2.47)#614 |
| 13. | Charleston | 2.88% | 0.39%(+2.49)#13 | 0.57%(+2.32)#660 |
| 14. | Gladstone | 2.69% | 0.39%(+2.30)#14 | 0.57%(+2.13)#717 |
| 15. | Ferguson | 2.63% | 0.39%(+2.24)#15 | 0.57%(+2.07)#737 |
| 16. | Dellwood | 2.53% | 0.39%(+2.14)#16 | 0.57%(+1.97)#776 |
| 17. | Peculiar | 2.47% | 0.39%(+2.07)#17 | 0.57%(+1.90)#802 |
| 18. | Bellefontaine Neighbors | 2.38% | 0.39%(+1.99)#18 | 0.57%(+1.81)#831 |
| 19. | Neelyville | 2.36% | 0.39%(+1.96)#19 | 0.57%(+1.79)#839 |
| 20. | Spanish Lake | 2.34% | 0.39%(+1.95)#20 | 0.57%(+1.77)#847 |
| 21. | Breckenridge Hills | 2.16% | 0.39%(+1.76)#21 | 0.57%(+1.59)#940 |
| 22. | Pasadena Park | 2.05% | 0.39%(+1.66)#22 | 0.57%(+1.49)#992 |
| 23. | Cool Valley | 2.04% | 0.39%(+1.65)#23 | 0.57%(+1.48)#997 |
| 24. | Knob Noster | 2.04% | 0.39%(+1.65)#24 | 0.57%(+1.48)#998 |
| 25. | Gilliam | 2.02% | 0.39%(+1.63)#25 | 0.57%(+1.45)#1,012 |
| 26. | Cameron | 2.00% | 0.39%(+1.61)#26 | 0.57%(+1.43)#1,030 |
| 27. | Wright City | 1.99% | 0.39%(+1.60)#27 | 0.57%(+1.42)#1,034 |
| 28. | Henrietta | 1.69% | 0.39%(+1.30)#28 | 0.57%(+1.13)#1,232 |
| 29. | Bonne Terre | 1.68% | 0.39%(+1.28)#29 | 0.57%(+1.11)#1,246 |
| 30. | Castle Point | 1.60% | 0.39%(+1.21)#30 | 0.57%(+1.03)#1,326 |
| 31. | Norwood Court | 1.57% | 0.39%(+1.17)#31 | 0.57%(+1.00)#1,349 |
| 32. | Cape Girardeau | 1.54% | 0.39%(+1.15)#32 | 0.57%(+0.975)#1,368 |
| 33. | Kirksville | 1.50% | 0.39%(+1.11)#33 | 0.57%(+0.935)#1,406 |
| 34. | Macon | 1.49% | 0.39%(+1.09)#34 | 0.57%(+0.920)#1,428 |
| 35. | Gilman City | 1.46% | 0.39%(+1.06)#35 | 0.57%(+0.891)#1,469 |
| 36. | Velda City | 1.44% | 0.39%(+1.04)#36 | 0.57%(+0.870)#1,492 |
| 37. | Aurora | 1.37% | 0.39%(+0.980)#37 | 0.57%(+0.806)#1,573 |
| 38. | Olivette | 1.36% | 0.39%(+0.972)#38 | 0.57%(+0.799)#1,586 |
| 39. | Jennings | 1.28% | 0.39%(+0.885)#39 | 0.57%(+0.712)#1,711 |
| 40. | Noel | 1.24% | 0.39%(+0.851)#40 | 0.57%(+0.678)#1,756 |
| 41. | Vinita Park | 1.24% | 0.39%(+0.846)#41 | 0.57%(+0.673)#1,764 |
| 42. | Monroe City | 1.23% | 0.39%(+0.836)#42 | 0.57%(+0.663)#1,777 |
| 43. | Black Jack | 1.18% | 0.39%(+0.784)#43 | 0.57%(+0.611)#1,841 |
| 44. | Calverton Park | 1.16% | 0.39%(+0.766)#44 | 0.57%(+0.593)#1,867 |
| 45. | Glasgow Village | 1.15% | 0.39%(+0.757)#45 | 0.57%(+0.584)#1,884 |
| 46. | Jefferson City | 1.14% | 0.39%(+0.750)#46 | 0.57%(+0.577)#1,891 |
| 47. | University City | 1.11% | 0.39%(+0.721)#47 | 0.57%(+0.548)#1,947 |
| 48. | Northwoods | 1.11% | 0.39%(+0.716)#48 | 0.57%(+0.543)#1,957 |
| 49. | Florissant | 1.08% | 0.39%(+0.693)#49 | 0.57%(+0.520)#1,990 |
| 50. | St Louis | 1.08% | 0.39%(+0.687)#50 | 0.57%(+0.514)#1,999 |
| 51. | Montgomery City | 1.03% | 0.39%(+0.637)#51 | 0.57%(+0.464)#2,086 |
| 52. | Vandalia | 1.01% | 0.39%(+0.613)#52 | 0.57%(+0.440)#2,120 |
| 53. | Riverview | 1.00% | 0.39%(+0.604)#53 | 0.57%(+0.431)#2,145 |
| 54. | Pagedale | 0.96% | 0.39%(+0.572)#54 | 0.57%(+0.399)#2,205 |
| 55. | Old Jamestown | 0.96% | 0.39%(+0.564)#55 | 0.57%(+0.391)#2,222 |
| 56. | Silex | 0.96% | 0.39%(+0.563)#56 | 0.57%(+0.390)#2,224 |
| 57. | Kansas City | 0.93% | 0.39%(+0.541)#57 | 0.57%(+0.368)#2,272 |
| 58. | Hazelwood | 0.90% | 0.39%(+0.507)#58 | 0.57%(+0.334)#2,349 |
| 59. | Orrick | 0.89% | 0.39%(+0.496)#59 | 0.57%(+0.323)#2,366 |
| 60. | Marshfield | 0.88% | 0.39%(+0.488)#60 | 0.57%(+0.315)#2,381 |
| 61. | Pasadena Hills | 0.86% | 0.39%(+0.473)#61 | 0.57%(+0.299)#2,423 |
| 62. | Normandy | 0.86% | 0.39%(+0.468)#62 | 0.57%(+0.295)#2,433 |
| 63. | Uplands Park | 0.82% | 0.39%(+0.432)#63 | 0.57%(+0.259)#2,518 |
| 64. | Granby | 0.79% | 0.39%(+0.399)#64 | 0.57%(+0.226)#2,614 |
| 65. | King City | 0.78% | 0.39%(+0.388)#65 | 0.57%(+0.215)#2,645 |
| 66. | St Ann | 0.77% | 0.39%(+0.382)#66 | 0.57%(+0.209)#2,666 |
| 67. | Overland | 0.77% | 0.39%(+0.378)#67 | 0.57%(+0.205)#2,677 |
| 68. | Benton | 0.77% | 0.39%(+0.374)#68 | 0.57%(+0.201)#2,692 |
| 69. | Creve Coeur | 0.74% | 0.39%(+0.347)#69 | 0.57%(+0.173)#2,772 |
| 70. | Elsberry | 0.71% | 0.39%(+0.317)#70 | 0.57%(+0.143)#2,861 |
| 71. | Raytown | 0.71% | 0.39%(+0.317)#71 | 0.57%(+0.143)#2,863 |
| 72. | Kinloch | 0.69% | 0.39%(+0.295)#72 | 0.57%(+0.122)#2,926 |
| 73. | Parkville | 0.68% | 0.39%(+0.286)#73 | 0.57%(+0.113)#2,951 |
| 74. | Monticello | 0.65% | 0.39%(+0.255)#74 | 0.57%(+0.082)#3,056 |
| 75. | Licking | 0.65% | 0.39%(+0.254)#75 | 0.57%(+0.081)#3,058 |
| 76. | Carrollton | 0.64% | 0.39%(+0.245)#76 | 0.57%(+0.072)#3,097 |
| 77. | Oakland | 0.61% | 0.39%(+0.220)#77 | 0.57%(+0.047)#3,189 |
| 78. | Branson | 0.58% | 0.39%(+0.193)#78 | 0.57%(+0.020)#3,292 |
| 79. | Lee S Summit | 0.58% | 0.39%(+0.189)#79 | 0.57%(+0.016)#3,307 |
| 80. | St Charles | 0.57% | 0.39%(+0.174)#80 | 0.57%(+0.001)#3,375 |
| 81. | Winston | 0.56% | 0.39%(+0.173)#81 | 0.57%(-0.000)#3,379 |
| 82. | Bowling Green | 0.55% | 0.39%(+0.162)#82 | 0.57%(-0.011)#3,421 |
| 83. | Tipton | 0.55% | 0.39%(+0.156)#83 | 0.57%(-0.018)#3,448 |
| 84. | Farmington | 0.53% | 0.39%(+0.140)#84 | 0.57%(-0.033)#3,500 |
| 85. | Grandview | 0.52% | 0.39%(+0.133)#85 | 0.57%(-0.041)#3,532 |
| 86. | Maryland Heights | 0.52% | 0.39%(+0.127)#86 | 0.57%(-0.046)#3,553 |
| 87. | Gray Summit | 0.51% | 0.39%(+0.113)#87 | 0.57%(-0.060)#3,616 |
| 88. | Grant City | 0.50% | 0.39%(+0.106)#88 | 0.57%(-0.067)#3,645 |
| 89. | North Kansas City | 0.48% | 0.39%(+0.091)#89 | 0.57%(-0.082)#3,719 |
| 90. | Brunswick | 0.47% | 0.39%(+0.075)#90 | 0.57%(-0.098)#3,807 |
| 91. | Eolia | 0.45% | 0.39%(+0.062)#91 | 0.57%(-0.111)#3,867 |
| 92. | Springfield | 0.45% | 0.39%(+0.058)#92 | 0.57%(-0.115)#3,888 |
| 93. | Bel Nor | 0.44% | 0.39%(+0.053)#93 | 0.57%(-0.121)#3,915 |
| 94. | Columbia | 0.43% | 0.39%(+0.036)#94 | 0.57%(-0.137)#4,011 |
| 95. | Boonville | 0.43% | 0.39%(+0.035)#95 | 0.57%(-0.138)#4,015 |
| 96. | Beverly Hills | 0.43% | 0.39%(+0.034)#96 | 0.57%(-0.139)#4,020 |
| 97. | Maryville | 0.42% | 0.39%(+0.029)#97 | 0.57%(-0.144)#4,051 |
| 98. | Jackson | 0.42% | 0.39%(+0.024)#98 | 0.57%(-0.150)#4,077 |
| 99. | Edmundson | 0.41% | 0.39%(+0.016)#99 | 0.57%(-0.157)#4,113 |
| 100. | Winchester | 0.40% | 0.39%(+0.013)#100 | 0.57%(-0.161)#4,131 |
Common Questions
What are the Top 10 Cities with the Highest Percentage of African Population in Missouri?
Top 10 Cities with the Highest Percentage of African Population in Missouri are:
#1
68.60%
#2
19.42%
#3
6.25%
#4
5.84%
#5
5.63%
#6
5.18%
#7
4.83%
#8
4.19%
#9
3.83%
#10
3.20%
What city has the Highest Percentage of African Population in Missouri?
Penermon has the Highest Percentage of African Population in Missouri with 68.60%.
What is the Percentage of African Population in the State of Missouri?
Percentage of African Population in Missouri is 0.39%.
What is the Percentage of African Population in the United States?
Percentage of African Population in the United States is 0.57%.