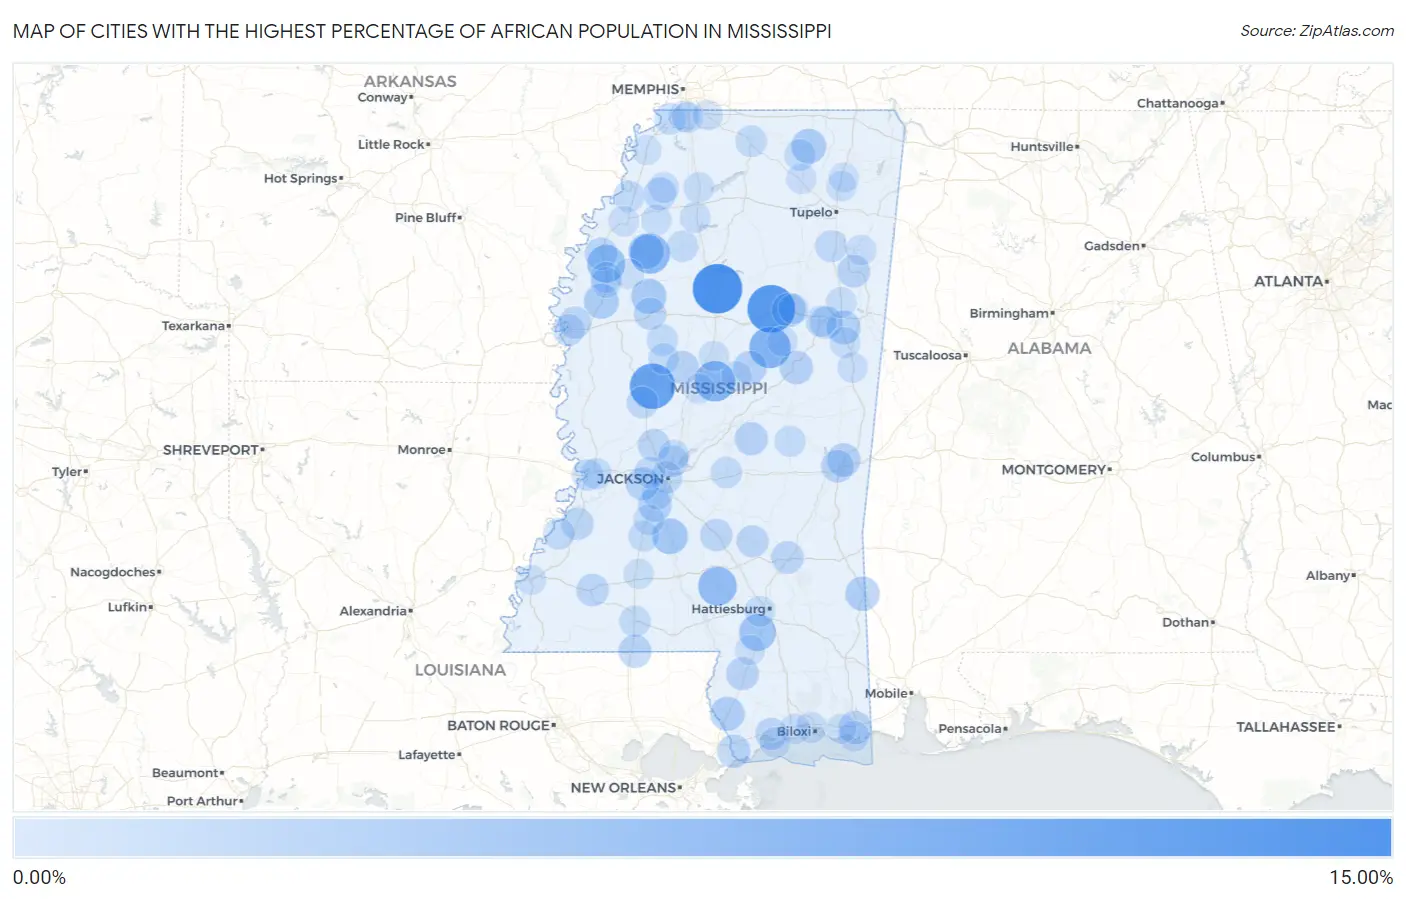
Cities with the Highest Percentage of African Population in Mississippi
RELATED REPORTS & OPTIONS
African
Mississippi
Compare Cities
Map of Cities with the Highest Percentage of African Population in Mississippi
0.00%
15.00%
Cities with the Highest Percentage of African Population in Mississippi
| City | African | vs State | vs National | |
| 1. | Elliott | 11.45% | 0.55%(+10.9)#1 | 0.57%(+10.9)#79 |
| 2. | Eupora | 10.40% | 0.55%(+9.85)#2 | 0.57%(+9.83)#100 |
| 3. | Eden | 9.00% | 0.55%(+8.45)#3 | 0.57%(+8.44)#122 |
| 4. | Weir | 6.60% | 0.55%(+6.05)#4 | 0.57%(+6.03)#212 |
| 5. | Sallis | 6.21% | 0.55%(+5.66)#5 | 0.57%(+5.65)#230 |
| 6. | Webb | 5.73% | 0.55%(+5.17)#6 | 0.57%(+5.16)#262 |
| 7. | Bassfield | 5.12% | 0.55%(+4.57)#7 | 0.57%(+4.55)#311 |
| 8. | Mound Bayou | 4.68% | 0.55%(+4.13)#8 | 0.57%(+4.12)#355 |
| 9. | Purvis | 4.15% | 0.55%(+3.59)#9 | 0.57%(+3.58)#422 |
| 10. | Georgetown | 3.49% | 0.55%(+2.93)#10 | 0.57%(+2.92)#512 |
| 11. | Sumner | 3.27% | 0.55%(+2.72)#11 | 0.57%(+2.70)#546 |
| 12. | Schlater | 3.11% | 0.55%(+2.56)#12 | 0.57%(+2.55)#595 |
| 13. | Shaw | 3.03% | 0.55%(+2.48)#13 | 0.57%(+2.47)#618 |
| 14. | Ripley | 2.96% | 0.55%(+2.41)#14 | 0.57%(+2.39)#644 |
| 15. | State Line | 2.67% | 0.55%(+2.12)#15 | 0.57%(+2.10)#724 |
| 16. | Mathiston | 2.60% | 0.55%(+2.05)#16 | 0.57%(+2.04)#743 |
| 17. | Picayune | 2.54% | 0.55%(+1.99)#17 | 0.57%(+1.98)#772 |
| 18. | Artesia | 2.41% | 0.55%(+1.85)#18 | 0.57%(+1.84)#816 |
| 19. | Terry | 2.34% | 0.55%(+1.78)#19 | 0.57%(+1.77)#848 |
| 20. | Louisville | 2.21% | 0.55%(+1.66)#20 | 0.57%(+1.65)#906 |
| 21. | Marion | 2.17% | 0.55%(+1.62)#21 | 0.57%(+1.61)#930 |
| 22. | Ethel | 2.17% | 0.55%(+1.61)#22 | 0.57%(+1.60)#933 |
| 23. | Pearlington | 2.12% | 0.55%(+1.56)#23 | 0.57%(+1.55)#953 |
| 24. | Walnut Grove | 2.08% | 0.55%(+1.53)#24 | 0.57%(+1.52)#980 |
| 25. | Raymond | 2.03% | 0.55%(+1.47)#25 | 0.57%(+1.46)#1,007 |
| 26. | Lexington | 1.99% | 0.55%(+1.44)#26 | 0.57%(+1.43)#1,033 |
| 27. | Moss Point | 1.96% | 0.55%(+1.41)#27 | 0.57%(+1.40)#1,048 |
| 28. | Osyka | 1.96% | 0.55%(+1.41)#28 | 0.57%(+1.40)#1,049 |
| 29. | Aberdeen | 1.87% | 0.55%(+1.32)#29 | 0.57%(+1.31)#1,111 |
| 30. | Poplarville | 1.85% | 0.55%(+1.29)#30 | 0.57%(+1.28)#1,122 |
| 31. | Meridian | 1.79% | 0.55%(+1.24)#31 | 0.57%(+1.23)#1,149 |
| 32. | Mississippi State | 1.78% | 0.55%(+1.23)#32 | 0.57%(+1.22)#1,161 |
| 33. | Falcon | 1.73% | 0.55%(+1.18)#33 | 0.57%(+1.17)#1,196 |
| 34. | Laurel | 1.70% | 0.55%(+1.15)#34 | 0.57%(+1.13)#1,226 |
| 35. | Magee | 1.66% | 0.55%(+1.11)#35 | 0.57%(+1.10)#1,258 |
| 36. | Bude | 1.66% | 0.55%(+1.11)#36 | 0.57%(+1.09)#1,260 |
| 37. | Shelby | 1.66% | 0.55%(+1.10)#37 | 0.57%(+1.09)#1,268 |
| 38. | Port Gibson | 1.55% | 0.55%(+0.992)#38 | 0.57%(+0.980)#1,363 |
| 39. | Taylorsville | 1.51% | 0.55%(+0.961)#39 | 0.57%(+0.949)#1,391 |
| 40. | Mississippi Valley State University | 1.50% | 0.55%(+0.942)#40 | 0.57%(+0.930)#1,414 |
| 41. | Metcalfe | 1.48% | 0.55%(+0.929)#41 | 0.57%(+0.917)#1,432 |
| 42. | Flora | 1.47% | 0.55%(+0.917)#42 | 0.57%(+0.905)#1,449 |
| 43. | Delisle | 1.45% | 0.55%(+0.899)#43 | 0.57%(+0.888)#1,476 |
| 44. | Jackson | 1.37% | 0.55%(+0.812)#44 | 0.57%(+0.800)#1,584 |
| 45. | Okolona | 1.35% | 0.55%(+0.794)#45 | 0.57%(+0.782)#1,603 |
| 46. | Ridgeland | 1.33% | 0.55%(+0.775)#46 | 0.57%(+0.763)#1,630 |
| 47. | Greenville | 1.30% | 0.55%(+0.748)#47 | 0.57%(+0.737)#1,676 |
| 48. | Yazoo City | 1.22% | 0.55%(+0.667)#48 | 0.57%(+0.655)#1,787 |
| 49. | Holly Springs | 1.17% | 0.55%(+0.613)#49 | 0.57%(+0.601)#1,856 |
| 50. | Morton | 1.17% | 0.55%(+0.612)#50 | 0.57%(+0.600)#1,859 |
| 51. | Walls | 1.15% | 0.55%(+0.601)#51 | 0.57%(+0.589)#1,875 |
| 52. | Clinton | 1.15% | 0.55%(+0.599)#52 | 0.57%(+0.588)#1,879 |
| 53. | Cruger | 1.12% | 0.55%(+0.570)#53 | 0.57%(+0.558)#1,921 |
| 54. | Alcorn State University | 1.12% | 0.55%(+0.567)#54 | 0.57%(+0.555)#1,927 |
| 55. | Blue Mountain | 1.09% | 0.55%(+0.537)#55 | 0.57%(+0.526)#1,980 |
| 56. | Vicksburg | 1.06% | 0.55%(+0.510)#56 | 0.57%(+0.499)#2,029 |
| 57. | Charleston | 1.03% | 0.55%(+0.476)#57 | 0.57%(+0.464)#2,087 |
| 58. | Coahoma | 1.03% | 0.55%(+0.472)#58 | 0.57%(+0.460)#2,092 |
| 59. | Mccomb | 1.02% | 0.55%(+0.463)#59 | 0.57%(+0.451)#2,105 |
| 60. | Byram | 1.01% | 0.55%(+0.453)#60 | 0.57%(+0.441)#2,119 |
| 61. | Starkville | 0.99% | 0.55%(+0.439)#61 | 0.57%(+0.427)#2,152 |
| 62. | Beechwood | 0.92% | 0.55%(+0.369)#62 | 0.57%(+0.357)#2,300 |
| 63. | Renova | 0.89% | 0.55%(+0.339)#63 | 0.57%(+0.327)#2,360 |
| 64. | Union | 0.86% | 0.55%(+0.310)#64 | 0.57%(+0.298)#2,427 |
| 65. | Tchula | 0.84% | 0.55%(+0.282)#65 | 0.57%(+0.270)#2,494 |
| 66. | Hazlehurst | 0.83% | 0.55%(+0.280)#66 | 0.57%(+0.268)#2,500 |
| 67. | Biloxi | 0.82% | 0.55%(+0.269)#67 | 0.57%(+0.257)#2,525 |
| 68. | Horn Lake | 0.80% | 0.55%(+0.249)#68 | 0.57%(+0.238)#2,575 |
| 69. | Sledge | 0.80% | 0.55%(+0.249)#69 | 0.57%(+0.237)#2,578 |
| 70. | West Point | 0.78% | 0.55%(+0.222)#70 | 0.57%(+0.210)#2,664 |
| 71. | Crystal Springs | 0.77% | 0.55%(+0.214)#71 | 0.57%(+0.202)#2,687 |
| 72. | Pope | 0.76% | 0.55%(+0.203)#72 | 0.57%(+0.191)#2,732 |
| 73. | Southaven | 0.75% | 0.55%(+0.201)#73 | 0.57%(+0.189)#2,741 |
| 74. | Madison | 0.74% | 0.55%(+0.186)#74 | 0.57%(+0.174)#2,770 |
| 75. | West Hattiesburg | 0.74% | 0.55%(+0.184)#75 | 0.57%(+0.173)#2,775 |
| 76. | Crawford | 0.72% | 0.55%(+0.169)#76 | 0.57%(+0.158)#2,812 |
| 77. | Pascagoula | 0.67% | 0.55%(+0.113)#77 | 0.57%(+0.101)#2,993 |
| 78. | Lambert | 0.65% | 0.55%(+0.098)#78 | 0.57%(+0.086)#3,039 |
| 79. | Sardis | 0.65% | 0.55%(+0.092)#79 | 0.57%(+0.080)#3,063 |
| 80. | Cleveland | 0.62% | 0.55%(+0.069)#80 | 0.57%(+0.057)#3,143 |
| 81. | Amory | 0.62% | 0.55%(+0.064)#81 | 0.57%(+0.052)#3,173 |
| 82. | New Albany | 0.61% | 0.55%(+0.060)#82 | 0.57%(+0.048)#3,181 |
| 83. | Macon | 0.58% | 0.55%(+0.024)#83 | 0.57%(+0.012)#3,327 |
| 84. | Gulfport | 0.56% | 0.55%(+0.009)#84 | 0.57%(-0.003)#3,391 |
| 85. | Clarksdale | 0.56% | 0.55%(+0.009)#85 | 0.57%(-0.003)#3,392 |
| 86. | Pass Christian | 0.55% | 0.55%(-0.002)#86 | 0.57%(-0.014)#3,429 |
| 87. | Goodman | 0.54% | 0.55%(-0.010)#87 | 0.57%(-0.021)#3,461 |
| 88. | Kosciusko | 0.54% | 0.55%(-0.015)#88 | 0.57%(-0.027)#3,481 |
| 89. | Ackerman | 0.50% | 0.55%(-0.052)#89 | 0.57%(-0.063)#3,630 |
| 90. | West | 0.50% | 0.55%(-0.053)#90 | 0.57%(-0.065)#3,638 |
| 91. | Olive Branch | 0.49% | 0.55%(-0.059)#91 | 0.57%(-0.071)#3,661 |
| 92. | Maben | 0.49% | 0.55%(-0.065)#92 | 0.57%(-0.077)#3,696 |
| 93. | Brookhaven | 0.49% | 0.55%(-0.067)#93 | 0.57%(-0.079)#3,703 |
| 94. | Guntown | 0.48% | 0.55%(-0.071)#94 | 0.57%(-0.083)#3,723 |
| 95. | Drew | 0.45% | 0.55%(-0.104)#95 | 0.57%(-0.116)#3,890 |
| 96. | North Tunica | 0.43% | 0.55%(-0.128)#96 | 0.57%(-0.140)#4,030 |
| 97. | Natchez | 0.42% | 0.55%(-0.136)#97 | 0.57%(-0.148)#4,067 |
| 98. | Lumberton | 0.38% | 0.55%(-0.176)#98 | 0.57%(-0.188)#4,265 |
| 99. | Baldwyn | 0.38% | 0.55%(-0.176)#99 | 0.57%(-0.188)#4,267 |
| 100. | Gautier | 0.36% | 0.55%(-0.190)#100 | 0.57%(-0.202)#4,339 |
Common Questions
What are the Top 10 Cities with the Highest Percentage of African Population in Mississippi?
Top 10 Cities with the Highest Percentage of African Population in Mississippi are:
#1
11.45%
#2
10.40%
#3
9.00%
#4
6.60%
#5
6.21%
#6
5.73%
#7
5.12%
#8
4.68%
#9
4.15%
#10
3.49%
What city has the Highest Percentage of African Population in Mississippi?
Elliott has the Highest Percentage of African Population in Mississippi with 11.45%.
What is the Percentage of African Population in the State of Mississippi?
Percentage of African Population in Mississippi is 0.55%.
What is the Percentage of African Population in the United States?
Percentage of African Population in the United States is 0.57%.