Cities with the Highest Poverty Level Among Single Mothers in Illinois
RELATED REPORTS & OPTIONS
Highest Poverty | Single Mother
Illinois
Compare Cities
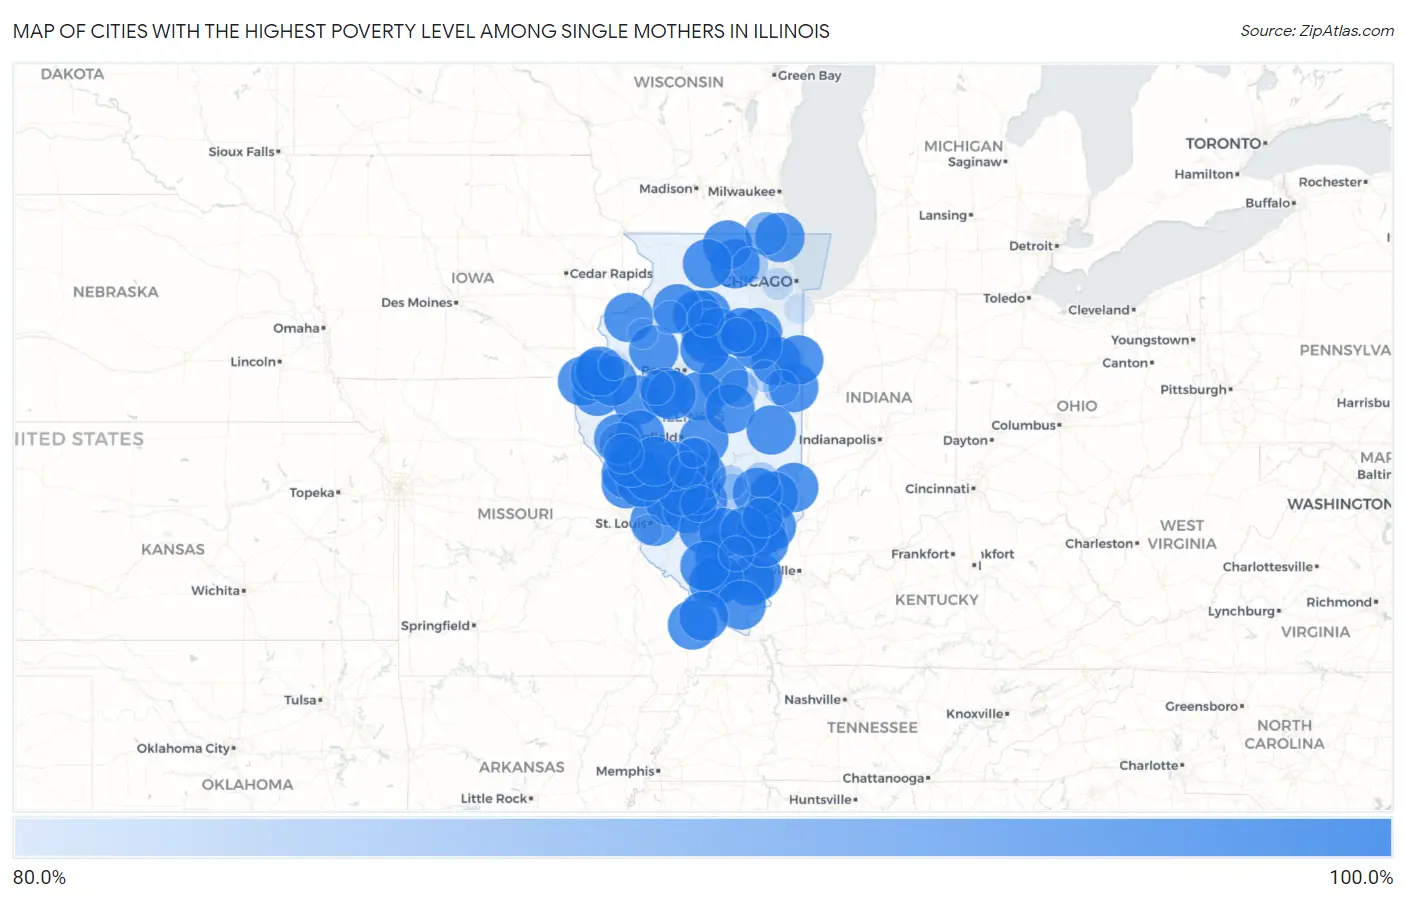
Map of Cities with the Highest Poverty Level Among Single Mothers in Illinois
0.0%
100.0%
Cities with the Highest Poverty Level Among Single Mothers in Illinois
| City | Single Mother Poverty | vs State | vs National | |
| 1. | Genoa | 100.0% | 32.4%(+67.6)#1 | 33.1%(+66.9)#20 |
| 2. | Hoopeston | 100.0% | 32.4%(+67.6)#2 | 33.1%(+66.9)#24 |
| 3. | Poplar Grove | 100.0% | 32.4%(+67.6)#3 | 33.1%(+66.9)#25 |
| 4. | Eldorado | 100.0% | 32.4%(+67.6)#4 | 33.1%(+66.9)#41 |
| 5. | Wadsworth | 100.0% | 32.4%(+67.6)#5 | 33.1%(+66.9)#52 |
| 6. | Carthage | 100.0% | 32.4%(+67.6)#6 | 33.1%(+66.9)#112 |
| 7. | Fairmont City | 100.0% | 32.4%(+67.6)#7 | 33.1%(+66.9)#146 |
| 8. | Gardner | 100.0% | 32.4%(+67.6)#8 | 33.1%(+66.9)#241 |
| 9. | Stillman Valley | 100.0% | 32.4%(+67.6)#9 | 33.1%(+66.9)#329 |
| 10. | Coyne Center | 100.0% | 32.4%(+67.6)#10 | 33.1%(+66.9)#433 |
| 11. | Worden | 100.0% | 32.4%(+67.6)#11 | 33.1%(+66.9)#482 |
| 12. | Nauvoo | 100.0% | 32.4%(+67.6)#12 | 33.1%(+66.9)#490 |
| 13. | Dallas City | 100.0% | 32.4%(+67.6)#13 | 33.1%(+66.9)#499 |
| 14. | Pocahontas | 100.0% | 32.4%(+67.6)#14 | 33.1%(+66.9)#524 |
| 15. | Hardin | 100.0% | 32.4%(+67.6)#15 | 33.1%(+66.9)#543 |
| 16. | Mulberry Grove | 100.0% | 32.4%(+67.6)#16 | 33.1%(+66.9)#577 |
| 17. | Oak Run | 100.0% | 32.4%(+67.6)#17 | 33.1%(+66.9)#619 |
| 18. | Taylor Springs | 100.0% | 32.4%(+67.6)#18 | 33.1%(+66.9)#627 |
| 19. | Hoffman | 100.0% | 32.4%(+67.6)#19 | 33.1%(+66.9)#641 |
| 20. | Vermont | 100.0% | 32.4%(+67.6)#20 | 33.1%(+66.9)#649 |
| 21. | Blandinsville | 100.0% | 32.4%(+67.6)#21 | 33.1%(+66.9)#656 |
| 22. | Hutsonville | 100.0% | 32.4%(+67.6)#22 | 33.1%(+66.9)#675 |
| 23. | Coffeen | 100.0% | 32.4%(+67.6)#23 | 33.1%(+66.9)#690 |
| 24. | Danforth | 100.0% | 32.4%(+67.6)#24 | 33.1%(+66.9)#749 |
| 25. | Mount Auburn | 100.0% | 32.4%(+67.6)#25 | 33.1%(+66.9)#777 |
| 26. | Rest Haven | 100.0% | 32.4%(+67.6)#26 | 33.1%(+66.9)#815 |
| 27. | Cherry | 100.0% | 32.4%(+67.6)#27 | 33.1%(+66.9)#863 |
| 28. | Towanda | 100.0% | 32.4%(+67.6)#28 | 33.1%(+66.9)#905 |
| 29. | Campbell's Island | 100.0% | 32.4%(+67.6)#29 | 33.1%(+66.9)#924 |
| 30. | Thebes | 100.0% | 32.4%(+67.6)#30 | 33.1%(+66.9)#940 |
| 31. | Malden | 100.0% | 32.4%(+67.6)#31 | 33.1%(+66.9)#965 |
| 32. | Armington | 100.0% | 32.4%(+67.6)#32 | 33.1%(+66.9)#977 |
| 33. | Lomax | 100.0% | 32.4%(+67.6)#33 | 33.1%(+66.9)#1,001 |
| 34. | Coalton | 100.0% | 32.4%(+67.6)#34 | 33.1%(+66.9)#1,052 |
| 35. | Perry | 100.0% | 32.4%(+67.6)#35 | 33.1%(+66.9)#1,175 |
| 36. | Alexander | 100.0% | 32.4%(+67.6)#36 | 33.1%(+66.9)#1,209 |
| 37. | Kampsville | 100.0% | 32.4%(+67.6)#37 | 33.1%(+66.9)#1,237 |
| 38. | Willow Hill | 100.0% | 32.4%(+67.6)#38 | 33.1%(+66.9)#1,246 |
| 39. | Nason | 100.0% | 32.4%(+67.6)#39 | 33.1%(+66.9)#1,280 |
| 40. | Iroquois | 100.0% | 32.4%(+67.6)#40 | 33.1%(+66.9)#1,288 |
| 41. | Parkersburg | 100.0% | 32.4%(+67.6)#41 | 33.1%(+66.9)#1,302 |
| 42. | Palmer | 100.0% | 32.4%(+67.6)#42 | 33.1%(+66.9)#1,307 |
| 43. | Omaha | 100.0% | 32.4%(+67.6)#43 | 33.1%(+66.9)#1,321 |
| 44. | Colp | 100.0% | 32.4%(+67.6)#44 | 33.1%(+66.9)#1,324 |
| 45. | Mcnabb | 100.0% | 32.4%(+67.6)#45 | 33.1%(+66.9)#1,332 |
| 46. | Kane | 100.0% | 32.4%(+67.6)#46 | 33.1%(+66.9)#1,342 |
| 47. | Magnolia | 100.0% | 32.4%(+67.6)#47 | 33.1%(+66.9)#1,351 |
| 48. | Freeman Spur | 100.0% | 32.4%(+67.6)#48 | 33.1%(+66.9)#1,386 |
| 49. | Goofy Ridge | 100.0% | 32.4%(+67.6)#49 | 33.1%(+66.9)#1,401 |
| 50. | Forest City | 100.0% | 32.4%(+67.6)#50 | 33.1%(+66.9)#1,412 |
| 51. | Lawrence | 100.0% | 32.4%(+67.6)#51 | 33.1%(+66.9)#1,422 |
| 52. | Ophiem | 100.0% | 32.4%(+67.6)#52 | 33.1%(+66.9)#1,452 |
| 53. | De Witt | 100.0% | 32.4%(+67.6)#53 | 33.1%(+66.9)#1,458 |
| 54. | Kell | 100.0% | 32.4%(+67.6)#54 | 33.1%(+66.9)#1,482 |
| 55. | St Johns | 100.0% | 32.4%(+67.6)#55 | 33.1%(+66.9)#1,513 |
| 56. | Holcomb | 100.0% | 32.4%(+67.6)#56 | 33.1%(+66.9)#1,526 |
| 57. | Campus | 100.0% | 32.4%(+67.6)#58 | 33.1%(+66.9)#1,567 |
| 58. | Concord | 100.0% | 32.4%(+67.6)#59 | 33.1%(+66.9)#1,568 |
| 59. | Walshville | 100.0% | 32.4%(+67.6)#60 | 33.1%(+66.9)#1,582 |
| 60. | Nilwood | 100.0% | 32.4%(+67.6)#61 | 33.1%(+66.9)#1,587 |
| 61. | Mount Erie | 100.0% | 32.4%(+67.6)#62 | 33.1%(+66.9)#1,640 |
| 62. | Rockbridge | 100.0% | 32.4%(+67.6)#63 | 33.1%(+66.9)#1,641 |
| 63. | Leonore | 100.0% | 32.4%(+67.6)#64 | 33.1%(+66.9)#1,645 |
| 64. | Hillview | 100.0% | 32.4%(+67.6)#65 | 33.1%(+66.9)#1,671 |
| 65. | Wheeler | 100.0% | 32.4%(+67.6)#66 | 33.1%(+66.9)#1,677 |
| 66. | Harding | 100.0% | 32.4%(+67.6)#67 | 33.1%(+66.9)#1,719 |
| 67. | La Rose | 100.0% | 32.4%(+67.6)#68 | 33.1%(+66.9)#1,724 |
| 68. | Golden Gate | 100.0% | 32.4%(+67.6)#69 | 33.1%(+66.9)#1,784 |
| 69. | Longview | 100.0% | 32.4%(+67.6)#70 | 33.1%(+66.9)#1,812 |
| 70. | Scottville | 100.0% | 32.4%(+67.6)#71 | 33.1%(+66.9)#1,815 |
| 71. | Gulfport | 100.0% | 32.4%(+67.6)#72 | 33.1%(+66.9)#1,819 |
| 72. | Kinsman | 100.0% | 32.4%(+67.6)#73 | 33.1%(+66.9)#1,856 |
| 73. | Eddyville | 100.0% | 32.4%(+67.6)#74 | 33.1%(+66.9)#1,860 |
| 74. | Johnsonville | 100.0% | 32.4%(+67.6)#75 | 33.1%(+66.9)#1,907 |
| 75. | New Bedford | 100.0% | 32.4%(+67.6)#76 | 33.1%(+66.9)#1,916 |
| 76. | Mill Creek | 100.0% | 32.4%(+67.6)#77 | 33.1%(+66.9)#1,923 |
| 77. | Channel Lake | 94.5% | 32.4%(+62.2)#78 | 33.1%(+61.4)#2,015 |
| 78. | Griggsville | 93.3% | 32.4%(+61.0)#79 | 33.1%(+60.2)#2,052 |
| 79. | Noble | 92.0% | 32.4%(+59.6)#80 | 33.1%(+58.9)#2,092 |
| 80. | Milton | 91.7% | 32.4%(+59.3)#81 | 33.1%(+58.5)#2,112 |
| 81. | Arrowsmith | 90.0% | 32.4%(+57.6)#82 | 33.1%(+56.9)#2,171 |
| 82. | Ladd | 88.9% | 32.4%(+56.5)#83 | 33.1%(+55.8)#2,208 |
| 83. | Harvel | 88.9% | 32.4%(+56.5)#84 | 33.1%(+55.8)#2,225 |
| 84. | Smithboro | 88.9% | 32.4%(+56.5)#85 | 33.1%(+55.8)#2,226 |
| 85. | Pingree Grove | 88.1% | 32.4%(+55.8)#86 | 33.1%(+55.0)#2,253 |
| 86. | Rankin | 87.8% | 32.4%(+55.4)#87 | 33.1%(+54.7)#2,265 |
| 87. | Dahlgren | 87.5% | 32.4%(+55.1)#88 | 33.1%(+54.4)#2,284 |
| 88. | Jewett | 87.5% | 32.4%(+55.1)#89 | 33.1%(+54.4)#2,294 |
| 89. | Bryant | 87.5% | 32.4%(+55.1)#90 | 33.1%(+54.4)#2,295 |
| 90. | Altamont | 86.7% | 32.4%(+54.3)#91 | 33.1%(+53.5)#2,314 |
| 91. | Beecher City | 86.7% | 32.4%(+54.3)#92 | 33.1%(+53.5)#2,324 |
| 92. | Ransom | 86.7% | 32.4%(+54.3)#93 | 33.1%(+53.5)#2,326 |
| 93. | Mineral | 85.7% | 32.4%(+53.4)#94 | 33.1%(+52.6)#2,406 |
| 94. | Roberts | 84.6% | 32.4%(+52.3)#95 | 33.1%(+51.5)#2,458 |
| 95. | Oak Brook | 84.5% | 32.4%(+52.1)#96 | 33.1%(+51.4)#2,467 |
| 96. | Woodhull | 83.3% | 32.4%(+51.0)#97 | 33.1%(+50.2)#2,514 |
| 97. | East Carondelet | 83.3% | 32.4%(+51.0)#98 | 33.1%(+50.2)#2,535 |
| 98. | Bulpitt | 83.3% | 32.4%(+51.0)#99 | 33.1%(+50.2)#2,537 |
| 99. | Media | 83.3% | 32.4%(+51.0)#100 | 33.1%(+50.2)#2,550 |
| 100. | Ford Heights | 83.0% | 32.4%(+50.7)#101 | 33.1%(+49.9)#2,562 |
Common Questions
What are the Top 10 Cities with the Highest Poverty Level Among Single Mothers in Illinois?
Top 10 Cities with the Highest Poverty Level Among Single Mothers in Illinois are:
#1
100.0%
#2
100.0%
#3
100.0%
#4
100.0%
#5
100.0%
#6
100.0%
#7
100.0%
#8
100.0%
#9
100.0%
#10
100.0%
What city has the Highest Poverty Level Among Single Mothers in Illinois?
Genoa has the Highest Poverty Level Among Single Mothers in Illinois with 100.0%.
What is the Poverty Level Among Single Mothers in the State of Illinois?
Poverty Level Among Single Mothers in Illinois is 32.4%.
What is the Poverty Level Among Single Mothers in the United States?
Poverty Level Among Single Mothers in the United States is 33.1%.