Cities with the Highest Poverty Level Among Single Mothers in Idaho
RELATED REPORTS & OPTIONS
Highest Poverty | Single Mother
Idaho
Compare Cities
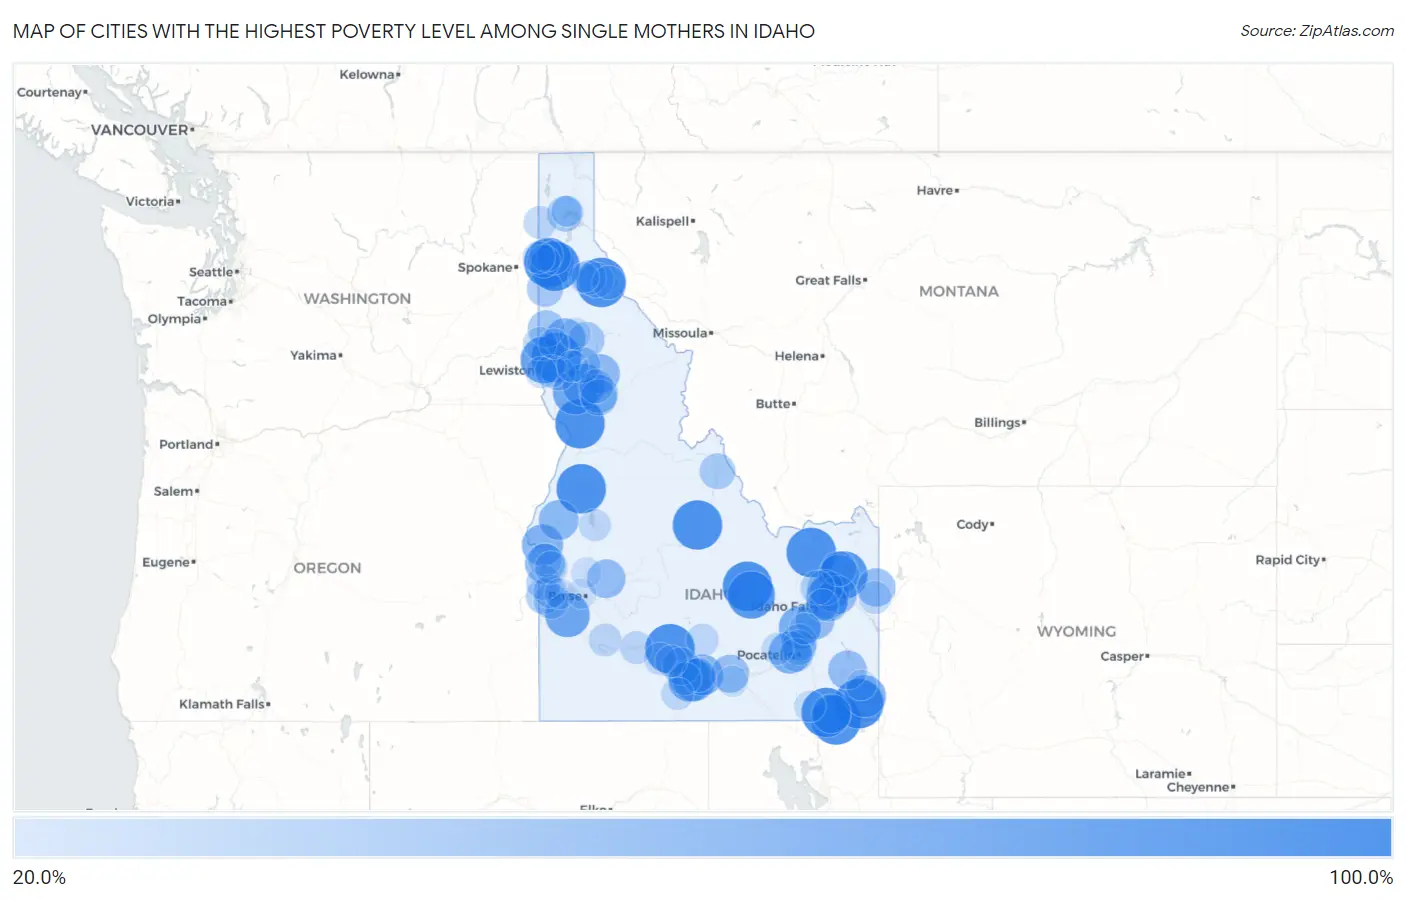
Map of Cities with the Highest Poverty Level Among Single Mothers in Idaho
0.0%
100.0%
Cities with the Highest Poverty Level Among Single Mothers in Idaho
| City | Single Mother Poverty | vs State | vs National | |
| 1. | Gooding | 100.0% | 31.7%(+68.3)#1 | 33.1%(+66.9)#46 |
| 2. | Wallace | 100.0% | 31.7%(+68.3)#2 | 33.1%(+66.9)#359 |
| 3. | Franklin | 100.0% | 31.7%(+68.3)#3 | 33.1%(+66.9)#492 |
| 4. | Challis | 100.0% | 31.7%(+68.3)#4 | 33.1%(+66.9)#503 |
| 5. | Paris | 100.0% | 31.7%(+68.3)#5 | 33.1%(+66.9)#578 |
| 6. | Juliaetta | 100.0% | 31.7%(+68.3)#6 | 33.1%(+66.9)#711 |
| 7. | Dubois | 100.0% | 31.7%(+68.3)#7 | 33.1%(+66.9)#774 |
| 8. | Dayton | 100.0% | 31.7%(+68.3)#8 | 33.1%(+66.9)#803 |
| 9. | New Meadows | 100.0% | 31.7%(+68.3)#9 | 33.1%(+66.9)#1,146 |
| 10. | Moore | 100.0% | 31.7%(+68.3)#10 | 33.1%(+66.9)#1,392 |
| 11. | Huetter | 100.0% | 31.7%(+68.3)#11 | 33.1%(+66.9)#1,547 |
| 12. | Fernan Lake Village | 100.0% | 31.7%(+68.3)#12 | 33.1%(+66.9)#1,637 |
| 13. | White Bird | 100.0% | 31.7%(+68.3)#13 | 33.1%(+66.9)#1,909 |
| 14. | Teton | 92.9% | 31.7%(+61.1)#14 | 33.1%(+59.7)#2,069 |
| 15. | Arco | 92.3% | 31.7%(+60.6)#15 | 33.1%(+59.2)#2,083 |
| 16. | Genesee | 88.2% | 31.7%(+56.5)#16 | 33.1%(+55.1)#2,249 |
| 17. | Melba | 81.2% | 31.7%(+49.5)#17 | 33.1%(+48.1)#2,678 |
| 18. | Ferdinand | 80.0% | 31.7%(+48.3)#18 | 33.1%(+46.9)#2,784 |
| 19. | Kimberly | 76.4% | 31.7%(+44.7)#19 | 33.1%(+43.3)#3,062 |
| 20. | Hansen | 74.0% | 31.7%(+42.3)#20 | 33.1%(+40.9)#3,294 |
| 21. | Ucon | 73.9% | 31.7%(+42.2)#21 | 33.1%(+40.8)#3,305 |
| 22. | Nezperce | 73.3% | 31.7%(+41.6)#22 | 33.1%(+40.2)#3,369 |
| 23. | Moreland | 73.1% | 31.7%(+41.4)#23 | 33.1%(+39.9)#3,383 |
| 24. | Arbon Valley | 72.7% | 31.7%(+41.0)#24 | 33.1%(+39.6)#3,417 |
| 25. | Montpelier | 71.8% | 31.7%(+40.1)#25 | 33.1%(+38.7)#3,528 |
| 26. | Weiser | 68.6% | 31.7%(+36.9)#26 | 33.1%(+35.5)#3,878 |
| 27. | Hazelton | 68.0% | 31.7%(+36.3)#27 | 33.1%(+34.9)#3,949 |
| 28. | Sugar City | 66.7% | 31.7%(+34.9)#28 | 33.1%(+33.5)#4,058 |
| 29. | Deary | 66.7% | 31.7%(+34.9)#29 | 33.1%(+33.5)#4,127 |
| 30. | Fruitland | 64.3% | 31.7%(+32.6)#30 | 33.1%(+31.2)#4,473 |
| 31. | Cambridge | 63.6% | 31.7%(+31.9)#31 | 33.1%(+30.5)#4,596 |
| 32. | Weippe | 62.5% | 31.7%(+30.8)#32 | 33.1%(+29.4)#4,758 |
| 33. | Preston | 60.3% | 31.7%(+28.6)#33 | 33.1%(+27.2)#5,041 |
| 34. | Firth | 60.0% | 31.7%(+28.3)#34 | 33.1%(+26.9)#5,115 |
| 35. | Rigby | 59.7% | 31.7%(+28.0)#35 | 33.1%(+26.5)#5,201 |
| 36. | Soda Springs | 59.5% | 31.7%(+27.7)#36 | 33.1%(+26.3)#5,222 |
| 37. | Idaho City | 58.8% | 31.7%(+27.1)#37 | 33.1%(+25.7)#5,297 |
| 38. | Ririe | 58.3% | 31.7%(+26.6)#38 | 33.1%(+25.2)#5,382 |
| 39. | Driggs | 58.3% | 31.7%(+26.5)#39 | 33.1%(+25.1)#5,411 |
| 40. | Kooskia | 57.9% | 31.7%(+26.2)#40 | 33.1%(+24.8)#5,453 |
| 41. | Iona | 56.8% | 31.7%(+25.0)#41 | 33.1%(+23.6)#5,648 |
| 42. | Rupert | 56.7% | 31.7%(+25.0)#42 | 33.1%(+23.6)#5,654 |
| 43. | Jerome | 55.2% | 31.7%(+23.5)#43 | 33.1%(+22.1)#5,883 |
| 44. | Potlatch | 52.5% | 31.7%(+20.8)#44 | 33.1%(+19.4)#6,353 |
| 45. | Fort Hall | 51.5% | 31.7%(+19.7)#45 | 33.1%(+18.3)#6,535 |
| 46. | Worley | 50.0% | 31.7%(+18.3)#46 | 33.1%(+16.9)#7,019 |
| 47. | Elk River | 50.0% | 31.7%(+18.3)#47 | 33.1%(+16.9)#7,077 |
| 48. | Stites | 50.0% | 31.7%(+18.3)#48 | 33.1%(+16.9)#7,078 |
| 49. | Orofino | 48.9% | 31.7%(+17.2)#49 | 33.1%(+15.8)#7,261 |
| 50. | Salmon | 48.5% | 31.7%(+16.8)#50 | 33.1%(+15.3)#7,332 |
| 51. | Sandpoint | 48.2% | 31.7%(+16.4)#51 | 33.1%(+15.0)#7,400 |
| 52. | Homedale | 47.7% | 31.7%(+16.0)#52 | 33.1%(+14.6)#7,491 |
| 53. | Menan | 47.4% | 31.7%(+15.7)#53 | 33.1%(+14.2)#7,559 |
| 54. | Parker | 46.2% | 31.7%(+14.4)#54 | 33.1%(+13.0)#7,850 |
| 55. | Osburn | 45.8% | 31.7%(+14.1)#55 | 33.1%(+12.7)#7,916 |
| 56. | Marsing | 45.8% | 31.7%(+14.1)#56 | 33.1%(+12.7)#7,919 |
| 57. | Tyhee | 45.3% | 31.7%(+13.6)#57 | 33.1%(+12.1)#8,056 |
| 58. | Parma | 44.6% | 31.7%(+12.9)#58 | 33.1%(+11.5)#8,219 |
| 59. | Kellogg | 43.5% | 31.7%(+11.8)#59 | 33.1%(+10.4)#8,471 |
| 60. | Kamiah | 42.9% | 31.7%(+11.1)#60 | 33.1%(+9.72)#8,613 |
| 61. | Hayden Lake | 42.9% | 31.7%(+11.1)#61 | 33.1%(+9.72)#8,623 |
| 62. | Roberts | 42.9% | 31.7%(+11.1)#62 | 33.1%(+9.72)#8,642 |
| 63. | Eden | 41.7% | 31.7%(+9.95)#63 | 33.1%(+8.53)#8,932 |
| 64. | Pocatello | 40.9% | 31.7%(+9.21)#64 | 33.1%(+7.79)#9,083 |
| 65. | Moscow | 40.5% | 31.7%(+8.77)#65 | 33.1%(+7.36)#9,172 |
| 66. | Greenleaf | 40.0% | 31.7%(+8.28)#66 | 33.1%(+6.86)#9,303 |
| 67. | Mullan | 40.0% | 31.7%(+8.28)#67 | 33.1%(+6.86)#9,328 |
| 68. | Culdesac | 40.0% | 31.7%(+8.28)#68 | 33.1%(+6.86)#9,366 |
| 69. | Payette | 39.8% | 31.7%(+8.08)#69 | 33.1%(+6.66)#9,433 |
| 70. | Rathdrum | 39.7% | 31.7%(+7.95)#70 | 33.1%(+6.53)#9,458 |
| 71. | Oldtown | 38.5% | 31.7%(+6.74)#71 | 33.1%(+5.33)#9,764 |
| 72. | Post Falls | 37.8% | 31.7%(+6.06)#72 | 33.1%(+4.64)#9,933 |
| 73. | New Plymouth | 37.8% | 31.7%(+6.06)#73 | 33.1%(+4.64)#9,937 |
| 74. | Victor | 37.6% | 31.7%(+5.93)#74 | 33.1%(+4.51)#9,969 |
| 75. | Mountain Home Afb | 37.5% | 31.7%(+5.78)#75 | 33.1%(+4.36)#9,987 |
| 76. | Glenns Ferry | 37.5% | 31.7%(+5.78)#76 | 33.1%(+4.36)#9,995 |
| 77. | Richfield | 37.0% | 31.7%(+5.32)#77 | 33.1%(+3.90)#10,159 |
| 78. | Twin Falls | 36.9% | 31.7%(+5.13)#78 | 33.1%(+3.71)#10,196 |
| 79. | Lapwai | 36.7% | 31.7%(+4.95)#79 | 33.1%(+3.53)#10,254 |
| 80. | Hollister | 36.4% | 31.7%(+4.65)#80 | 33.1%(+3.23)#10,367 |
| 81. | Hagerman | 36.0% | 31.7%(+4.28)#81 | 33.1%(+2.86)#10,461 |
| 82. | Hauser | 35.7% | 31.7%(+4.00)#82 | 33.1%(+2.58)#10,530 |
| 83. | Cascade | 35.0% | 31.7%(+3.28)#83 | 33.1%(+1.86)#10,703 |
| 84. | Wendell | 34.8% | 31.7%(+3.07)#84 | 33.1%(+1.65)#10,763 |
| 85. | Idaho Falls | 34.6% | 31.7%(+2.85)#85 | 33.1%(+1.43)#10,817 |
| 86. | Aberdeen | 34.2% | 31.7%(+2.45)#86 | 33.1%(+1.03)#10,920 |
| 87. | Lewiston | 33.4% | 31.7%(+1.70)#87 | 33.1%(+0.284)#11,051 |
| 88. | Malad City | 33.3% | 31.7%(+1.62)#88 | 33.1%(+0.198)#11,089 |
| 89. | Bovill | 33.3% | 31.7%(+1.62)#89 | 33.1%(+0.198)#11,315 |
| 90. | Peck | 33.3% | 31.7%(+1.62)#90 | 33.1%(+0.198)#11,328 |
| 91. | Blackfoot | 32.9% | 31.7%(+1.14)#91 | 33.1%(-0.283)#11,434 |
| 92. | Kootenai | 32.4% | 31.7%(+0.636)#92 | 33.1%(-0.783)#11,544 |
| 93. | Declo | 31.2% | 31.7%(-0.467)#93 | 33.1%(-1.89)#11,843 |
| 94. | Caldwell | 30.2% | 31.7%(-1.56)#94 | 33.1%(-2.98)#12,108 |
| 95. | Georgetown | 30.0% | 31.7%(-1.72)#95 | 33.1%(-3.14)#12,158 |
| 96. | Horseshoe Bend | 29.4% | 31.7%(-2.30)#96 | 33.1%(-3.72)#12,348 |
| 97. | Troy | 29.2% | 31.7%(-2.55)#97 | 33.1%(-3.97)#12,401 |
| 98. | Ponderay | 29.1% | 31.7%(-2.63)#98 | 33.1%(-4.04)#12,425 |
| 99. | Pinehurst | 28.8% | 31.7%(-2.90)#99 | 33.1%(-4.32)#12,485 |
| 100. | Garden City | 28.1% | 31.7%(-3.62)#100 | 33.1%(-5.04)#12,727 |
Common Questions
What are the Top 10 Cities with the Highest Poverty Level Among Single Mothers in Idaho?
Top 10 Cities with the Highest Poverty Level Among Single Mothers in Idaho are:
What city has the Highest Poverty Level Among Single Mothers in Idaho?
Gooding has the Highest Poverty Level Among Single Mothers in Idaho with 100.0%.
What is the Poverty Level Among Single Mothers in the State of Idaho?
Poverty Level Among Single Mothers in Idaho is 31.7%.
What is the Poverty Level Among Single Mothers in the United States?
Poverty Level Among Single Mothers in the United States is 33.1%.