Cities with the Highest Poverty Level Among Single Mothers in Pennsylvania
RELATED REPORTS & OPTIONS
Highest Poverty | Single Mother
Pennsylvania
Compare Cities
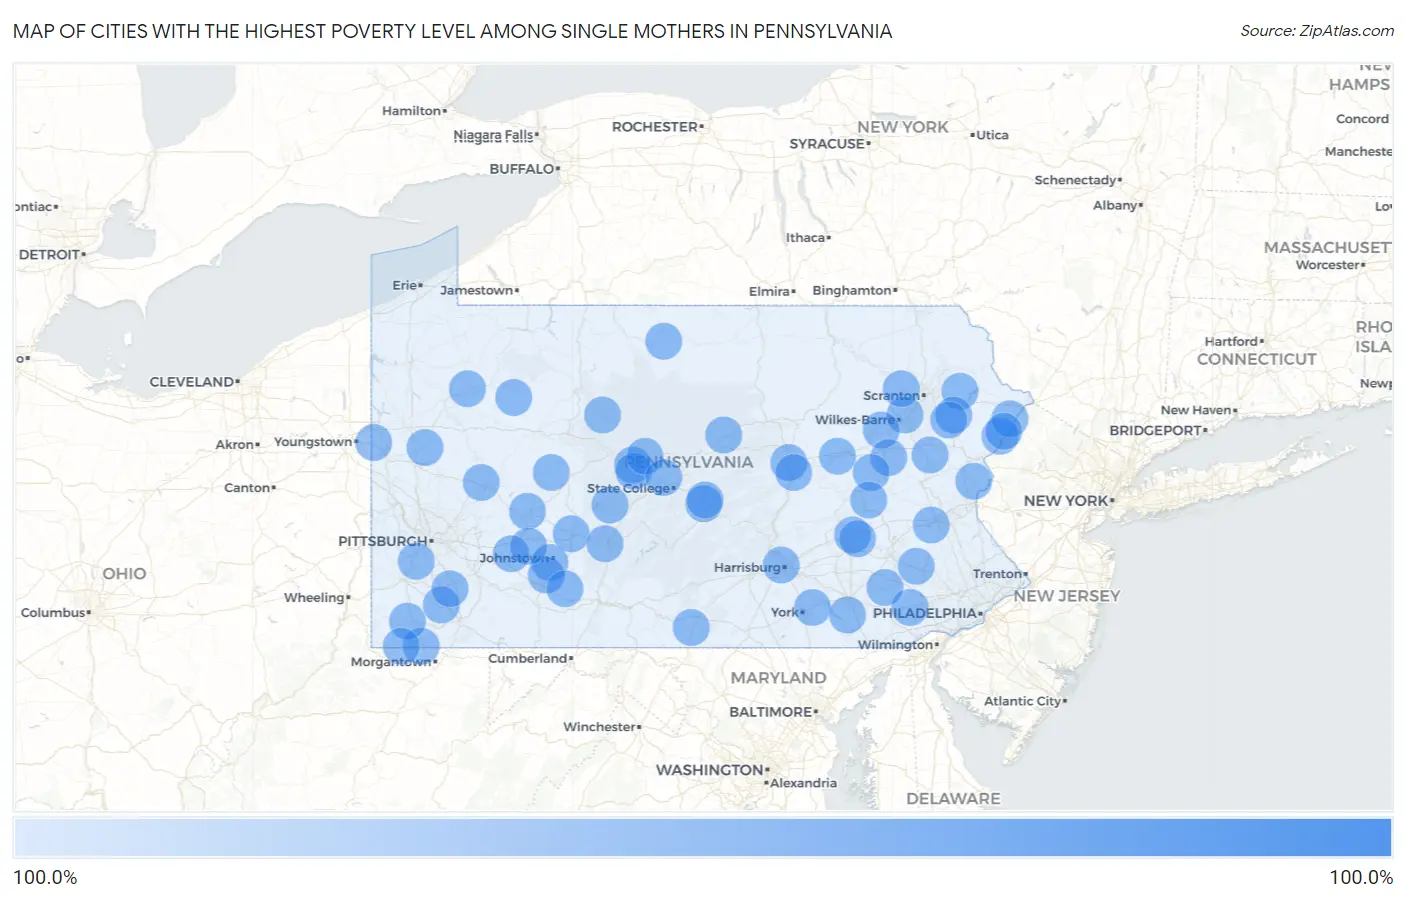
Map of Cities with the Highest Poverty Level Among Single Mothers in Pennsylvania
0.0%
100.0%
Cities with the Highest Poverty Level Among Single Mothers in Pennsylvania
| City | Single Mother Poverty | vs State | vs National | |
| 1. | Amity Gardens | 100.0% | 34.2%(+65.8)#1 | 33.1%(+66.9)#35 |
| 2. | Elim | 100.0% | 34.2%(+65.8)#2 | 33.1%(+66.9)#37 |
| 3. | Mount Oliver Borough | 100.0% | 34.2%(+65.8)#3 | 33.1%(+66.9)#54 |
| 4. | Pine Ridge | 100.0% | 34.2%(+65.8)#4 | 33.1%(+66.9)#76 |
| 5. | Manchester Borough | 100.0% | 34.2%(+65.8)#5 | 33.1%(+66.9)#96 |
| 6. | Slippery Rock University | 100.0% | 34.2%(+65.8)#6 | 33.1%(+66.9)#104 |
| 7. | Mont Clare | 100.0% | 34.2%(+65.8)#7 | 33.1%(+66.9)#141 |
| 8. | The Hideout | 100.0% | 34.2%(+65.8)#8 | 33.1%(+66.9)#150 |
| 9. | Trexlertown | 100.0% | 34.2%(+65.8)#9 | 33.1%(+66.9)#168 |
| 10. | Yorklyn | 100.0% | 34.2%(+65.8)#10 | 33.1%(+66.9)#209 |
| 11. | Church Hill | 100.0% | 34.2%(+65.8)#11 | 33.1%(+66.9)#210 |
| 12. | Espy | 100.0% | 34.2%(+65.8)#12 | 33.1%(+66.9)#222 |
| 13. | Milroy | 100.0% | 34.2%(+65.8)#13 | 33.1%(+66.9)#224 |
| 14. | Birchwood Lakes | 100.0% | 34.2%(+65.8)#14 | 33.1%(+66.9)#234 |
| 15. | Caln | 100.0% | 34.2%(+65.8)#16 | 33.1%(+66.9)#246 |
| 16. | Hudson | 100.0% | 34.2%(+65.8)#17 | 33.1%(+66.9)#247 |
| 17. | West Hills | 100.0% | 34.2%(+65.8)#18 | 33.1%(+66.9)#250 |
| 18. | Hasson Heights | 100.0% | 34.2%(+65.8)#19 | 33.1%(+66.9)#258 |
| 19. | Chevy Chase Heights | 100.0% | 34.2%(+65.8)#20 | 33.1%(+66.9)#276 |
| 20. | Hiller | 100.0% | 34.2%(+65.8)#21 | 33.1%(+66.9)#287 |
| 21. | West Fairview | 100.0% | 34.2%(+65.8)#22 | 33.1%(+66.9)#300 |
| 22. | Conestoga | 100.0% | 34.2%(+65.8)#23 | 33.1%(+66.9)#309 |
| 23. | Pocono Ranch Lands | 100.0% | 34.2%(+65.8)#24 | 33.1%(+66.9)#314 |
| 24. | Dunnstown | 100.0% | 34.2%(+65.8)#25 | 33.1%(+66.9)#316 |
| 25. | Marion | 100.0% | 34.2%(+65.8)#26 | 33.1%(+66.9)#343 |
| 26. | Lawrence | 100.0% | 34.2%(+65.8)#27 | 33.1%(+66.9)#399 |
| 27. | Sykesville Borough | 100.0% | 34.2%(+65.8)#28 | 33.1%(+66.9)#438 |
| 28. | New Bedford | 100.0% | 34.2%(+65.8)#29 | 33.1%(+66.9)#480 |
| 29. | Montandon | 100.0% | 34.2%(+65.8)#30 | 33.1%(+66.9)#493 |
| 30. | Pocono Springs | 100.0% | 34.2%(+65.8)#31 | 33.1%(+66.9)#494 |
| 31. | Morrisdale | 100.0% | 34.2%(+65.8)#32 | 33.1%(+66.9)#526 |
| 32. | Vandling Borough | 100.0% | 34.2%(+65.8)#33 | 33.1%(+66.9)#532 |
| 33. | Kapp Heights | 100.0% | 34.2%(+65.8)#34 | 33.1%(+66.9)#549 |
| 34. | Gouldsboro | 100.0% | 34.2%(+65.8)#35 | 33.1%(+66.9)#581 |
| 35. | Jerome | 100.0% | 34.2%(+65.8)#36 | 33.1%(+66.9)#584 |
| 36. | Snow Shoe Borough | 100.0% | 34.2%(+65.8)#37 | 33.1%(+66.9)#588 |
| 37. | North Philipsburg | 100.0% | 34.2%(+65.8)#38 | 33.1%(+66.9)#605 |
| 38. | Mount Morris | 100.0% | 34.2%(+65.8)#39 | 33.1%(+66.9)#611 |
| 39. | Revloc | 100.0% | 34.2%(+65.8)#40 | 33.1%(+66.9)#613 |
| 40. | Scalp Level Borough | 100.0% | 34.2%(+65.8)#41 | 33.1%(+66.9)#616 |
| 41. | Rossiter | 100.0% | 34.2%(+65.8)#42 | 33.1%(+66.9)#628 |
| 42. | Weedville | 100.0% | 34.2%(+65.8)#43 | 33.1%(+66.9)#639 |
| 43. | Emlenton Borough | 100.0% | 34.2%(+65.8)#44 | 33.1%(+66.9)#643 |
| 44. | Ulysses Borough | 100.0% | 34.2%(+65.8)#45 | 33.1%(+66.9)#657 |
| 45. | Wanamie | 100.0% | 34.2%(+65.8)#46 | 33.1%(+66.9)#659 |
| 46. | Salisbury Borough | 100.0% | 34.2%(+65.8)#47 | 33.1%(+66.9)#672 |
| 47. | Pardeesville | 100.0% | 34.2%(+65.8)#48 | 33.1%(+66.9)#695 |
| 48. | Dayton Borough | 100.0% | 34.2%(+65.8)#49 | 33.1%(+66.9)#716 |
| 49. | Foot Of Ten | 100.0% | 34.2%(+65.8)#50 | 33.1%(+66.9)#747 |
| 50. | Big Run Borough | 100.0% | 34.2%(+65.8)#51 | 33.1%(+66.9)#765 |
| 51. | Cairnbrook | 100.0% | 34.2%(+65.8)#52 | 33.1%(+66.9)#773 |
| 52. | Wall Borough | 100.0% | 34.2%(+65.8)#53 | 33.1%(+66.9)#781 |
| 53. | Wheatland Borough | 100.0% | 34.2%(+65.8)#54 | 33.1%(+66.9)#802 |
| 54. | Robinson | 100.0% | 34.2%(+65.8)#55 | 33.1%(+66.9)#817 |
| 55. | Sheppton | 100.0% | 34.2%(+65.8)#56 | 33.1%(+66.9)#840 |
| 56. | South Renovo Borough | 100.0% | 34.2%(+65.8)#57 | 33.1%(+66.9)#854 |
| 57. | Allenport Borough | 100.0% | 34.2%(+65.8)#58 | 33.1%(+66.9)#855 |
| 58. | West Waynesburg | 100.0% | 34.2%(+65.8)#59 | 33.1%(+66.9)#869 |
| 59. | Arnold City | 100.0% | 34.2%(+65.8)#60 | 33.1%(+66.9)#938 |
| 60. | Grassflat | 100.0% | 34.2%(+65.8)#61 | 33.1%(+66.9)#942 |
| 61. | Woodbury Borough | 100.0% | 34.2%(+65.8)#62 | 33.1%(+66.9)#969 |
| 62. | Millwood | 100.0% | 34.2%(+65.8)#63 | 33.1%(+66.9)#975 |
| 63. | Green Lane Borough | 100.0% | 34.2%(+65.8)#64 | 33.1%(+66.9)#995 |
| 64. | Greensboro Borough | 100.0% | 34.2%(+65.8)#65 | 33.1%(+66.9)#1,026 |
| 65. | Marklesburg Borough | 100.0% | 34.2%(+65.8)#66 | 33.1%(+66.9)#1,045 |
| 66. | Eau Claire Borough | 100.0% | 34.2%(+65.8)#67 | 33.1%(+66.9)#1,082 |
| 67. | Enon Valley Borough | 100.0% | 34.2%(+65.8)#68 | 33.1%(+66.9)#1,084 |
| 68. | Blandburg | 100.0% | 34.2%(+65.8)#69 | 33.1%(+66.9)#1,101 |
| 69. | Vanderbilt Borough | 100.0% | 34.2%(+65.8)#70 | 33.1%(+66.9)#1,106 |
| 70. | Bethel | 100.0% | 34.2%(+65.8)#71 | 33.1%(+66.9)#1,111 |
| 71. | West Falls | 100.0% | 34.2%(+65.8)#72 | 33.1%(+66.9)#1,119 |
| 72. | East Altoona | 100.0% | 34.2%(+65.8)#73 | 33.1%(+66.9)#1,124 |
| 73. | Rehrersburg | 100.0% | 34.2%(+65.8)#74 | 33.1%(+66.9)#1,134 |
| 74. | West Liberty Borough | 100.0% | 34.2%(+65.8)#75 | 33.1%(+66.9)#1,137 |
| 75. | Thompson Borough | 100.0% | 34.2%(+65.8)#76 | 33.1%(+66.9)#1,154 |
| 76. | Aaronsburg Cdp Washington County | 100.0% | 34.2%(+65.8)#77 | 33.1%(+66.9)#1,157 |
| 77. | Kistler Borough | 100.0% | 34.2%(+65.8)#78 | 33.1%(+66.9)#1,159 |
| 78. | Foxburg Borough | 100.0% | 34.2%(+65.8)#79 | 33.1%(+66.9)#1,161 |
| 79. | Goodville | 100.0% | 34.2%(+65.8)#80 | 33.1%(+66.9)#1,177 |
| 80. | Ackermanville | 100.0% | 34.2%(+65.8)#81 | 33.1%(+66.9)#1,180 |
| 81. | Creekside Borough | 100.0% | 34.2%(+65.8)#82 | 33.1%(+66.9)#1,194 |
| 82. | Youngstown Borough | 100.0% | 34.2%(+65.8)#83 | 33.1%(+66.9)#1,264 |
| 83. | Mckee | 100.0% | 34.2%(+65.8)#84 | 33.1%(+66.9)#1,272 |
| 84. | New Columbus Borough | 100.0% | 34.2%(+65.8)#85 | 33.1%(+66.9)#1,282 |
| 85. | Cumbola | 100.0% | 34.2%(+65.8)#86 | 33.1%(+66.9)#1,286 |
| 86. | Jefferson Borough Greene County | 100.0% | 34.2%(+65.8)#87 | 33.1%(+66.9)#1,293 |
| 87. | Julian | 100.0% | 34.2%(+65.8)#88 | 33.1%(+66.9)#1,305 |
| 88. | Crown | 100.0% | 34.2%(+65.8)#89 | 33.1%(+66.9)#1,353 |
| 89. | Cove Forge | 100.0% | 34.2%(+65.8)#90 | 33.1%(+66.9)#1,362 |
| 90. | Georgetown Borough | 100.0% | 34.2%(+65.8)#91 | 33.1%(+66.9)#1,391 |
| 91. | Ashville Borough | 100.0% | 34.2%(+65.8)#92 | 33.1%(+66.9)#1,408 |
| 92. | Sweden Valley | 100.0% | 34.2%(+65.8)#93 | 33.1%(+66.9)#1,410 |
| 93. | Spring Drive Mobile Home Park | 100.0% | 34.2%(+65.8)#94 | 33.1%(+66.9)#1,438 |
| 94. | Bear Lake Borough | 100.0% | 34.2%(+65.8)#95 | 33.1%(+66.9)#1,442 |
| 95. | Albrightsville | 100.0% | 34.2%(+65.8)#96 | 33.1%(+66.9)#1,443 |
| 96. | Atwood Borough | 100.0% | 34.2%(+65.8)#97 | 33.1%(+66.9)#1,487 |
| 97. | Brave | 100.0% | 34.2%(+65.8)#98 | 33.1%(+66.9)#1,498 |
| 98. | Alverda | 100.0% | 34.2%(+65.8)#99 | 33.1%(+66.9)#1,527 |
| 99. | Timblin Borough | 100.0% | 34.2%(+65.8)#100 | 33.1%(+66.9)#1,571 |
| 100. | Wellersburg Borough | 100.0% | 34.2%(+65.8)#101 | 33.1%(+66.9)#1,592 |
Common Questions
What are the Top 10 Cities with the Highest Poverty Level Among Single Mothers in Pennsylvania?
Top 10 Cities with the Highest Poverty Level Among Single Mothers in Pennsylvania are:
#1
100.0%
#2
100.0%
#3
100.0%
#4
100.0%
#5
100.0%
#6
100.0%
#7
100.0%
#8
100.0%
#9
100.0%
#10
100.0%
What city has the Highest Poverty Level Among Single Mothers in Pennsylvania?
Amity Gardens has the Highest Poverty Level Among Single Mothers in Pennsylvania with 100.0%.
What is the Poverty Level Among Single Mothers in the State of Pennsylvania?
Poverty Level Among Single Mothers in Pennsylvania is 34.2%.
What is the Poverty Level Among Single Mothers in the United States?
Poverty Level Among Single Mothers in the United States is 33.1%.