Cities with the Highest Poverty Level Among Single Mothers in Mississippi
RELATED REPORTS & OPTIONS
Highest Poverty | Single Mother
Mississippi
Compare Cities
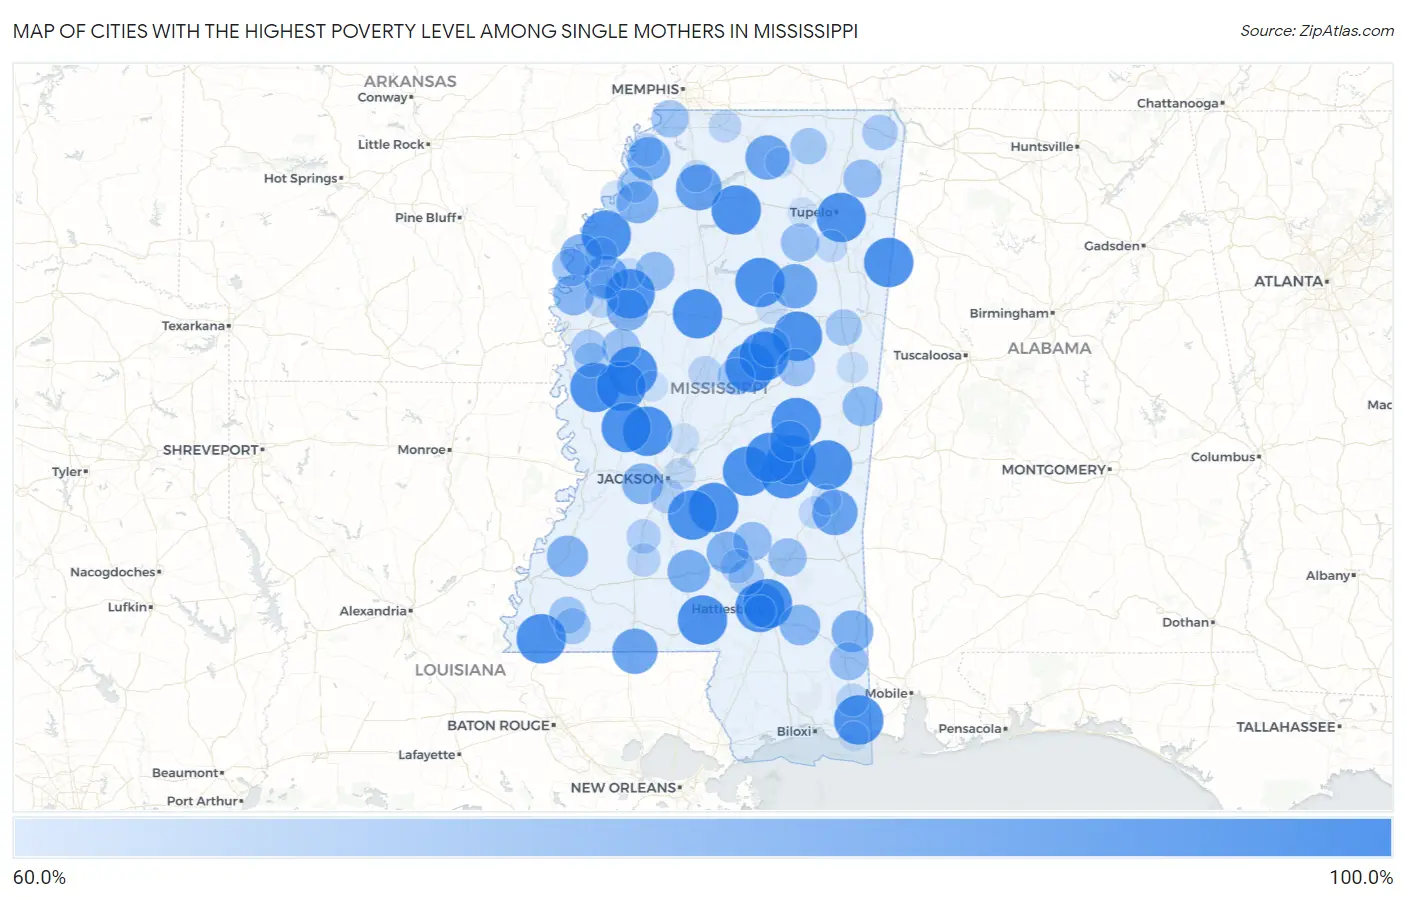
Map of Cities with the Highest Poverty Level Among Single Mothers in Mississippi
0.0%
100.0%
Cities with the Highest Poverty Level Among Single Mothers in Mississippi
| City | Single Mother Poverty | vs State | vs National | |
| 1. | Forest | 100.0% | 45.9%(+54.1)#1 | 33.1%(+66.9)#17 |
| 2. | Newton | 100.0% | 45.9%(+54.1)#2 | 33.1%(+66.9)#68 |
| 3. | Decatur | 100.0% | 45.9%(+54.1)#3 | 33.1%(+66.9)#133 |
| 4. | Arnold Line | 100.0% | 45.9%(+54.1)#4 | 33.1%(+66.9)#180 |
| 5. | Glendale | 100.0% | 45.9%(+54.1)#5 | 33.1%(+66.9)#232 |
| 6. | Nellieburg | 100.0% | 45.9%(+54.1)#6 | 33.1%(+66.9)#277 |
| 7. | Conehatta | 100.0% | 45.9%(+54.1)#7 | 33.1%(+66.9)#305 |
| 8. | Woodville | 100.0% | 45.9%(+54.1)#8 | 33.1%(+66.9)#345 |
| 9. | Plantersville | 100.0% | 45.9%(+54.1)#9 | 33.1%(+66.9)#464 |
| 10. | Helena | 100.0% | 45.9%(+54.1)#10 | 33.1%(+66.9)#607 |
| 11. | Anguilla | 100.0% | 45.9%(+54.1)#11 | 33.1%(+66.9)#687 |
| 12. | Foxworth | 100.0% | 45.9%(+54.1)#12 | 33.1%(+66.9)#693 |
| 13. | Puckett | 100.0% | 45.9%(+54.1)#13 | 33.1%(+66.9)#915 |
| 14. | North Carrollton | 100.0% | 45.9%(+54.1)#14 | 33.1%(+66.9)#956 |
| 15. | Tucker | 100.0% | 45.9%(+54.1)#15 | 33.1%(+66.9)#994 |
| 16. | Ethel | 100.0% | 45.9%(+54.1)#16 | 33.1%(+66.9)#1,010 |
| 17. | Bentonia | 100.0% | 45.9%(+54.1)#17 | 33.1%(+66.9)#1,054 |
| 18. | Harperville | 100.0% | 45.9%(+54.1)#18 | 33.1%(+66.9)#1,067 |
| 19. | De Soto | 100.0% | 45.9%(+54.1)#19 | 33.1%(+66.9)#1,207 |
| 20. | Taylor | 100.0% | 45.9%(+54.1)#20 | 33.1%(+66.9)#1,268 |
| 21. | Alligator | 100.0% | 45.9%(+54.1)#21 | 33.1%(+66.9)#1,278 |
| 22. | Bond | 100.0% | 45.9%(+54.1)#23 | 33.1%(+66.9)#1,325 |
| 23. | Glen Allan | 100.0% | 45.9%(+54.1)#24 | 33.1%(+66.9)#1,326 |
| 24. | Bethlehem | 100.0% | 45.9%(+54.1)#25 | 33.1%(+66.9)#1,349 |
| 25. | Braxton | 100.0% | 45.9%(+54.1)#26 | 33.1%(+66.9)#1,367 |
| 26. | Silver City | 100.0% | 45.9%(+54.1)#27 | 33.1%(+66.9)#1,420 |
| 27. | Doddsville | 100.0% | 45.9%(+54.1)#28 | 33.1%(+66.9)#1,428 |
| 28. | Sturgis | 100.0% | 45.9%(+54.1)#29 | 33.1%(+66.9)#1,500 |
| 29. | Gattman | 100.0% | 45.9%(+54.1)#30 | 33.1%(+66.9)#1,558 |
| 30. | Louise | 100.0% | 45.9%(+54.1)#31 | 33.1%(+66.9)#1,629 |
| 31. | Winterville | 100.0% | 45.9%(+54.1)#32 | 33.1%(+66.9)#1,737 |
| 32. | Slate Springs | 100.0% | 45.9%(+54.1)#33 | 33.1%(+66.9)#1,841 |
| 33. | Mccool | 100.0% | 45.9%(+54.1)#34 | 33.1%(+66.9)#1,883 |
| 34. | Satartia | 100.0% | 45.9%(+54.1)#35 | 33.1%(+66.9)#1,929 |
| 35. | Sardis | 93.2% | 45.9%(+47.3)#36 | 33.1%(+60.1)#2,061 |
| 36. | Quitman | 92.4% | 45.9%(+46.4)#37 | 33.1%(+59.2)#2,080 |
| 37. | Osyka | 92.3% | 45.9%(+46.4)#38 | 33.1%(+59.2)#2,086 |
| 38. | Mantee | 90.9% | 45.9%(+45.0)#39 | 33.1%(+57.8)#2,134 |
| 39. | Potts Camp | 90.6% | 45.9%(+44.7)#40 | 33.1%(+57.5)#2,143 |
| 40. | Renova | 90.2% | 45.9%(+44.3)#41 | 33.1%(+57.1)#2,155 |
| 41. | White Oak | 88.9% | 45.9%(+42.9)#42 | 33.1%(+55.8)#2,212 |
| 42. | Silver Creek | 87.5% | 45.9%(+41.6)#43 | 33.1%(+54.4)#2,296 |
| 43. | Leakesville | 86.2% | 45.9%(+40.3)#44 | 33.1%(+53.1)#2,341 |
| 44. | Jonestown | 86.1% | 45.9%(+40.2)#45 | 33.1%(+53.0)#2,347 |
| 45. | Gunnison | 86.0% | 45.9%(+40.1)#46 | 33.1%(+52.9)#2,352 |
| 46. | Mount Olive | 85.9% | 45.9%(+40.0)#47 | 33.1%(+52.8)#2,357 |
| 47. | Sunflower | 85.8% | 45.9%(+39.9)#48 | 33.1%(+52.7)#2,361 |
| 48. | Fayette | 85.2% | 45.9%(+39.3)#49 | 33.1%(+52.1)#2,422 |
| 49. | Raymond | 84.6% | 45.9%(+38.7)#50 | 33.1%(+51.5)#2,450 |
| 50. | Union | 84.5% | 45.9%(+38.6)#51 | 33.1%(+51.4)#2,469 |
| 51. | New Augusta | 84.0% | 45.9%(+38.1)#52 | 33.1%(+50.9)#2,492 |
| 52. | Benoit | 83.9% | 45.9%(+37.9)#53 | 33.1%(+50.7)#2,499 |
| 53. | Weir | 82.9% | 45.9%(+36.9)#54 | 33.1%(+49.7)#2,574 |
| 54. | Scooba | 82.5% | 45.9%(+36.6)#55 | 33.1%(+49.4)#2,588 |
| 55. | Glendora | 81.0% | 45.9%(+35.0)#56 | 33.1%(+47.8)#2,701 |
| 56. | Taylorsville | 80.5% | 45.9%(+34.6)#57 | 33.1%(+47.4)#2,720 |
| 57. | New Houlka | 80.0% | 45.9%(+34.1)#58 | 33.1%(+46.9)#2,751 |
| 58. | Marietta | 80.0% | 45.9%(+34.1)#59 | 33.1%(+46.9)#2,786 |
| 59. | Laurel | 79.8% | 45.9%(+33.9)#60 | 33.1%(+46.7)#2,800 |
| 60. | Lucedale | 79.6% | 45.9%(+33.6)#61 | 33.1%(+46.4)#2,816 |
| 61. | Rosedale | 79.2% | 45.9%(+33.2)#62 | 33.1%(+46.0)#2,840 |
| 62. | Isola | 79.1% | 45.9%(+33.1)#63 | 33.1%(+45.9)#2,844 |
| 63. | Louisville | 78.4% | 45.9%(+32.5)#64 | 33.1%(+45.3)#2,893 |
| 64. | Walls | 78.3% | 45.9%(+32.3)#65 | 33.1%(+45.1)#2,900 |
| 65. | Kosciusko | 77.4% | 45.9%(+31.5)#66 | 33.1%(+44.3)#2,980 |
| 66. | Crosby | 76.9% | 45.9%(+31.0)#67 | 33.1%(+43.8)#3,023 |
| 67. | Artesia | 76.5% | 45.9%(+30.5)#68 | 33.1%(+43.3)#3,059 |
| 68. | Ripley | 76.4% | 45.9%(+30.4)#69 | 33.1%(+43.2)#3,066 |
| 69. | Gloster | 75.9% | 45.9%(+30.0)#70 | 33.1%(+42.8)#3,102 |
| 70. | Burnsville | 75.0% | 45.9%(+29.1)#71 | 33.1%(+41.9)#3,177 |
| 71. | Seminary | 75.0% | 45.9%(+29.1)#72 | 33.1%(+41.9)#3,211 |
| 72. | Arcola | 75.0% | 45.9%(+29.1)#73 | 33.1%(+41.9)#3,229 |
| 73. | Lula | 75.0% | 45.9%(+29.1)#74 | 33.1%(+41.9)#3,231 |
| 74. | Hollandale | 73.8% | 45.9%(+27.8)#75 | 33.1%(+40.6)#3,320 |
| 75. | Cleary | 73.1% | 45.9%(+27.1)#76 | 33.1%(+39.9)#3,382 |
| 76. | Hazlehurst | 72.9% | 45.9%(+27.0)#77 | 33.1%(+39.8)#3,397 |
| 77. | Collins | 72.7% | 45.9%(+26.8)#78 | 33.1%(+39.6)#3,408 |
| 78. | Wesson | 71.4% | 45.9%(+25.5)#79 | 33.1%(+38.3)#3,559 |
| 79. | North Tunica | 71.1% | 45.9%(+25.1)#80 | 33.1%(+37.9)#3,634 |
| 80. | Shaw | 70.8% | 45.9%(+24.9)#81 | 33.1%(+37.7)#3,657 |
| 81. | Durant | 70.7% | 45.9%(+24.8)#82 | 33.1%(+37.6)#3,668 |
| 82. | Wade | 70.7% | 45.9%(+24.7)#83 | 33.1%(+37.5)#3,670 |
| 83. | Shelby | 70.4% | 45.9%(+24.5)#84 | 33.1%(+37.3)#3,692 |
| 84. | Byhalia | 69.8% | 45.9%(+23.8)#85 | 33.1%(+36.6)#3,768 |
| 85. | Pachuta | 69.2% | 45.9%(+23.3)#86 | 33.1%(+36.1)#3,832 |
| 86. | Okolona | 69.1% | 45.9%(+23.2)#87 | 33.1%(+36.0)#3,842 |
| 87. | West Hattiesburg | 69.1% | 45.9%(+23.1)#88 | 33.1%(+35.9)#3,845 |
| 88. | Como | 68.9% | 45.9%(+23.0)#89 | 33.1%(+35.8)#3,854 |
| 89. | Cleveland | 68.8% | 45.9%(+22.9)#90 | 33.1%(+35.7)#3,859 |
| 90. | Flowood | 68.3% | 45.9%(+22.4)#91 | 33.1%(+35.2)#3,916 |
| 91. | Friars Point | 67.6% | 45.9%(+21.6)#92 | 33.1%(+34.5)#3,986 |
| 92. | Macon | 67.5% | 45.9%(+21.6)#93 | 33.1%(+34.4)#3,989 |
| 93. | Drew | 67.5% | 45.9%(+21.6)#94 | 33.1%(+34.4)#3,991 |
| 94. | Canton | 66.8% | 45.9%(+20.9)#95 | 33.1%(+33.7)#4,040 |
| 95. | Eupora | 66.7% | 45.9%(+20.7)#96 | 33.1%(+33.5)#4,055 |
| 96. | Stonewall | 66.7% | 45.9%(+20.7)#97 | 33.1%(+33.5)#4,094 |
| 97. | Eden | 66.7% | 45.9%(+20.7)#98 | 33.1%(+33.5)#4,204 |
| 98. | Hickory Flat | 65.9% | 45.9%(+20.0)#99 | 33.1%(+32.8)#4,301 |
| 99. | Pontotoc | 65.6% | 45.9%(+19.7)#100 | 33.1%(+32.5)#4,319 |
| 100. | Pascagoula | 65.4% | 45.9%(+19.5)#101 | 33.1%(+32.3)#4,341 |
Common Questions
What are the Top 10 Cities with the Highest Poverty Level Among Single Mothers in Mississippi?
Top 10 Cities with the Highest Poverty Level Among Single Mothers in Mississippi are:
#1
100.0%
#2
100.0%
#3
100.0%
#4
100.0%
#5
100.0%
#6
100.0%
#7
100.0%
#8
100.0%
#9
100.0%
#10
100.0%
What city has the Highest Poverty Level Among Single Mothers in Mississippi?
Forest has the Highest Poverty Level Among Single Mothers in Mississippi with 100.0%.
What is the Poverty Level Among Single Mothers in the State of Mississippi?
Poverty Level Among Single Mothers in Mississippi is 45.9%.
What is the Poverty Level Among Single Mothers in the United States?
Poverty Level Among Single Mothers in the United States is 33.1%.