Cities with the Highest Poverty Level Among Single Mothers in New Mexico
RELATED REPORTS & OPTIONS
Highest Poverty | Single Mother
New Mexico
Compare Cities
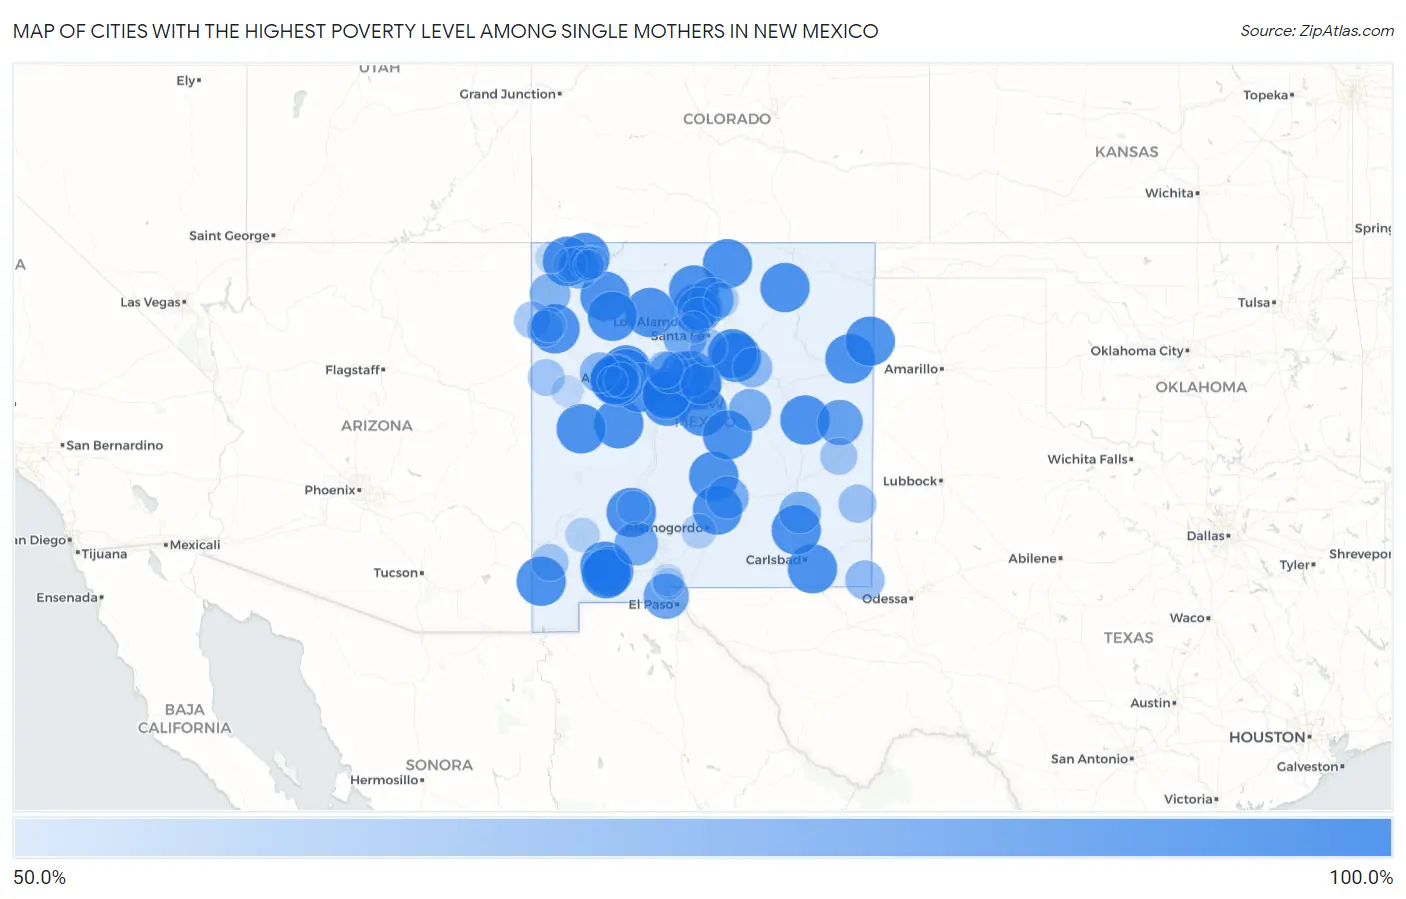
Map of Cities with the Highest Poverty Level Among Single Mothers in New Mexico
0.0%
100.0%
Cities with the Highest Poverty Level Among Single Mothers in New Mexico
| City | Single Mother Poverty | vs State | vs National | |
| 1. | Kirtland Afb | 100.0% | 38.4%(+61.6)#1 | 33.1%(+66.9)#40 |
| 2. | Flora Vista | 100.0% | 38.4%(+61.6)#2 | 33.1%(+66.9)#130 |
| 3. | Questa | 100.0% | 38.4%(+61.6)#3 | 33.1%(+66.9)#143 |
| 4. | Angustura | 100.0% | 38.4%(+61.6)#4 | 33.1%(+66.9)#169 |
| 5. | Keeler Farm | 100.0% | 38.4%(+61.6)#5 | 33.1%(+66.9)#192 |
| 6. | Barton | 100.0% | 38.4%(+61.6)#6 | 33.1%(+66.9)#227 |
| 7. | Loving | 100.0% | 38.4%(+61.6)#7 | 33.1%(+66.9)#253 |
| 8. | Fort Sumner | 100.0% | 38.4%(+61.6)#8 | 33.1%(+66.9)#319 |
| 9. | Indian Hills | 100.0% | 38.4%(+61.6)#9 | 33.1%(+66.9)#321 |
| 10. | El Duende | 100.0% | 38.4%(+61.6)#10 | 33.1%(+66.9)#349 |
| 11. | Alamo | 100.0% | 38.4%(+61.6)#11 | 33.1%(+66.9)#361 |
| 12. | Carrizozo | 100.0% | 38.4%(+61.6)#12 | 33.1%(+66.9)#381 |
| 13. | El Rito | 100.0% | 38.4%(+61.6)#13 | 33.1%(+66.9)#415 |
| 14. | Logan | 100.0% | 38.4%(+61.6)#14 | 33.1%(+66.9)#442 |
| 15. | Springer | 100.0% | 38.4%(+61.6)#15 | 33.1%(+66.9)#448 |
| 16. | Cedar Crest | 100.0% | 38.4%(+61.6)#16 | 33.1%(+66.9)#457 |
| 17. | Mescalero | 100.0% | 38.4%(+61.6)#17 | 33.1%(+66.9)#469 |
| 18. | Ventura | 100.0% | 38.4%(+61.6)#18 | 33.1%(+66.9)#522 |
| 19. | Williamsburg | 100.0% | 38.4%(+61.6)#19 | 33.1%(+66.9)#530 |
| 20. | Isleta | 100.0% | 38.4%(+61.6)#20 | 33.1%(+66.9)#562 |
| 21. | Tortugas | 100.0% | 38.4%(+61.6)#21 | 33.1%(+66.9)#590 |
| 22. | La Hacienda | 100.0% | 38.4%(+61.6)#22 | 33.1%(+66.9)#636 |
| 23. | Brimhall Nizhoni | 100.0% | 38.4%(+61.6)#23 | 33.1%(+66.9)#713 |
| 24. | Monterey Park | 100.0% | 38.4%(+61.6)#24 | 33.1%(+66.9)#717 |
| 25. | Morningside | 100.0% | 38.4%(+61.6)#25 | 33.1%(+66.9)#726 |
| 26. | Cuba | 100.0% | 38.4%(+61.6)#26 | 33.1%(+66.9)#752 |
| 27. | Seboyeta | 100.0% | 38.4%(+61.6)#27 | 33.1%(+66.9)#792 |
| 28. | Placitas Cdp Dona Ana County | 100.0% | 38.4%(+61.6)#28 | 33.1%(+66.9)#793 |
| 29. | Paguate | 100.0% | 38.4%(+61.6)#29 | 33.1%(+66.9)#833 |
| 30. | Totah Vista | 100.0% | 38.4%(+61.6)#30 | 33.1%(+66.9)#865 |
| 31. | Nenahnezad | 100.0% | 38.4%(+61.6)#31 | 33.1%(+66.9)#883 |
| 32. | Highland Meadows | 100.0% | 38.4%(+61.6)#32 | 33.1%(+66.9)#932 |
| 33. | Cotton City | 100.0% | 38.4%(+61.6)#33 | 33.1%(+66.9)#951 |
| 34. | Seama | 100.0% | 38.4%(+61.6)#34 | 33.1%(+66.9)#966 |
| 35. | Willard | 100.0% | 38.4%(+61.6)#35 | 33.1%(+66.9)#1,031 |
| 36. | Homer C Jones | 100.0% | 38.4%(+61.6)#36 | 33.1%(+66.9)#1,048 |
| 37. | Ribera | 100.0% | 38.4%(+61.6)#37 | 33.1%(+66.9)#1,077 |
| 38. | Nageezi | 100.0% | 38.4%(+61.6)#38 | 33.1%(+66.9)#1,093 |
| 39. | Soham | 100.0% | 38.4%(+61.6)#39 | 33.1%(+66.9)#1,295 |
| 40. | Jamestown | 100.0% | 38.4%(+61.6)#41 | 33.1%(+66.9)#1,338 |
| 41. | North Acomita Village | 100.0% | 38.4%(+61.6)#42 | 33.1%(+66.9)#1,339 |
| 42. | Pueblo Pintado | 100.0% | 38.4%(+61.6)#43 | 33.1%(+66.9)#1,375 |
| 43. | Chical | 100.0% | 38.4%(+61.6)#44 | 33.1%(+66.9)#1,390 |
| 44. | Pie Town | 100.0% | 38.4%(+61.6)#45 | 33.1%(+66.9)#1,493 |
| 45. | Medanales | 100.0% | 38.4%(+61.6)#46 | 33.1%(+66.9)#1,519 |
| 46. | Nara Visa | 100.0% | 38.4%(+61.6)#47 | 33.1%(+66.9)#1,598 |
| 47. | South Acomita Village | 100.0% | 38.4%(+61.6)#48 | 33.1%(+66.9)#1,670 |
| 48. | Corona | 100.0% | 38.4%(+61.6)#49 | 33.1%(+66.9)#1,787 |
| 49. | Manuelito | 100.0% | 38.4%(+61.6)#50 | 33.1%(+66.9)#1,938 |
| 50. | Peralta | 96.9% | 38.4%(+58.4)#51 | 33.1%(+63.7)#1,982 |
| 51. | Edgewood | 92.2% | 38.4%(+53.8)#52 | 33.1%(+59.1)#2,090 |
| 52. | Melrose | 90.9% | 38.4%(+52.5)#53 | 33.1%(+57.8)#2,133 |
| 53. | Santa Teresa | 90.7% | 38.4%(+52.2)#54 | 33.1%(+57.5)#2,142 |
| 54. | Dixon | 88.7% | 38.4%(+50.3)#55 | 33.1%(+55.6)#2,230 |
| 55. | Hatch | 86.2% | 38.4%(+47.8)#56 | 33.1%(+53.1)#2,342 |
| 56. | Cochiti Lake | 85.7% | 38.4%(+47.3)#57 | 33.1%(+52.6)#2,381 |
| 57. | Chamita | 85.0% | 38.4%(+46.6)#58 | 33.1%(+51.9)#2,433 |
| 58. | Ruidoso Downs | 83.5% | 38.4%(+45.0)#59 | 33.1%(+50.3)#2,507 |
| 59. | Napi Headquarters | 83.3% | 38.4%(+44.9)#60 | 33.1%(+50.2)#2,518 |
| 60. | Vaughn | 83.3% | 38.4%(+44.9)#61 | 33.1%(+50.2)#2,523 |
| 61. | Hagerman | 82.6% | 38.4%(+44.2)#62 | 33.1%(+49.5)#2,583 |
| 62. | North Valley | 82.2% | 38.4%(+43.7)#63 | 33.1%(+49.1)#2,618 |
| 63. | Moriarty | 81.5% | 38.4%(+43.1)#64 | 33.1%(+48.4)#2,663 |
| 64. | Becenti | 81.2% | 38.4%(+42.8)#65 | 33.1%(+48.1)#2,682 |
| 65. | Prewitt | 81.2% | 38.4%(+42.7)#66 | 33.1%(+48.0)#2,687 |
| 66. | Newcomb | 80.0% | 38.4%(+41.6)#67 | 33.1%(+46.9)#2,759 |
| 67. | Grants | 79.2% | 38.4%(+40.8)#68 | 33.1%(+46.1)#2,835 |
| 68. | Tecolotito | 77.1% | 38.4%(+38.7)#69 | 33.1%(+44.0)#2,995 |
| 69. | Jal | 76.6% | 38.4%(+38.1)#70 | 33.1%(+43.4)#3,046 |
| 70. | Pinedale | 76.3% | 38.4%(+37.9)#71 | 33.1%(+43.2)#3,070 |
| 71. | Tatum | 73.5% | 38.4%(+35.1)#72 | 33.1%(+40.4)#3,349 |
| 72. | Ojo Encino | 73.3% | 38.4%(+34.9)#73 | 33.1%(+40.2)#3,370 |
| 73. | Paradise Hills | 72.0% | 38.4%(+33.5)#74 | 33.1%(+38.8)#3,520 |
| 74. | Navajo | 71.7% | 38.4%(+33.3)#75 | 33.1%(+38.6)#3,541 |
| 75. | Eldorado At Santa Fe | 71.4% | 38.4%(+33.0)#76 | 33.1%(+38.3)#3,553 |
| 76. | Glen Acres | 71.4% | 38.4%(+33.0)#77 | 33.1%(+38.3)#3,591 |
| 77. | Elida | 71.4% | 38.4%(+33.0)#78 | 33.1%(+38.3)#3,603 |
| 78. | Black Rock | 70.7% | 38.4%(+32.2)#79 | 33.1%(+37.6)#3,669 |
| 79. | San Jose Cdp Rio Arriba County | 70.0% | 38.4%(+31.6)#80 | 33.1%(+36.9)#3,731 |
| 80. | Nakaibito | 70.0% | 38.4%(+31.6)#81 | 33.1%(+36.9)#3,753 |
| 81. | Crouch Mesa | 69.8% | 38.4%(+31.4)#82 | 33.1%(+36.7)#3,764 |
| 82. | Lee Acres | 68.3% | 38.4%(+29.9)#83 | 33.1%(+35.2)#3,917 |
| 83. | Paraje | 67.4% | 38.4%(+28.9)#84 | 33.1%(+34.2)#4,005 |
| 84. | Santa Clara Pueblo | 66.7% | 38.4%(+28.2)#85 | 33.1%(+33.5)#4,088 |
| 85. | Picuris Pueblo | 66.7% | 38.4%(+28.2)#86 | 33.1%(+33.5)#4,249 |
| 86. | Holloman Afb | 66.2% | 38.4%(+27.7)#87 | 33.1%(+33.0)#4,276 |
| 87. | Tohatchi | 65.9% | 38.4%(+27.5)#88 | 33.1%(+32.8)#4,302 |
| 88. | Santa Clara | 65.3% | 38.4%(+26.9)#89 | 33.1%(+32.2)#4,353 |
| 89. | Ojo Amarillo | 65.2% | 38.4%(+26.8)#90 | 33.1%(+32.1)#4,364 |
| 90. | Borrego Pass | 63.6% | 38.4%(+25.2)#91 | 33.1%(+30.5)#4,604 |
| 91. | Truth Or Consequences | 62.7% | 38.4%(+24.3)#92 | 33.1%(+29.6)#4,707 |
| 92. | Bloomfield | 61.1% | 38.4%(+22.7)#93 | 33.1%(+28.0)#4,943 |
| 93. | Vado | 60.7% | 38.4%(+22.2)#94 | 33.1%(+27.5)#4,999 |
| 94. | White Rock | 60.6% | 38.4%(+22.2)#95 | 33.1%(+27.5)#5,005 |
| 95. | Shiprock | 60.2% | 38.4%(+21.7)#96 | 33.1%(+27.0)#5,057 |
| 96. | Berino | 60.0% | 38.4%(+21.6)#97 | 33.1%(+26.9)#5,084 |
| 97. | Pinehill | 60.0% | 38.4%(+21.6)#98 | 33.1%(+26.9)#5,131 |
| 98. | Haystack | 60.0% | 38.4%(+21.6)#99 | 33.1%(+26.9)#5,163 |
| 99. | West Hammond | 56.0% | 38.4%(+17.6)#100 | 33.1%(+22.9)#5,754 |
| 100. | Skyline Ganipa | 55.6% | 38.4%(+17.1)#101 | 33.1%(+22.4)#5,812 |
Common Questions
What are the Top 10 Cities with the Highest Poverty Level Among Single Mothers in New Mexico?
Top 10 Cities with the Highest Poverty Level Among Single Mothers in New Mexico are:
#1
100.0%
#2
100.0%
#3
100.0%
#4
100.0%
#5
100.0%
#6
100.0%
#7
100.0%
#8
100.0%
#9
100.0%
#10
100.0%
What city has the Highest Poverty Level Among Single Mothers in New Mexico?
Flora Vista has the Highest Poverty Level Among Single Mothers in New Mexico with 100.0%.
What is the Poverty Level Among Single Mothers in the State of New Mexico?
Poverty Level Among Single Mothers in New Mexico is 38.4%.
What is the Poverty Level Among Single Mothers in the United States?
Poverty Level Among Single Mothers in the United States is 33.1%.