Cities with the Highest Poverty Level Among Single Mothers in Kentucky
RELATED REPORTS & OPTIONS
Highest Poverty | Single Mother
Kentucky
Compare Cities
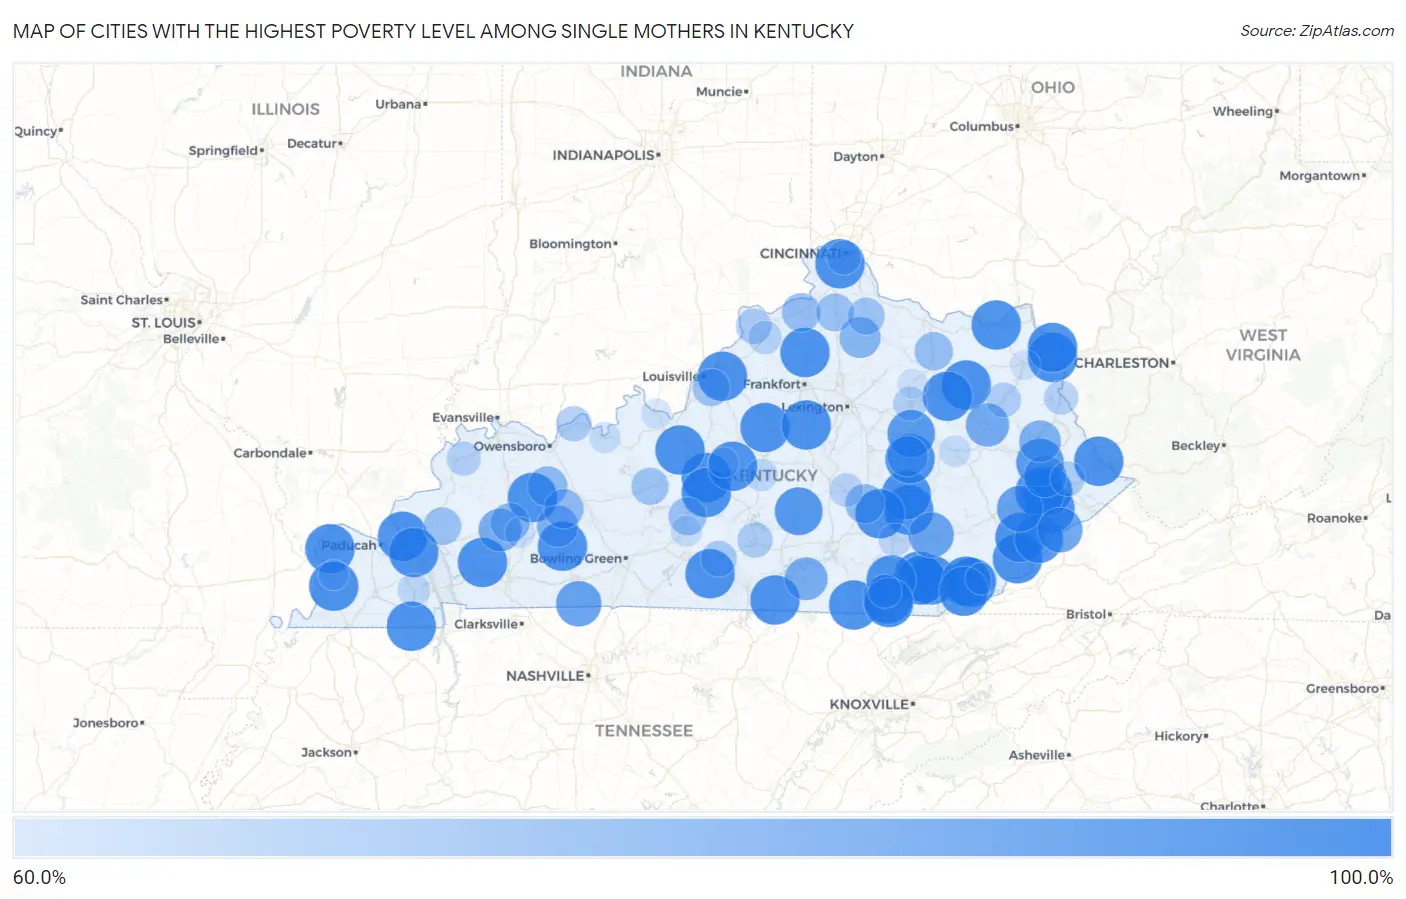
Map of Cities with the Highest Poverty Level Among Single Mothers in Kentucky
0.0%
100.0%
Cities with the Highest Poverty Level Among Single Mothers in Kentucky
| City | Single Mother Poverty | vs State | vs National | |
| 1. | Morehead | 100.0% | 41.8%(+58.2)#1 | 33.1%(+66.9)#11 |
| 2. | Hodgenville | 100.0% | 41.8%(+58.2)#2 | 33.1%(+66.9)#63 |
| 3. | Crestview Hills | 100.0% | 41.8%(+58.2)#3 | 33.1%(+66.9)#65 |
| 4. | Barbourville | 100.0% | 41.8%(+58.2)#4 | 33.1%(+66.9)#67 |
| 5. | Rineyville | 100.0% | 41.8%(+58.2)#5 | 33.1%(+66.9)#74 |
| 6. | Cumberland | 100.0% | 41.8%(+58.2)#6 | 33.1%(+66.9)#127 |
| 7. | Albany | 100.0% | 41.8%(+58.2)#7 | 33.1%(+66.9)#138 |
| 8. | Pine Knot | 100.0% | 41.8%(+58.2)#8 | 33.1%(+66.9)#240 |
| 9. | Annville | 100.0% | 41.8%(+58.2)#9 | 33.1%(+66.9)#324 |
| 10. | Cannonsburg | 100.0% | 41.8%(+58.2)#10 | 33.1%(+66.9)#383 |
| 11. | South Wallins | 100.0% | 41.8%(+58.2)#11 | 33.1%(+66.9)#413 |
| 12. | Philpot | 100.0% | 41.8%(+58.2)#12 | 33.1%(+66.9)#417 |
| 13. | Bellemeade | 100.0% | 41.8%(+58.2)#13 | 33.1%(+66.9)#441 |
| 14. | Garrison | 100.0% | 41.8%(+58.2)#14 | 33.1%(+66.9)#473 |
| 15. | Flat Lick | 100.0% | 41.8%(+58.2)#15 | 33.1%(+66.9)#475 |
| 16. | Mckee | 100.0% | 41.8%(+58.2)#16 | 33.1%(+66.9)#489 |
| 17. | Wheelwright | 100.0% | 41.8%(+58.2)#17 | 33.1%(+66.9)#497 |
| 18. | Ironville | 100.0% | 41.8%(+58.2)#18 | 33.1%(+66.9)#571 |
| 19. | Magnolia | 100.0% | 41.8%(+58.2)#19 | 33.1%(+66.9)#602 |
| 20. | Artemus | 100.0% | 41.8%(+58.2)#20 | 33.1%(+66.9)#610 |
| 21. | Ravenna | 100.0% | 41.8%(+58.2)#21 | 33.1%(+66.9)#644 |
| 22. | Chaplin | 100.0% | 41.8%(+58.2)#22 | 33.1%(+66.9)#697 |
| 23. | Barlow | 100.0% | 41.8%(+58.2)#23 | 33.1%(+66.9)#757 |
| 24. | Emlyn | 100.0% | 41.8%(+58.2)#24 | 33.1%(+66.9)#760 |
| 25. | Mcdowell | 100.0% | 41.8%(+58.2)#25 | 33.1%(+66.9)#790 |
| 26. | Hazel | 100.0% | 41.8%(+58.2)#26 | 33.1%(+66.9)#874 |
| 27. | Coldiron | 100.0% | 41.8%(+58.2)#27 | 33.1%(+66.9)#892 |
| 28. | Cerulean | 100.0% | 41.8%(+58.2)#28 | 33.1%(+66.9)#920 |
| 29. | Sacramento | 100.0% | 41.8%(+58.2)#29 | 33.1%(+66.9)#928 |
| 30. | Salt Lick | 100.0% | 41.8%(+58.2)#30 | 33.1%(+66.9)#993 |
| 31. | Rockholds | 100.0% | 41.8%(+58.2)#31 | 33.1%(+66.9)#1,008 |
| 32. | South Williamson | 100.0% | 41.8%(+58.2)#32 | 33.1%(+66.9)#1,014 |
| 33. | Van Lear | 100.0% | 41.8%(+58.2)#33 | 33.1%(+66.9)#1,047 |
| 34. | Wayland | 100.0% | 41.8%(+58.2)#34 | 33.1%(+66.9)#1,079 |
| 35. | Pathfork | 100.0% | 41.8%(+58.2)#35 | 33.1%(+66.9)#1,139 |
| 36. | Summer Shade | 100.0% | 41.8%(+58.2)#36 | 33.1%(+66.9)#1,151 |
| 37. | Smithland | 100.0% | 41.8%(+58.2)#37 | 33.1%(+66.9)#1,205 |
| 38. | Arlington | 100.0% | 41.8%(+58.2)#38 | 33.1%(+66.9)#1,223 |
| 39. | Salvisa | 100.0% | 41.8%(+58.2)#39 | 33.1%(+66.9)#1,238 |
| 40. | Pleasant View | 100.0% | 41.8%(+58.2)#40 | 33.1%(+66.9)#1,261 |
| 41. | Gilbertsville | 100.0% | 41.8%(+58.2)#41 | 33.1%(+66.9)#1,283 |
| 42. | Dunmor | 100.0% | 41.8%(+58.2)#42 | 33.1%(+66.9)#1,399 |
| 43. | Livingston | 100.0% | 41.8%(+58.2)#43 | 33.1%(+66.9)#1,560 |
| 44. | Blackey | 100.0% | 41.8%(+58.2)#44 | 33.1%(+66.9)#1,735 |
| 45. | Monterey | 100.0% | 41.8%(+58.2)#45 | 33.1%(+66.9)#1,743 |
| 46. | New Hope | 100.0% | 41.8%(+58.2)#46 | 33.1%(+66.9)#1,944 |
| 47. | Whitesburg | 98.2% | 41.8%(+56.4)#47 | 33.1%(+65.1)#1,973 |
| 48. | Liberty | 97.2% | 41.8%(+55.4)#48 | 33.1%(+64.0)#1,979 |
| 49. | Clay City | 96.7% | 41.8%(+54.9)#49 | 33.1%(+63.6)#1,984 |
| 50. | Prestonsburg | 96.7% | 41.8%(+54.9)#50 | 33.1%(+63.6)#1,985 |
| 51. | Hindman | 94.1% | 41.8%(+52.3)#51 | 33.1%(+61.0)#2,022 |
| 52. | Adairville | 93.3% | 41.8%(+51.5)#52 | 33.1%(+60.2)#2,054 |
| 53. | Manchester | 92.8% | 41.8%(+50.9)#53 | 33.1%(+59.6)#2,073 |
| 54. | Jenkins | 92.4% | 41.8%(+50.6)#54 | 33.1%(+59.3)#2,079 |
| 55. | West Liberty | 89.6% | 41.8%(+47.8)#55 | 33.1%(+56.4)#2,180 |
| 56. | St Charles | 88.9% | 41.8%(+47.1)#56 | 33.1%(+55.8)#2,224 |
| 57. | Monticello | 88.7% | 41.8%(+46.8)#57 | 33.1%(+55.5)#2,231 |
| 58. | Martin | 87.9% | 41.8%(+46.0)#58 | 33.1%(+54.7)#2,261 |
| 59. | Paintsville | 87.0% | 41.8%(+45.2)#59 | 33.1%(+53.9)#2,307 |
| 60. | Drakesboro | 86.4% | 41.8%(+44.5)#60 | 33.1%(+53.2)#2,337 |
| 61. | Berry | 85.7% | 41.8%(+43.9)#61 | 33.1%(+52.6)#2,407 |
| 62. | Irvine | 85.0% | 41.8%(+43.2)#62 | 33.1%(+51.9)#2,430 |
| 63. | Livermore | 83.9% | 41.8%(+42.0)#63 | 33.1%(+50.7)#2,498 |
| 64. | Rockport | 83.3% | 41.8%(+41.5)#64 | 33.1%(+50.2)#2,539 |
| 65. | Mount Vernon | 82.9% | 41.8%(+41.1)#65 | 33.1%(+49.8)#2,572 |
| 66. | Mortons Gap | 82.4% | 41.8%(+40.5)#66 | 33.1%(+49.2)#2,596 |
| 67. | Sparta | 81.8% | 41.8%(+40.0)#67 | 33.1%(+48.7)#2,646 |
| 68. | Flemingsburg | 81.1% | 41.8%(+39.3)#68 | 33.1%(+48.0)#2,689 |
| 69. | Munfordville | 80.6% | 41.8%(+38.7)#69 | 33.1%(+47.4)#2,716 |
| 70. | Dry Ridge | 80.3% | 41.8%(+38.5)#70 | 33.1%(+47.2)#2,726 |
| 71. | Fredonia | 80.0% | 41.8%(+38.2)#71 | 33.1%(+46.9)#2,756 |
| 72. | Poplar Hills | 79.6% | 41.8%(+37.8)#72 | 33.1%(+46.5)#2,815 |
| 73. | Clarkson | 79.4% | 41.8%(+37.6)#73 | 33.1%(+46.3)#2,824 |
| 74. | Falmouth | 79.0% | 41.8%(+37.2)#74 | 33.1%(+45.9)#2,846 |
| 75. | Edmonton | 77.0% | 41.8%(+35.2)#75 | 33.1%(+43.9)#3,000 |
| 76. | Bedford | 76.5% | 41.8%(+34.6)#76 | 33.1%(+43.3)#3,060 |
| 77. | Lewisport | 76.2% | 41.8%(+34.4)#77 | 33.1%(+43.1)#3,077 |
| 78. | Columbia | 76.1% | 41.8%(+34.2)#78 | 33.1%(+42.9)#3,092 |
| 79. | Coal Run Village | 75.0% | 41.8%(+33.2)#79 | 33.1%(+41.9)#3,159 |
| 80. | Sandy Hook | 75.0% | 41.8%(+33.2)#80 | 33.1%(+41.9)#3,180 |
| 81. | Park Hills | 74.5% | 41.8%(+32.7)#81 | 33.1%(+41.4)#3,265 |
| 82. | Breckinridge Center | 74.4% | 41.8%(+32.5)#82 | 33.1%(+41.2)#3,275 |
| 83. | Mount Sterling | 74.2% | 41.8%(+32.4)#83 | 33.1%(+41.1)#3,284 |
| 84. | Louisa | 74.2% | 41.8%(+32.4)#84 | 33.1%(+41.1)#3,285 |
| 85. | Campbellsburg | 73.3% | 41.8%(+31.5)#85 | 33.1%(+40.2)#3,363 |
| 86. | Crab Orchard | 73.3% | 41.8%(+31.5)#86 | 33.1%(+40.2)#3,367 |
| 87. | Williamsburg | 72.5% | 41.8%(+30.7)#87 | 33.1%(+39.4)#3,466 |
| 88. | London | 72.2% | 41.8%(+30.3)#88 | 33.1%(+39.0)#3,508 |
| 89. | Hardin | 71.7% | 41.8%(+29.9)#89 | 33.1%(+38.6)#3,542 |
| 90. | Lebanon | 71.2% | 41.8%(+29.4)#90 | 33.1%(+38.1)#3,620 |
| 91. | Harlan | 70.3% | 41.8%(+28.4)#91 | 33.1%(+37.1)#3,704 |
| 92. | Campton | 70.0% | 41.8%(+28.2)#92 | 33.1%(+36.9)#3,751 |
| 93. | Cloverport | 69.4% | 41.8%(+27.6)#93 | 33.1%(+36.3)#3,800 |
| 94. | Horse Cave | 69.3% | 41.8%(+27.5)#94 | 33.1%(+36.2)#3,808 |
| 95. | White Plains | 68.2% | 41.8%(+26.4)#95 | 33.1%(+35.0)#3,934 |
| 96. | Brandenburg | 68.0% | 41.8%(+26.2)#96 | 33.1%(+34.9)#3,945 |
| 97. | Bardwell | 68.0% | 41.8%(+26.2)#97 | 33.1%(+34.9)#3,950 |
| 98. | Sharpsburg | 68.0% | 41.8%(+26.2)#98 | 33.1%(+34.9)#3,953 |
| 99. | New Haven | 67.9% | 41.8%(+26.0)#99 | 33.1%(+34.7)#3,961 |
| 100. | Grayson | 67.7% | 41.8%(+25.9)#100 | 33.1%(+34.6)#3,969 |
Common Questions
What are the Top 10 Cities with the Highest Poverty Level Among Single Mothers in Kentucky?
Top 10 Cities with the Highest Poverty Level Among Single Mothers in Kentucky are:
#1
100.0%
#2
100.0%
#3
100.0%
#4
100.0%
#5
100.0%
#6
100.0%
#7
100.0%
#8
100.0%
#9
100.0%
#10
100.0%
What city has the Highest Poverty Level Among Single Mothers in Kentucky?
Morehead has the Highest Poverty Level Among Single Mothers in Kentucky with 100.0%.
What is the Poverty Level Among Single Mothers in the State of Kentucky?
Poverty Level Among Single Mothers in Kentucky is 41.8%.
What is the Poverty Level Among Single Mothers in the United States?
Poverty Level Among Single Mothers in the United States is 33.1%.