Cities with the Highest Poverty Level Among Single Mothers in North Carolina
RELATED REPORTS & OPTIONS
Highest Poverty | Single Mother
North Carolina
Compare Cities
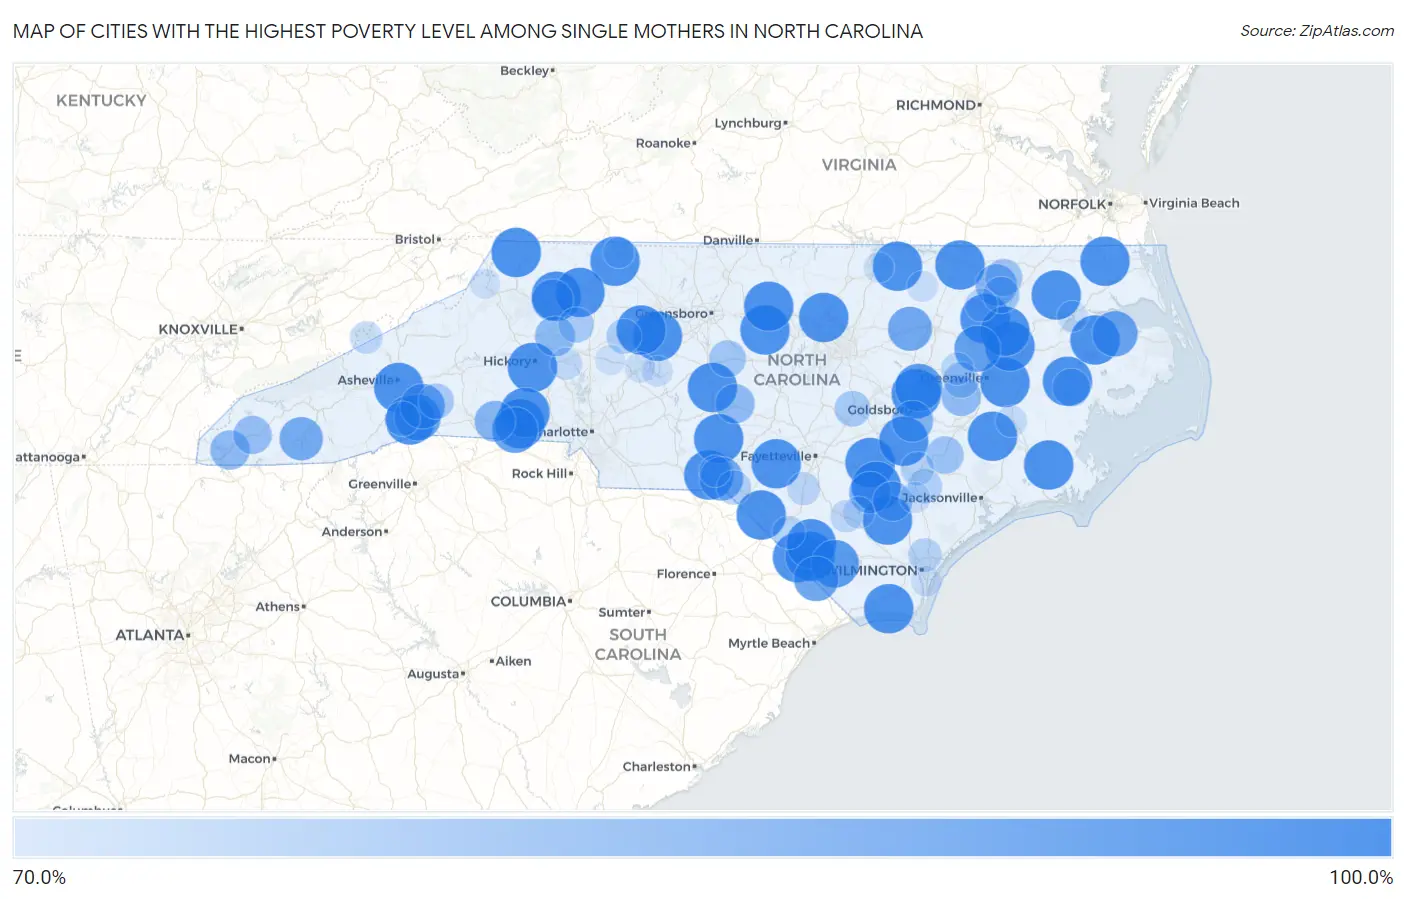
Map of Cities with the Highest Poverty Level Among Single Mothers in North Carolina
0.0%
100.0%
Cities with the Highest Poverty Level Among Single Mothers in North Carolina
| City | Single Mother Poverty | vs State | vs National | |
| 1. | Welcome | 100.0% | 35.6%(+64.4)#1 | 33.1%(+66.9)#53 |
| 2. | Mountain View | 100.0% | 35.6%(+64.4)#2 | 33.1%(+66.9)#56 |
| 3. | Fairplains | 100.0% | 35.6%(+64.4)#3 | 33.1%(+66.9)#194 |
| 4. | Biltmore Forest | 100.0% | 35.6%(+64.4)#4 | 33.1%(+66.9)#197 |
| 5. | Advance | 100.0% | 35.6%(+64.4)#5 | 33.1%(+66.9)#217 |
| 6. | Gorman | 100.0% | 35.6%(+64.4)#6 | 33.1%(+66.9)#243 |
| 7. | Cordova | 100.0% | 35.6%(+64.4)#7 | 33.1%(+66.9)#278 |
| 8. | Bonnetsville | 100.0% | 35.6%(+64.4)#8 | 33.1%(+66.9)#286 |
| 9. | Saxapahaw | 100.0% | 35.6%(+64.4)#9 | 33.1%(+66.9)#320 |
| 10. | Barker Heights | 100.0% | 35.6%(+64.4)#10 | 33.1%(+66.9)#412 |
| 11. | Woodlawn | 100.0% | 35.6%(+64.4)#11 | 33.1%(+66.9)#434 |
| 12. | Warrenton | 100.0% | 35.6%(+64.4)#12 | 33.1%(+66.9)#487 |
| 13. | Varnamtown | 100.0% | 35.6%(+64.4)#13 | 33.1%(+66.9)#512 |
| 14. | Silver City | 100.0% | 35.6%(+64.4)#14 | 33.1%(+66.9)#516 |
| 15. | White Plains | 100.0% | 35.6%(+64.4)#15 | 33.1%(+66.9)#547 |
| 16. | Ingold | 100.0% | 35.6%(+64.4)#16 | 33.1%(+66.9)#557 |
| 17. | Pikeville | 100.0% | 35.6%(+64.4)#17 | 33.1%(+66.9)#615 |
| 18. | Light Oak | 100.0% | 35.6%(+64.4)#18 | 33.1%(+66.9)#617 |
| 19. | Cove City | 100.0% | 35.6%(+64.4)#19 | 33.1%(+66.9)#662 |
| 20. | South Mills | 100.0% | 35.6%(+64.4)#20 | 33.1%(+66.9)#665 |
| 21. | South Weldon | 100.0% | 35.6%(+64.4)#21 | 33.1%(+66.9)#674 |
| 22. | Ronda | 100.0% | 35.6%(+64.4)#22 | 33.1%(+66.9)#791 |
| 23. | Cape Colony | 100.0% | 35.6%(+64.4)#23 | 33.1%(+66.9)#819 |
| 24. | Minnesott Beach | 100.0% | 35.6%(+64.4)#24 | 33.1%(+66.9)#825 |
| 25. | Pantego | 100.0% | 35.6%(+64.4)#25 | 33.1%(+66.9)#881 |
| 26. | Fair Bluff | 100.0% | 35.6%(+64.4)#26 | 33.1%(+66.9)#886 |
| 27. | Ivanhoe | 100.0% | 35.6%(+64.4)#27 | 33.1%(+66.9)#891 |
| 28. | Calypso | 100.0% | 35.6%(+64.4)#28 | 33.1%(+66.9)#900 |
| 29. | Seagrove | 100.0% | 35.6%(+64.4)#29 | 33.1%(+66.9)#943 |
| 30. | Grimesland | 100.0% | 35.6%(+64.4)#30 | 33.1%(+66.9)#1,011 |
| 31. | Cerro Gordo | 100.0% | 35.6%(+64.4)#31 | 33.1%(+66.9)#1,042 |
| 32. | Raemon | 100.0% | 35.6%(+64.4)#32 | 33.1%(+66.9)#1,123 |
| 33. | Evergreen | 100.0% | 35.6%(+64.4)#33 | 33.1%(+66.9)#1,129 |
| 34. | Hobgood | 100.0% | 35.6%(+64.4)#34 | 33.1%(+66.9)#1,189 |
| 35. | Waco | 100.0% | 35.6%(+64.4)#35 | 33.1%(+66.9)#1,192 |
| 36. | Everetts | 100.0% | 35.6%(+64.4)#36 | 33.1%(+66.9)#1,213 |
| 37. | Colerain | 100.0% | 35.6%(+64.4)#37 | 33.1%(+66.9)#1,239 |
| 38. | Lansing | 100.0% | 35.6%(+64.4)#38 | 33.1%(+66.9)#1,319 |
| 39. | Norman | 100.0% | 35.6%(+64.4)#39 | 33.1%(+66.9)#1,510 |
| 40. | Hamilton | 100.0% | 35.6%(+64.4)#40 | 33.1%(+66.9)#1,528 |
| 41. | Creswell | 100.0% | 35.6%(+64.4)#41 | 33.1%(+66.9)#1,580 |
| 42. | Long Creek | 100.0% | 35.6%(+64.4)#42 | 33.1%(+66.9)#1,830 |
| 43. | Brunswick | 97.4% | 35.6%(+61.8)#43 | 33.1%(+64.3)#1,977 |
| 44. | Fremont | 97.0% | 35.6%(+61.4)#44 | 33.1%(+63.9)#1,981 |
| 45. | Dana | 95.5% | 35.6%(+59.9)#45 | 33.1%(+62.4)#2,001 |
| 46. | Conetoe | 95.2% | 35.6%(+59.6)#46 | 33.1%(+62.1)#2,005 |
| 47. | Patterson Springs | 94.9% | 35.6%(+59.2)#47 | 33.1%(+61.7)#2,012 |
| 48. | Columbia | 94.1% | 35.6%(+58.5)#48 | 33.1%(+61.0)#2,023 |
| 49. | Tabor City | 93.5% | 35.6%(+57.8)#49 | 33.1%(+60.3)#2,049 |
| 50. | Edneyville | 93.2% | 35.6%(+57.6)#50 | 33.1%(+60.1)#2,062 |
| 51. | Momeyer | 92.3% | 35.6%(+56.7)#51 | 33.1%(+59.2)#2,085 |
| 52. | Hamlet | 91.9% | 35.6%(+56.3)#52 | 33.1%(+58.8)#2,096 |
| 53. | Franklin | 91.3% | 35.6%(+55.7)#53 | 33.1%(+58.2)#2,122 |
| 54. | Garland | 88.9% | 35.6%(+53.3)#54 | 33.1%(+55.8)#2,209 |
| 55. | Cricket | 88.5% | 35.6%(+52.9)#55 | 33.1%(+55.4)#2,242 |
| 56. | Rich Square | 88.5% | 35.6%(+52.8)#56 | 33.1%(+55.3)#2,246 |
| 57. | Brogden | 88.1% | 35.6%(+52.5)#57 | 33.1%(+55.0)#2,254 |
| 58. | Mooresboro | 87.5% | 35.6%(+51.9)#58 | 33.1%(+54.4)#2,297 |
| 59. | Taylorsville | 86.4% | 35.6%(+50.7)#59 | 33.1%(+53.2)#2,334 |
| 60. | Murphy | 85.7% | 35.6%(+50.1)#60 | 33.1%(+52.6)#2,365 |
| 61. | Harrells | 85.7% | 35.6%(+50.1)#61 | 33.1%(+52.6)#2,404 |
| 62. | Robbins | 85.5% | 35.6%(+49.9)#62 | 33.1%(+52.4)#2,412 |
| 63. | Maury | 85.5% | 35.6%(+49.8)#63 | 33.1%(+52.3)#2,416 |
| 64. | Andrews | 83.9% | 35.6%(+48.3)#64 | 33.1%(+50.8)#2,495 |
| 65. | Belhaven | 83.2% | 35.6%(+47.5)#65 | 33.1%(+50.0)#2,557 |
| 66. | Pink Hill | 82.8% | 35.6%(+47.1)#66 | 33.1%(+49.6)#2,576 |
| 67. | Woodland | 82.4% | 35.6%(+46.7)#67 | 33.1%(+49.2)#2,600 |
| 68. | Dudley | 82.2% | 35.6%(+46.6)#68 | 33.1%(+49.1)#2,615 |
| 69. | Ramseur | 81.9% | 35.6%(+46.3)#69 | 33.1%(+48.8)#2,625 |
| 70. | Roxobel | 81.5% | 35.6%(+45.8)#70 | 33.1%(+48.3)#2,667 |
| 71. | Benson | 80.3% | 35.6%(+44.6)#71 | 33.1%(+47.1)#2,728 |
| 72. | Farmville | 80.1% | 35.6%(+44.5)#72 | 33.1%(+47.0)#2,732 |
| 73. | Lake Lure | 80.0% | 35.6%(+44.4)#73 | 33.1%(+46.9)#2,738 |
| 74. | Love Valley | 80.0% | 35.6%(+44.4)#74 | 33.1%(+46.9)#2,792 |
| 75. | Mocksville | 78.9% | 35.6%(+43.3)#75 | 33.1%(+45.8)#2,857 |
| 76. | Laurel Park | 78.8% | 35.6%(+43.2)#76 | 33.1%(+45.7)#2,864 |
| 77. | Old Hundred | 78.4% | 35.6%(+42.8)#77 | 33.1%(+45.3)#2,892 |
| 78. | Greenevers | 78.1% | 35.6%(+42.5)#78 | 33.1%(+45.0)#2,907 |
| 79. | Kenansville | 77.4% | 35.6%(+41.8)#79 | 33.1%(+44.3)#2,978 |
| 80. | Skippers Corner | 77.2% | 35.6%(+41.6)#80 | 33.1%(+44.1)#2,992 |
| 81. | Fairmont | 76.7% | 35.6%(+41.1)#81 | 33.1%(+43.6)#3,039 |
| 82. | St Pauls | 76.4% | 35.6%(+40.8)#82 | 33.1%(+43.3)#3,063 |
| 83. | Scotland Neck | 76.1% | 35.6%(+40.5)#83 | 33.1%(+43.0)#3,084 |
| 84. | Hot Springs | 75.9% | 35.6%(+40.2)#84 | 33.1%(+42.7)#3,106 |
| 85. | Fountain | 75.8% | 35.6%(+40.1)#85 | 33.1%(+42.6)#3,114 |
| 86. | Elizabethtown | 75.5% | 35.6%(+39.9)#86 | 33.1%(+42.4)#3,130 |
| 87. | White Lake | 75.0% | 35.6%(+39.4)#87 | 33.1%(+41.9)#3,170 |
| 88. | Catawba | 75.0% | 35.6%(+39.4)#88 | 33.1%(+41.9)#3,185 |
| 89. | Rockingham | 74.5% | 35.6%(+38.9)#89 | 33.1%(+41.4)#3,260 |
| 90. | Vanceboro | 74.2% | 35.6%(+38.6)#90 | 33.1%(+41.1)#3,283 |
| 91. | Mount Airy | 73.9% | 35.6%(+38.3)#91 | 33.1%(+40.8)#3,301 |
| 92. | Hollister | 73.7% | 35.6%(+38.0)#92 | 33.1%(+40.5)#3,337 |
| 93. | Wallace | 73.6% | 35.6%(+38.0)#93 | 33.1%(+40.5)#3,342 |
| 94. | Southmont | 73.5% | 35.6%(+37.9)#94 | 33.1%(+40.4)#3,348 |
| 95. | Edenton | 73.4% | 35.6%(+37.8)#95 | 33.1%(+40.3)#3,356 |
| 96. | East Spencer | 73.2% | 35.6%(+37.5)#96 | 33.1%(+40.0)#3,377 |
| 97. | Silver Lake | 73.0% | 35.6%(+37.4)#97 | 33.1%(+39.9)#3,386 |
| 98. | Cove Creek | 72.7% | 35.6%(+37.1)#98 | 33.1%(+39.6)#3,411 |
| 99. | Middleburg | 72.7% | 35.6%(+37.1)#99 | 33.1%(+39.6)#3,445 |
| 100. | Cleveland | 72.6% | 35.6%(+37.0)#100 | 33.1%(+39.5)#3,462 |
Common Questions
What are the Top 10 Cities with the Highest Poverty Level Among Single Mothers in North Carolina?
Top 10 Cities with the Highest Poverty Level Among Single Mothers in North Carolina are:
#1
100.0%
#2
100.0%
#3
100.0%
#4
100.0%
#5
100.0%
#6
100.0%
#7
100.0%
#8
100.0%
#9
100.0%
#10
100.0%
What city has the Highest Poverty Level Among Single Mothers in North Carolina?
Welcome has the Highest Poverty Level Among Single Mothers in North Carolina with 100.0%.
What is the Poverty Level Among Single Mothers in the State of North Carolina?
Poverty Level Among Single Mothers in North Carolina is 35.6%.
What is the Poverty Level Among Single Mothers in the United States?
Poverty Level Among Single Mothers in the United States is 33.1%.