Cities with the Highest Poverty Level Among Families in Iowa
RELATED REPORTS & OPTIONS
Highest Family Poverty
Iowa
Compare Cities
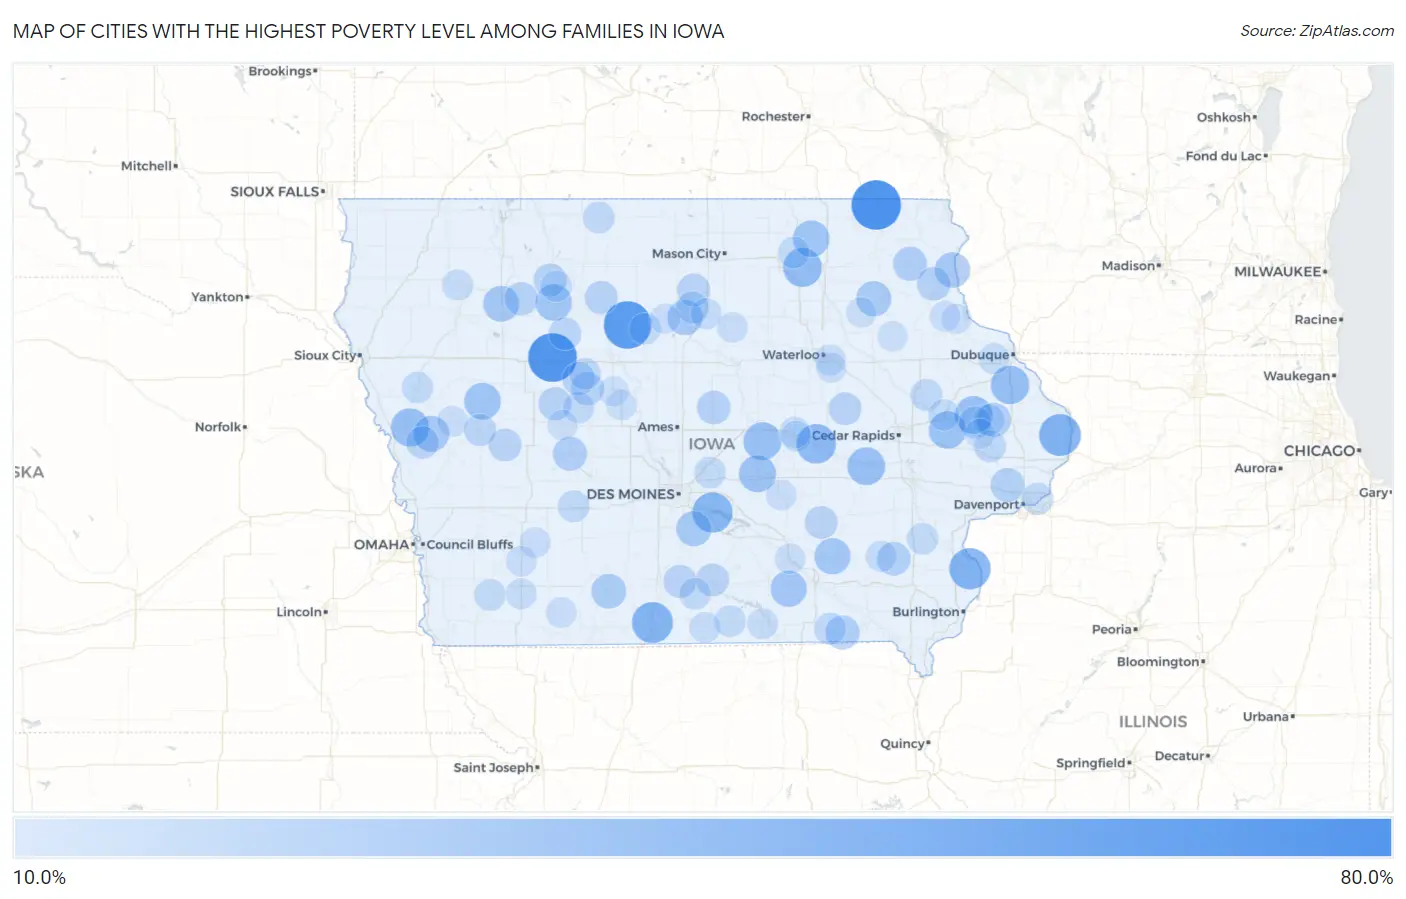
Map of Cities with the Highest Poverty Level Among Families in Iowa
0.0%
80.0%
Cities with the Highest Poverty Level Among Families in Iowa
| City | Family Poverty | vs State | vs National | |
| 1. | Burr Oak | 62.0% | 7.0%(+54.9)#1 | 8.8%(+53.2)#355 |
| 2. | Jolley | 60.0% | 7.0%(+53.0)#2 | 8.8%(+51.2)#384 |
| 3. | Fairport | 57.6% | 7.0%(+50.5)#3 | 8.8%(+48.8)#430 |
| 4. | Thor | 56.9% | 7.0%(+49.9)#4 | 8.8%(+48.2)#449 |
| 5. | Andover | 43.5% | 7.0%(+36.4)#5 | 8.8%(+34.7)#961 |
| 6. | Oakville | 42.3% | 7.0%(+35.3)#6 | 8.8%(+33.5)#1,036 |
| 7. | Decatur City | 41.7% | 7.0%(+34.6)#7 | 8.8%(+32.9)#1,079 |
| 8. | Swan | 40.0% | 7.0%(+33.0)#8 | 8.8%(+31.2)#1,211 |
| 9. | Chelsea | 38.4% | 7.0%(+31.3)#9 | 8.8%(+29.6)#1,331 |
| 10. | Bassett | 36.4% | 7.0%(+29.3)#10 | 8.8%(+27.6)#1,482 |
| 11. | Zwingle | 35.7% | 7.0%(+28.7)#11 | 8.8%(+26.9)#1,541 |
| 12. | Turin | 35.0% | 7.0%(+28.0)#12 | 8.8%(+26.2)#1,611 |
| 13. | Ferguson | 34.6% | 7.0%(+27.6)#13 | 8.8%(+25.8)#1,647 |
| 14. | Onslow | 34.2% | 7.0%(+27.2)#14 | 8.8%(+25.4)#1,690 |
| 15. | South Amana | 34.0% | 7.0%(+27.0)#15 | 8.8%(+25.3)#1,707 |
| 16. | Morley | 33.3% | 7.0%(+26.3)#16 | 8.8%(+24.6)#1,821 |
| 17. | Kellogg | 32.5% | 7.0%(+25.4)#17 | 8.8%(+23.7)#1,891 |
| 18. | Kiron | 31.7% | 7.0%(+24.6)#18 | 8.8%(+22.9)#1,981 |
| 19. | Elma | 31.6% | 7.0%(+24.6)#19 | 8.8%(+22.8)#1,986 |
| 20. | Havelock | 31.4% | 7.0%(+24.4)#20 | 8.8%(+22.6)#2,012 |
| 21. | Blakesburg | 30.6% | 7.0%(+23.6)#21 | 8.8%(+21.9)#2,129 |
| 22. | Martinsburg | 30.6% | 7.0%(+23.5)#22 | 8.8%(+21.8)#2,139 |
| 23. | Rembrandt | 30.0% | 7.0%(+23.0)#23 | 8.8%(+21.2)#2,228 |
| 24. | Soldier | 30.0% | 7.0%(+23.0)#24 | 8.8%(+21.2)#2,229 |
| 25. | Marquette | 28.7% | 7.0%(+21.7)#25 | 8.8%(+19.9)#2,437 |
| 26. | Rowan | 28.6% | 7.0%(+21.5)#26 | 8.8%(+19.8)#2,460 |
| 27. | Randalia | 28.6% | 7.0%(+21.5)#27 | 8.8%(+19.8)#2,469 |
| 28. | Ackworth | 28.1% | 7.0%(+21.1)#28 | 8.8%(+19.3)#2,546 |
| 29. | Arispe | 27.3% | 7.0%(+20.2)#29 | 8.8%(+18.5)#2,722 |
| 30. | Baldwin | 26.3% | 7.0%(+19.3)#30 | 8.8%(+17.5)#2,920 |
| 31. | Bayard | 26.1% | 7.0%(+19.0)#31 | 8.8%(+17.3)#2,965 |
| 32. | Milton | 26.0% | 7.0%(+18.9)#32 | 8.8%(+17.2)#2,996 |
| 33. | Postville | 25.7% | 7.0%(+18.7)#33 | 8.8%(+17.0)#3,052 |
| 34. | Maysville | 25.5% | 7.0%(+18.5)#34 | 8.8%(+16.8)#3,106 |
| 35. | Coppock | 25.0% | 7.0%(+18.0)#35 | 8.8%(+16.2)#3,265 |
| 36. | Zearing | 24.6% | 7.0%(+17.6)#36 | 8.8%(+15.9)#3,327 |
| 37. | Farmersburg | 24.3% | 7.0%(+17.3)#37 | 8.8%(+15.6)#3,407 |
| 38. | Marathon | 24.0% | 7.0%(+17.0)#38 | 8.8%(+15.2)#3,495 |
| 39. | Lanesboro | 23.8% | 7.0%(+16.8)#39 | 8.8%(+15.0)#3,555 |
| 40. | Farnhamville | 23.7% | 7.0%(+16.6)#40 | 8.8%(+14.9)#3,581 |
| 41. | Curlew | 23.5% | 7.0%(+16.5)#41 | 8.8%(+14.7)#3,624 |
| 42. | Bode | 23.5% | 7.0%(+16.4)#42 | 8.8%(+14.7)#3,637 |
| 43. | Woodburn | 23.3% | 7.0%(+16.2)#43 | 8.8%(+14.5)#3,693 |
| 44. | Chariton | 23.2% | 7.0%(+16.2)#44 | 8.8%(+14.5)#3,695 |
| 45. | Garrison | 23.1% | 7.0%(+16.0)#45 | 8.8%(+14.3)#3,735 |
| 46. | Meservey | 23.1% | 7.0%(+16.0)#46 | 8.8%(+14.3)#3,737 |
| 47. | Rinard | 23.1% | 7.0%(+16.0)#47 | 8.8%(+14.3)#3,750 |
| 48. | Aspinwall | 23.1% | 7.0%(+16.0)#48 | 8.8%(+14.3)#3,753 |
| 49. | What Cheer | 22.9% | 7.0%(+15.8)#49 | 8.8%(+14.1)#3,797 |
| 50. | Moorhead | 22.4% | 7.0%(+15.3)#50 | 8.8%(+13.6)#3,952 |
| 51. | Palmer | 22.2% | 7.0%(+15.2)#51 | 8.8%(+13.4)#4,006 |
| 52. | Wyoming | 21.7% | 7.0%(+14.6)#52 | 8.8%(+12.9)#4,197 |
| 53. | Denison | 21.5% | 7.0%(+14.4)#53 | 8.8%(+12.7)#4,262 |
| 54. | Alexander | 21.4% | 7.0%(+14.4)#54 | 8.8%(+12.6)#4,283 |
| 55. | Pulaski | 21.1% | 7.0%(+14.1)#55 | 8.8%(+12.3)#4,400 |
| 56. | Toronto | 21.1% | 7.0%(+14.0)#56 | 8.8%(+12.3)#4,419 |
| 57. | Prairieburg | 20.8% | 7.0%(+13.8)#57 | 8.8%(+12.1)#4,510 |
| 58. | Swea City | 20.8% | 7.0%(+13.7)#58 | 8.8%(+12.0)#4,533 |
| 59. | Casey | 20.7% | 7.0%(+13.6)#59 | 8.8%(+11.9)#4,558 |
| 60. | Panorama Park | 20.7% | 7.0%(+13.6)#60 | 8.8%(+11.9)#4,564 |
| 61. | Somers | 20.5% | 7.0%(+13.5)#61 | 8.8%(+11.7)#4,632 |
| 62. | Churdan | 20.0% | 7.0%(+13.0)#62 | 8.8%(+11.2)#4,820 |
| 63. | Monmouth | 20.0% | 7.0%(+13.0)#63 | 8.8%(+11.2)#4,853 |
| 64. | Derby | 20.0% | 7.0%(+13.0)#64 | 8.8%(+11.2)#4,862 |
| 65. | Oto | 20.0% | 7.0%(+13.0)#66 | 8.8%(+11.2)#4,874 |
| 66. | Promise City | 20.0% | 7.0%(+13.0)#67 | 8.8%(+11.2)#4,875 |
| 67. | Colwell | 20.0% | 7.0%(+13.0)#68 | 8.8%(+11.2)#4,878 |
| 68. | Coburg | 20.0% | 7.0%(+13.0)#69 | 8.8%(+11.2)#4,884 |
| 69. | Valeria | 20.0% | 7.0%(+13.0)#70 | 8.8%(+11.2)#4,886 |
| 70. | Cotter | 20.0% | 7.0%(+13.0)#71 | 8.8%(+11.2)#4,893 |
| 71. | Eagle Grove | 20.0% | 7.0%(+12.9)#72 | 8.8%(+11.2)#4,898 |
| 72. | Mallard | 19.7% | 7.0%(+12.6)#73 | 8.8%(+10.9)#4,995 |
| 73. | Anamosa | 19.3% | 7.0%(+12.2)#74 | 8.8%(+10.5)#5,135 |
| 74. | Latimer | 19.3% | 7.0%(+12.2)#75 | 8.8%(+10.5)#5,140 |
| 75. | Toledo | 19.2% | 7.0%(+12.2)#76 | 8.8%(+10.5)#5,151 |
| 76. | Calumet | 18.9% | 7.0%(+11.9)#77 | 8.8%(+10.1)#5,295 |
| 77. | Centralia | 18.9% | 7.0%(+11.9)#78 | 8.8%(+10.1)#5,296 |
| 78. | Tama | 18.9% | 7.0%(+11.8)#79 | 8.8%(+10.1)#5,309 |
| 79. | Brighton | 18.9% | 7.0%(+11.8)#80 | 8.8%(+10.1)#5,317 |
| 80. | Evansdale | 18.7% | 7.0%(+11.7)#81 | 8.8%(+9.96)#5,389 |
| 81. | Allerton | 18.6% | 7.0%(+11.5)#82 | 8.8%(+9.80)#5,454 |
| 82. | Centerville | 18.6% | 7.0%(+11.5)#83 | 8.8%(+9.79)#5,461 |
| 83. | Villisca | 18.3% | 7.0%(+11.3)#84 | 8.8%(+9.55)#5,599 |
| 84. | Charter Oak | 18.2% | 7.0%(+11.1)#85 | 8.8%(+9.40)#5,659 |
| 85. | Cumberland | 18.2% | 7.0%(+11.1)#86 | 8.8%(+9.40)#5,669 |
| 86. | Searsboro | 18.2% | 7.0%(+11.1)#87 | 8.8%(+9.40)#5,675 |
| 87. | Sharpsburg | 18.2% | 7.0%(+11.1)#88 | 8.8%(+9.40)#5,686 |
| 88. | Grant | 18.2% | 7.0%(+11.1)#89 | 8.8%(+9.40)#5,688 |
| 89. | Garber | 17.9% | 7.0%(+10.9)#90 | 8.8%(+9.17)#5,798 |
| 90. | Geneva | 17.9% | 7.0%(+10.8)#91 | 8.8%(+9.08)#5,842 |
| 91. | Boxholm | 17.6% | 7.0%(+10.6)#92 | 8.8%(+8.87)#5,942 |
| 92. | Eddyville | 17.6% | 7.0%(+10.5)#93 | 8.8%(+8.80)#5,977 |
| 93. | Clarion | 17.5% | 7.0%(+10.5)#94 | 8.8%(+8.75)#6,000 |
| 94. | Washburn | 17.4% | 7.0%(+10.3)#95 | 8.8%(+8.61)#6,077 |
| 95. | Westgate | 17.4% | 7.0%(+10.3)#96 | 8.8%(+8.61)#6,083 |
| 96. | Harcourt | 17.4% | 7.0%(+10.3)#97 | 8.8%(+8.61)#6,085 |
| 97. | Ralston | 17.4% | 7.0%(+10.3)#98 | 8.8%(+8.61)#6,092 |
| 98. | Aurora | 17.3% | 7.0%(+10.3)#99 | 8.8%(+8.53)#6,119 |
| 99. | Oxford Junction | 17.2% | 7.0%(+10.2)#100 | 8.8%(+8.46)#6,148 |
| 100. | Osterdock | 17.1% | 7.0%(+10.0)#101 | 8.8%(+8.29)#6,235 |
Common Questions
What are the Top 10 Cities with the Highest Poverty Level Among Families in Iowa?
Top 10 Cities with the Highest Poverty Level Among Families in Iowa are:
What city has the Highest Poverty Level Among Families in Iowa?
Burr Oak has the Highest Poverty Level Among Families in Iowa with 62.0%.
What is the Poverty Level Among Families in the State of Iowa?
Poverty Level Among Families in Iowa is 7.0%.
What is the Poverty Level Among Families in the United States?
Poverty Level Among Families in the United States is 8.8%.