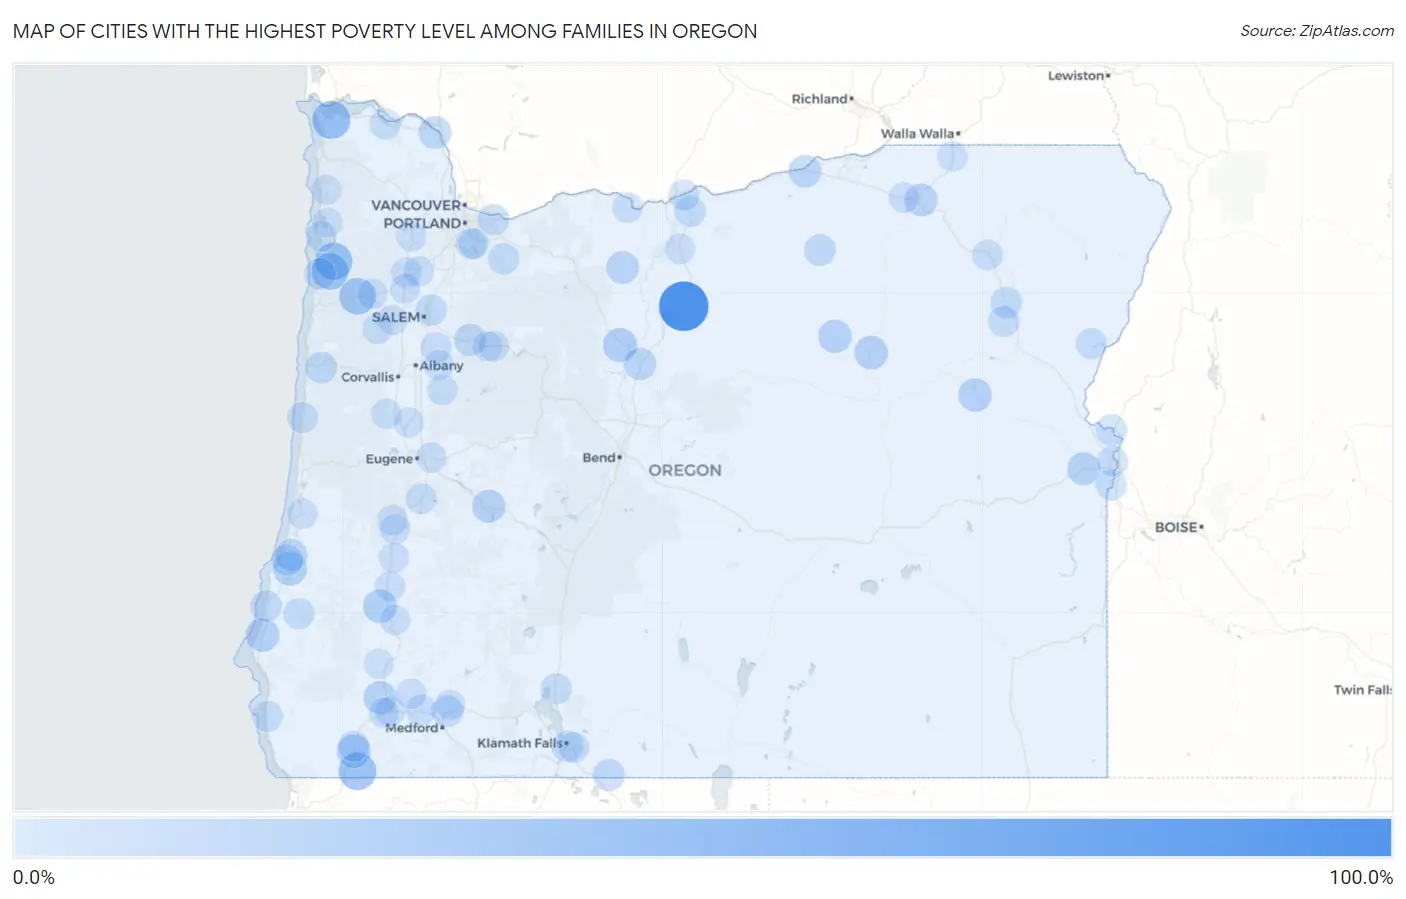
Cities with the Highest Poverty Level Among Families in Oregon
RELATED REPORTS & OPTIONS
Highest Family Poverty
Oregon
Compare Cities
Map of Cities with the Highest Poverty Level Among Families in Oregon
0.0%
100.0%
Cities with the Highest Poverty Level Among Families in Oregon
| City | Family Poverty | vs State | vs National | |
| 1. | Shaniko | 100.0% | 7.3%(+92.7)#1 | 8.8%(+91.2)#115 |
| 2. | Trent | 50.4% | 7.3%(+43.1)#2 | 8.8%(+41.6)#633 |
| 3. | Jeffers Gardens | 45.9% | 7.3%(+38.7)#3 | 8.8%(+37.2)#831 |
| 4. | Takilma | 44.2% | 7.3%(+36.9)#4 | 8.8%(+35.4)#920 |
| 5. | Beaver | 42.9% | 7.3%(+35.6)#5 | 8.8%(+34.1)#1,003 |
| 6. | Hebo | 40.4% | 7.3%(+33.1)#6 | 8.8%(+31.6)#1,179 |
| 7. | Grand Ronde | 39.4% | 7.3%(+32.1)#7 | 8.8%(+30.6)#1,255 |
| 8. | Dexter | 34.5% | 7.3%(+27.3)#8 | 8.8%(+25.8)#1,650 |
| 9. | Rocky Point | 31.8% | 7.3%(+24.5)#9 | 8.8%(+23.0)#1,962 |
| 10. | Mapleton | 30.1% | 7.3%(+22.9)#10 | 8.8%(+21.4)#2,200 |
| 11. | Warm Springs | 28.7% | 7.3%(+21.4)#11 | 8.8%(+19.9)#2,436 |
| 12. | Cave Junction | 27.5% | 7.3%(+20.2)#12 | 8.8%(+18.7)#2,674 |
| 13. | Bunker Hill | 27.3% | 7.3%(+20.1)#13 | 8.8%(+18.6)#2,696 |
| 14. | Dillard | 26.9% | 7.3%(+19.6)#14 | 8.8%(+18.1)#2,793 |
| 15. | Langlois | 26.3% | 7.3%(+19.0)#15 | 8.8%(+17.5)#2,933 |
| 16. | Long Creek | 26.2% | 7.3%(+18.9)#16 | 8.8%(+17.4)#2,946 |
| 17. | Monument | 25.0% | 7.3%(+17.7)#17 | 8.8%(+16.2)#3,237 |
| 18. | Unity | 25.0% | 7.3%(+17.7)#18 | 8.8%(+16.2)#3,260 |
| 19. | Marcola | 24.4% | 7.3%(+17.2)#19 | 8.8%(+15.7)#3,375 |
| 20. | Oakridge | 23.9% | 7.3%(+16.6)#20 | 8.8%(+15.1)#3,521 |
| 21. | Vale | 23.9% | 7.3%(+16.6)#21 | 8.8%(+15.1)#3,527 |
| 22. | Merlin | 23.8% | 7.3%(+16.5)#22 | 8.8%(+15.0)#3,561 |
| 23. | Pine Hollow | 22.5% | 7.3%(+15.3)#23 | 8.8%(+13.7)#3,908 |
| 24. | Mission | 22.1% | 7.3%(+14.8)#24 | 8.8%(+13.3)#4,060 |
| 25. | Rainier | 21.8% | 7.3%(+14.6)#25 | 8.8%(+13.0)#4,153 |
| 26. | Madras | 21.4% | 7.3%(+14.2)#26 | 8.8%(+12.6)#4,271 |
| 27. | Boardman | 21.4% | 7.3%(+14.1)#27 | 8.8%(+12.6)#4,294 |
| 28. | San Marine | 21.1% | 7.3%(+13.8)#28 | 8.8%(+12.3)#4,408 |
| 29. | Beaver Marsh | 20.9% | 7.3%(+13.7)#29 | 8.8%(+12.1)#4,473 |
| 30. | Bayshore | 20.8% | 7.3%(+13.5)#30 | 8.8%(+12.0)#4,530 |
| 31. | Glasgow | 20.6% | 7.3%(+13.4)#31 | 8.8%(+11.8)#4,584 |
| 32. | Mehama | 19.2% | 7.3%(+12.0)#32 | 8.8%(+10.4)#5,153 |
| 33. | Malin | 18.7% | 7.3%(+11.5)#33 | 8.8%(+9.93)#5,400 |
| 34. | Toledo | 17.7% | 7.3%(+10.4)#34 | 8.8%(+8.92)#5,912 |
| 35. | Heppner | 17.5% | 7.3%(+10.2)#35 | 8.8%(+8.68)#6,042 |
| 36. | Pacific City | 17.4% | 7.3%(+10.1)#36 | 8.8%(+8.62)#6,070 |
| 37. | North Bend | 17.0% | 7.3%(+9.77)#37 | 8.8%(+8.25)#6,251 |
| 38. | White City | 16.9% | 7.3%(+9.66)#38 | 8.8%(+8.14)#6,315 |
| 39. | North Powder | 16.7% | 7.3%(+9.48)#39 | 8.8%(+7.96)#6,403 |
| 40. | Haines | 16.7% | 7.3%(+9.41)#40 | 8.8%(+7.88)#6,464 |
| 41. | Wasco | 16.5% | 7.3%(+9.26)#41 | 8.8%(+7.74)#6,554 |
| 42. | Bandon | 16.4% | 7.3%(+9.19)#42 | 8.8%(+7.67)#6,593 |
| 43. | Klamath Falls | 16.3% | 7.3%(+9.08)#43 | 8.8%(+7.56)#6,643 |
| 44. | Hayesville | 16.1% | 7.3%(+8.88)#44 | 8.8%(+7.36)#6,750 |
| 45. | Wood Village | 16.0% | 7.3%(+8.78)#45 | 8.8%(+7.26)#6,807 |
| 46. | Estacada | 16.0% | 7.3%(+8.75)#46 | 8.8%(+7.23)#6,819 |
| 47. | Myrtle Point | 15.8% | 7.3%(+8.53)#47 | 8.8%(+7.01)#6,928 |
| 48. | Annex | 15.7% | 7.3%(+8.45)#48 | 8.8%(+6.93)#6,990 |
| 49. | Westport | 15.6% | 7.3%(+8.33)#49 | 8.8%(+6.81)#7,072 |
| 50. | Jennings Lodge | 15.5% | 7.3%(+8.20)#50 | 8.8%(+6.68)#7,151 |
| 51. | Chiloquin | 15.1% | 7.3%(+7.85)#51 | 8.8%(+6.33)#7,373 |
| 52. | Nyssa | 15.0% | 7.3%(+7.78)#52 | 8.8%(+6.26)#7,420 |
| 53. | Ontario | 15.0% | 7.3%(+7.77)#53 | 8.8%(+6.25)#7,427 |
| 54. | Rufus | 15.0% | 7.3%(+7.74)#54 | 8.8%(+6.22)#7,455 |
| 55. | Richland | 15.0% | 7.3%(+7.74)#55 | 8.8%(+6.22)#7,457 |
| 56. | Gold Beach | 14.4% | 7.3%(+7.19)#56 | 8.8%(+5.67)#7,835 |
| 57. | Kerby | 14.4% | 7.3%(+7.17)#57 | 8.8%(+5.65)#7,848 |
| 58. | Marion | 14.1% | 7.3%(+6.88)#58 | 8.8%(+5.36)#8,097 |
| 59. | Svensen | 14.1% | 7.3%(+6.84)#59 | 8.8%(+5.32)#8,119 |
| 60. | Yachats | 14.1% | 7.3%(+6.80)#60 | 8.8%(+5.28)#8,149 |
| 61. | Gates | 13.4% | 7.3%(+6.12)#61 | 8.8%(+4.60)#8,641 |
| 62. | Gold Hill | 13.3% | 7.3%(+6.05)#62 | 8.8%(+4.53)#8,721 |
| 63. | Netarts | 13.2% | 7.3%(+5.97)#63 | 8.8%(+4.45)#8,773 |
| 64. | La Grande | 13.2% | 7.3%(+5.94)#64 | 8.8%(+4.42)#8,795 |
| 65. | Cottage Grove | 13.2% | 7.3%(+5.91)#65 | 8.8%(+4.39)#8,805 |
| 66. | Chenoweth | 13.1% | 7.3%(+5.87)#66 | 8.8%(+4.35)#8,835 |
| 67. | Altamont | 13.0% | 7.3%(+5.74)#67 | 8.8%(+4.22)#8,966 |
| 68. | Gladstone | 12.9% | 7.3%(+5.64)#68 | 8.8%(+4.12)#9,057 |
| 69. | Reedsport | 12.9% | 7.3%(+5.63)#69 | 8.8%(+4.11)#9,062 |
| 70. | Drain | 12.9% | 7.3%(+5.60)#70 | 8.8%(+4.08)#9,081 |
| 71. | Mcminnville | 12.8% | 7.3%(+5.50)#71 | 8.8%(+3.98)#9,160 |
| 72. | Milton Freewater | 12.8% | 7.3%(+5.50)#72 | 8.8%(+3.98)#9,162 |
| 73. | Saunders Lake | 12.4% | 7.3%(+5.15)#73 | 8.8%(+3.63)#9,444 |
| 74. | Dallas | 12.4% | 7.3%(+5.15)#74 | 8.8%(+3.63)#9,447 |
| 75. | Grants Pass | 12.4% | 7.3%(+5.09)#75 | 8.8%(+3.57)#9,482 |
| 76. | Dayton | 12.3% | 7.3%(+5.06)#76 | 8.8%(+3.54)#9,505 |
| 77. | Sodaville | 12.3% | 7.3%(+5.02)#77 | 8.8%(+3.50)#9,547 |
| 78. | Grass Valley | 12.3% | 7.3%(+5.02)#78 | 8.8%(+3.50)#9,548 |
| 79. | River Point | 12.2% | 7.3%(+4.90)#79 | 8.8%(+3.38)#9,661 |
| 80. | Myrtle Creek | 12.1% | 7.3%(+4.85)#80 | 8.8%(+3.33)#9,698 |
| 81. | Yoncalla | 12.1% | 7.3%(+4.85)#81 | 8.8%(+3.33)#9,700 |
| 82. | Falls City | 12.1% | 7.3%(+4.82)#82 | 8.8%(+3.30)#9,720 |
| 83. | Willamina | 12.1% | 7.3%(+4.82)#83 | 8.8%(+3.30)#9,723 |
| 84. | Gaston | 12.0% | 7.3%(+4.79)#84 | 8.8%(+3.27)#9,756 |
| 85. | Wimer | 12.0% | 7.3%(+4.70)#85 | 8.8%(+3.18)#9,835 |
| 86. | Amity | 12.0% | 7.3%(+4.70)#86 | 8.8%(+3.18)#9,841 |
| 87. | Alpine | 11.9% | 7.3%(+4.64)#87 | 8.8%(+3.12)#9,891 |
| 88. | Springfield | 11.8% | 7.3%(+4.54)#88 | 8.8%(+3.02)#9,969 |
| 89. | Eagle Point | 11.8% | 7.3%(+4.50)#89 | 8.8%(+2.98)#10,024 |
| 90. | Pendleton | 11.8% | 7.3%(+4.49)#90 | 8.8%(+2.97)#10,026 |
| 91. | Oakland | 11.7% | 7.3%(+4.48)#91 | 8.8%(+2.96)#10,033 |
| 92. | Harrisburg | 11.7% | 7.3%(+4.47)#92 | 8.8%(+2.95)#10,049 |
| 93. | Crabtree | 11.7% | 7.3%(+4.43)#93 | 8.8%(+2.91)#10,086 |
| 94. | Roseburg | 11.6% | 7.3%(+4.33)#94 | 8.8%(+2.81)#10,165 |
| 95. | Cherry Grove | 11.4% | 7.3%(+4.17)#95 | 8.8%(+2.65)#10,334 |
| 96. | Glendale | 11.3% | 7.3%(+4.08)#96 | 8.8%(+2.56)#10,437 |
| 97. | Bay City | 11.1% | 7.3%(+3.85)#97 | 8.8%(+2.33)#10,609 |
| 98. | Nehalem | 11.0% | 7.3%(+3.70)#98 | 8.8%(+2.18)#10,788 |
| 99. | Redwood | 10.9% | 7.3%(+3.64)#99 | 8.8%(+2.12)#10,848 |
| 100. | Mill City | 10.7% | 7.3%(+3.48)#100 | 8.8%(+1.96)#10,995 |
Common Questions
What are the Top 10 Cities with the Highest Poverty Level Among Families in Oregon?
Top 10 Cities with the Highest Poverty Level Among Families in Oregon are:
#1
100.0%
#2
45.9%
#3
44.2%
#4
42.9%
#5
40.4%
#6
39.4%
#7
28.7%
#8
27.5%
#9
27.3%
#10
26.9%
What city has the Highest Poverty Level Among Families in Oregon?
Shaniko has the Highest Poverty Level Among Families in Oregon with 100.0%.
What is the Poverty Level Among Families in the State of Oregon?
Poverty Level Among Families in Oregon is 7.3%.
What is the Poverty Level Among Families in the United States?
Poverty Level Among Families in the United States is 8.8%.