Cities with the Highest Poverty Level Among Families in Florida
RELATED REPORTS & OPTIONS
Highest Family Poverty
Florida
Compare Cities
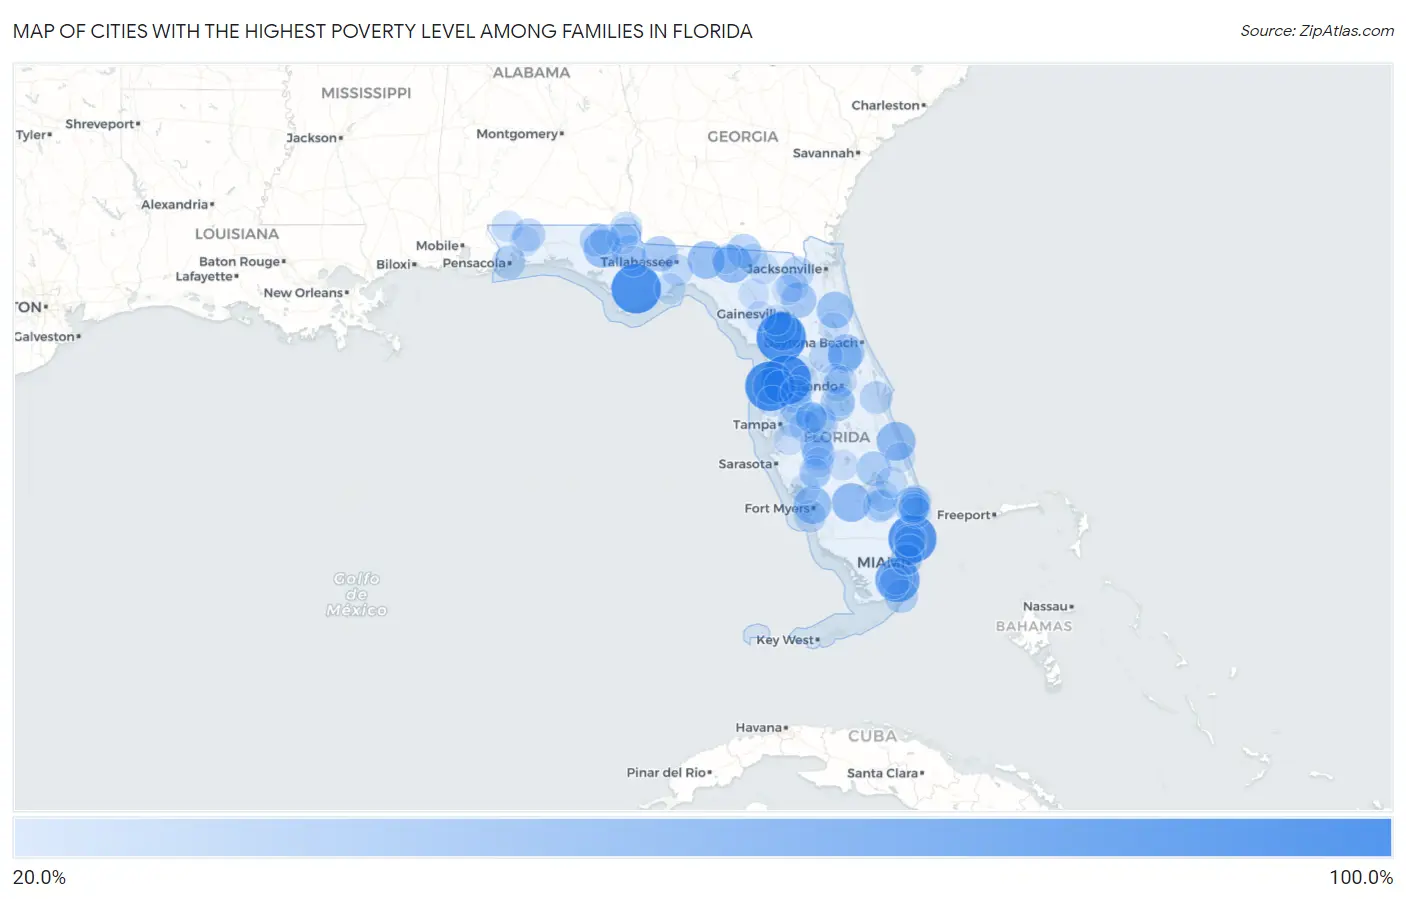
Map of Cities with the Highest Poverty Level Among Families in Florida
0.0%
100.0%
Cities with the Highest Poverty Level Among Families in Florida
| City | Family Poverty | vs State | vs National | |
| 1. | Morriston | 100.0% | 9.1%(+90.9)#1 | 8.8%(+91.2)#38 |
| 2. | Lake Lindsey | 100.0% | 9.1%(+90.9)#2 | 8.8%(+91.2)#39 |
| 3. | Bayport | 100.0% | 9.1%(+90.9)#3 | 8.8%(+91.2)#49 |
| 4. | Sumatra | 100.0% | 9.1%(+90.9)#4 | 8.8%(+91.2)#96 |
| 5. | Lazy Lake | 94.4% | 9.1%(+85.2)#5 | 8.8%(+85.6)#126 |
| 6. | Homestead Base | 79.0% | 9.1%(+69.9)#6 | 8.8%(+70.3)#171 |
| 7. | East Williston | 57.1% | 9.1%(+48.0)#7 | 8.8%(+48.4)#438 |
| 8. | Pioneer | 56.5% | 9.1%(+47.4)#8 | 8.8%(+47.7)#456 |
| 9. | Gifford | 56.2% | 9.1%(+47.1)#9 | 8.8%(+47.5)#464 |
| 10. | Lee | 55.1% | 9.1%(+45.9)#10 | 8.8%(+46.3)#500 |
| 11. | Wausau | 53.0% | 9.1%(+43.9)#11 | 8.8%(+44.2)#552 |
| 12. | Tropical Park | 52.4% | 9.1%(+43.3)#12 | 8.8%(+43.6)#572 |
| 13. | Palmona Park | 51.9% | 9.1%(+42.8)#13 | 8.8%(+43.2)#591 |
| 14. | Aucilla | 51.5% | 9.1%(+42.4)#14 | 8.8%(+42.7)#603 |
| 15. | Royal Palm Estates | 48.1% | 9.1%(+38.9)#15 | 8.8%(+39.3)#745 |
| 16. | Hastings | 47.9% | 9.1%(+38.8)#16 | 8.8%(+39.1)#756 |
| 17. | Weeki Wachee Gardens | 47.6% | 9.1%(+38.5)#17 | 8.8%(+38.9)#769 |
| 18. | North Deland | 46.8% | 9.1%(+37.7)#18 | 8.8%(+38.0)#804 |
| 19. | West Canaveral Groves | 44.4% | 9.1%(+35.3)#19 | 8.8%(+35.7)#902 |
| 20. | Quincy | 43.1% | 9.1%(+33.9)#20 | 8.8%(+34.3)#990 |
| 21. | Hampton | 42.9% | 9.1%(+33.7)#21 | 8.8%(+34.1)#1,000 |
| 22. | Cypress Quarters | 39.9% | 9.1%(+30.7)#22 | 8.8%(+31.1)#1,228 |
| 23. | Jennings | 39.5% | 9.1%(+30.3)#23 | 8.8%(+30.7)#1,248 |
| 24. | Campbell | 39.2% | 9.1%(+30.1)#24 | 8.8%(+30.4)#1,272 |
| 25. | Silver Springs | 38.4% | 9.1%(+29.3)#25 | 8.8%(+29.6)#1,329 |
| 26. | Deland Southwest | 38.2% | 9.1%(+29.1)#26 | 8.8%(+29.5)#1,336 |
| 27. | Altha | 37.6% | 9.1%(+28.5)#27 | 8.8%(+28.8)#1,372 |
| 28. | Crystal Springs | 36.7% | 9.1%(+27.5)#28 | 8.8%(+27.9)#1,454 |
| 29. | Franklin Park | 36.3% | 9.1%(+27.1)#29 | 8.8%(+27.5)#1,491 |
| 30. | Goulding | 35.6% | 9.1%(+26.4)#30 | 8.8%(+26.8)#1,549 |
| 31. | North Key Largo | 35.5% | 9.1%(+26.4)#31 | 8.8%(+26.7)#1,557 |
| 32. | Bonifay | 35.2% | 9.1%(+26.1)#32 | 8.8%(+26.4)#1,590 |
| 33. | Dade City North | 35.0% | 9.1%(+25.9)#33 | 8.8%(+26.2)#1,605 |
| 34. | Wahneta | 34.9% | 9.1%(+25.8)#34 | 8.8%(+26.1)#1,615 |
| 35. | Pittman | 34.1% | 9.1%(+25.0)#35 | 8.8%(+25.4)#1,695 |
| 36. | Munson | 33.7% | 9.1%(+24.5)#36 | 8.8%(+24.9)#1,751 |
| 37. | Zolfo Springs | 33.3% | 9.1%(+24.2)#37 | 8.8%(+24.6)#1,766 |
| 38. | Cocoa West | 33.2% | 9.1%(+24.0)#38 | 8.8%(+24.4)#1,838 |
| 39. | Glen St Mary | 32.5% | 9.1%(+23.4)#39 | 8.8%(+23.7)#1,884 |
| 40. | Harlem Heights | 31.8% | 9.1%(+22.7)#40 | 8.8%(+23.0)#1,957 |
| 41. | South Bay | 31.0% | 9.1%(+21.9)#41 | 8.8%(+22.3)#2,066 |
| 42. | Scottsmoor | 31.0% | 9.1%(+21.9)#42 | 8.8%(+22.2)#2,071 |
| 43. | Crystal Lake | 30.9% | 9.1%(+21.8)#43 | 8.8%(+22.1)#2,079 |
| 44. | Schall Circle | 30.4% | 9.1%(+21.3)#44 | 8.8%(+21.7)#2,156 |
| 45. | Dover | 30.4% | 9.1%(+21.2)#45 | 8.8%(+21.6)#2,163 |
| 46. | Gladeview | 30.2% | 9.1%(+21.1)#46 | 8.8%(+21.5)#2,184 |
| 47. | Naranja | 30.1% | 9.1%(+21.0)#47 | 8.8%(+21.3)#2,211 |
| 48. | Bowling Green | 30.1% | 9.1%(+21.0)#48 | 8.8%(+21.3)#2,215 |
| 49. | Wauchula | 30.0% | 9.1%(+20.9)#49 | 8.8%(+21.2)#2,244 |
| 50. | Wiscon | 29.1% | 9.1%(+20.0)#50 | 8.8%(+20.4)#2,363 |
| 51. | Arcadia | 29.1% | 9.1%(+20.0)#51 | 8.8%(+20.3)#2,365 |
| 52. | Willow Oak | 28.8% | 9.1%(+19.7)#52 | 8.8%(+20.0)#2,422 |
| 53. | Raiford | 28.7% | 9.1%(+19.6)#53 | 8.8%(+20.0)#2,428 |
| 54. | Woodville | 28.3% | 9.1%(+19.2)#54 | 8.8%(+19.5)#2,507 |
| 55. | Malone | 28.3% | 9.1%(+19.1)#55 | 8.8%(+19.5)#2,513 |
| 56. | Belle Glade | 28.1% | 9.1%(+19.0)#56 | 8.8%(+19.3)#2,552 |
| 57. | Pahokee | 28.0% | 9.1%(+18.9)#57 | 8.8%(+19.2)#2,573 |
| 58. | Pine Air | 27.9% | 9.1%(+18.8)#58 | 8.8%(+19.1)#2,581 |
| 59. | Indiantown | 27.3% | 9.1%(+18.2)#59 | 8.8%(+18.5)#2,706 |
| 60. | Inwood | 27.1% | 9.1%(+18.0)#60 | 8.8%(+18.3)#2,744 |
| 61. | Century | 27.0% | 9.1%(+17.9)#61 | 8.8%(+18.2)#2,761 |
| 62. | Greenwood | 26.9% | 9.1%(+17.8)#62 | 8.8%(+18.2)#2,778 |
| 63. | Eatonville | 26.9% | 9.1%(+17.8)#63 | 8.8%(+18.2)#2,779 |
| 64. | Raleigh | 26.8% | 9.1%(+17.7)#64 | 8.8%(+18.0)#2,807 |
| 65. | University Cdp Hillsborough County | 26.7% | 9.1%(+17.6)#65 | 8.8%(+17.9)#2,827 |
| 66. | Winding Cypress | 26.3% | 9.1%(+17.2)#66 | 8.8%(+17.6)#2,911 |
| 67. | White Springs | 26.0% | 9.1%(+16.9)#67 | 8.8%(+17.2)#2,999 |
| 68. | Moon Lake | 25.9% | 9.1%(+16.8)#68 | 8.8%(+17.1)#3,022 |
| 69. | Panacea | 25.6% | 9.1%(+16.5)#69 | 8.8%(+16.9)#3,079 |
| 70. | Combee Settlement | 25.5% | 9.1%(+16.4)#70 | 8.8%(+16.7)#3,117 |
| 71. | San Castle | 25.5% | 9.1%(+16.4)#71 | 8.8%(+16.7)#3,122 |
| 72. | Brownsville | 25.5% | 9.1%(+16.3)#72 | 8.8%(+16.7)#3,127 |
| 73. | Boulevard Gardens | 25.2% | 9.1%(+16.1)#73 | 8.8%(+16.4)#3,174 |
| 74. | Marianna | 25.1% | 9.1%(+16.0)#74 | 8.8%(+16.3)#3,183 |
| 75. | Lake Panasoffkee | 25.1% | 9.1%(+16.0)#75 | 8.8%(+16.3)#3,185 |
| 76. | Pembroke Park | 25.1% | 9.1%(+16.0)#76 | 8.8%(+16.3)#3,187 |
| 77. | Webster | 25.1% | 9.1%(+16.0)#77 | 8.8%(+16.3)#3,189 |
| 78. | Lake Placid | 25.0% | 9.1%(+15.9)#78 | 8.8%(+16.2)#3,198 |
| 79. | Florida City | 24.8% | 9.1%(+15.6)#79 | 8.8%(+16.0)#3,301 |
| 80. | Mangonia Park | 24.6% | 9.1%(+15.5)#80 | 8.8%(+15.9)#3,329 |
| 81. | Kenwood Estates | 24.4% | 9.1%(+15.3)#81 | 8.8%(+15.6)#3,387 |
| 82. | Jasper | 24.4% | 9.1%(+15.3)#82 | 8.8%(+15.6)#3,396 |
| 83. | Wimauma | 24.3% | 9.1%(+15.2)#83 | 8.8%(+15.5)#3,419 |
| 84. | Lacoochee | 24.2% | 9.1%(+15.1)#84 | 8.8%(+15.4)#3,441 |
| 85. | Blountstown | 24.1% | 9.1%(+15.0)#85 | 8.8%(+15.4)#3,464 |
| 86. | Solana | 24.1% | 9.1%(+15.0)#86 | 8.8%(+15.3)#3,471 |
| 87. | Branford | 24.1% | 9.1%(+15.0)#87 | 8.8%(+15.3)#3,472 |
| 88. | Trenton | 23.8% | 9.1%(+14.7)#88 | 8.8%(+15.0)#3,534 |
| 89. | Lake Butler | 23.7% | 9.1%(+14.6)#89 | 8.8%(+14.9)#3,584 |
| 90. | Fort Pierce | 23.5% | 9.1%(+14.4)#90 | 8.8%(+14.7)#3,626 |
| 91. | Madison | 23.5% | 9.1%(+14.3)#91 | 8.8%(+14.7)#3,638 |
| 92. | Archer | 23.4% | 9.1%(+14.3)#92 | 8.8%(+14.6)#3,646 |
| 93. | Gardner | 23.4% | 9.1%(+14.3)#93 | 8.8%(+14.6)#3,658 |
| 94. | Crescent City | 23.4% | 9.1%(+14.2)#94 | 8.8%(+14.6)#3,663 |
| 95. | Orlovista | 23.4% | 9.1%(+14.2)#95 | 8.8%(+14.6)#3,665 |
| 96. | Southeast Arcadia | 23.3% | 9.1%(+14.2)#96 | 8.8%(+14.5)#3,684 |
| 97. | Springhill | 23.1% | 9.1%(+14.0)#97 | 8.8%(+14.3)#3,746 |
| 98. | South Apopka | 22.8% | 9.1%(+13.7)#98 | 8.8%(+14.0)#3,824 |
| 99. | Chipley | 22.8% | 9.1%(+13.6)#99 | 8.8%(+14.0)#3,829 |
| 100. | Kissimmee | 22.4% | 9.1%(+13.3)#100 | 8.8%(+13.6)#3,945 |
Common Questions
What are the Top 10 Cities with the Highest Poverty Level Among Families in Florida?
Top 10 Cities with the Highest Poverty Level Among Families in Florida are:
#1
100.0%
#2
100.0%
#3
100.0%
#4
100.0%
#5
94.4%
#6
79.0%
#7
57.1%
#8
56.5%
#9
56.2%
#10
55.1%
What city has the Highest Poverty Level Among Families in Florida?
Morriston has the Highest Poverty Level Among Families in Florida with 100.0%.
What is the Poverty Level Among Families in the State of Florida?
Poverty Level Among Families in Florida is 9.1%.
What is the Poverty Level Among Families in the United States?
Poverty Level Among Families in the United States is 8.8%.