Cities with the Highest Poverty Level Among Families in Illinois
RELATED REPORTS & OPTIONS
Highest Family Poverty
Illinois
Compare Cities
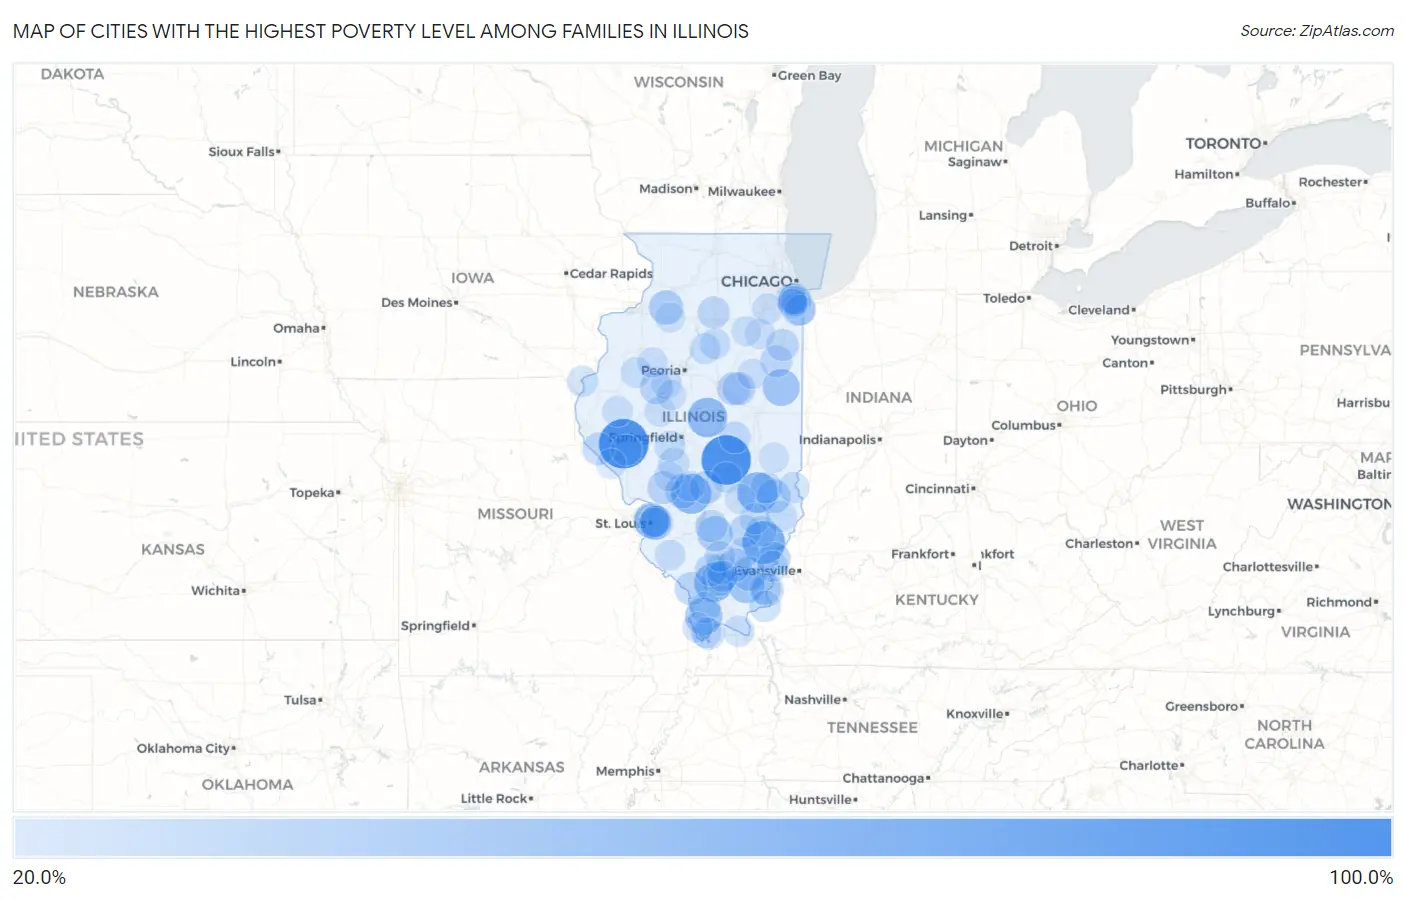
Map of Cities with the Highest Poverty Level Among Families in Illinois
0.0%
100.0%
Cities with the Highest Poverty Level Among Families in Illinois
| City | Family Poverty | vs State | vs National | |
| 1. | Alden | 100.0% | 8.2%(+91.8)#1 | 8.8%(+91.2)#28 |
| 2. | Valley City | 100.0% | 8.2%(+91.8)#2 | 8.8%(+91.2)#94 |
| 3. | Westervelt | 100.0% | 8.2%(+91.8)#3 | 8.8%(+91.2)#105 |
| 4. | Ophiem | 82.4% | 8.2%(+74.2)#4 | 8.8%(+73.6)#157 |
| 5. | Serena | 78.3% | 8.2%(+70.1)#5 | 8.8%(+69.5)#179 |
| 6. | Golden Gate | 71.4% | 8.2%(+63.3)#6 | 8.8%(+62.6)#231 |
| 7. | Wheeler | 63.2% | 8.2%(+55.0)#7 | 8.8%(+54.4)#338 |
| 8. | Fowler | 63.2% | 8.2%(+55.0)#8 | 8.8%(+54.4)#339 |
| 9. | Donnellson | 61.5% | 8.2%(+53.4)#9 | 8.8%(+52.8)#365 |
| 10. | Chestnut | 59.1% | 8.2%(+50.9)#10 | 8.8%(+50.3)#402 |
| 11. | Harding | 58.8% | 8.2%(+50.7)#11 | 8.8%(+50.0)#407 |
| 12. | Colp | 56.9% | 8.2%(+48.7)#12 | 8.8%(+48.1)#452 |
| 13. | Illinois | 52.6% | 8.2%(+44.5)#13 | 8.8%(+43.8)#566 |
| 14. | Mill Creek | 50.0% | 8.2%(+41.8)#14 | 8.8%(+41.2)#672 |
| 15. | Rankin | 48.2% | 8.2%(+40.0)#15 | 8.8%(+39.4)#734 |
| 16. | Muddy | 46.7% | 8.2%(+38.5)#16 | 8.8%(+37.9)#814 |
| 17. | Millersburg | 42.9% | 8.2%(+34.7)#17 | 8.8%(+34.1)#1,008 |
| 18. | Walnut Hill | 42.1% | 8.2%(+33.9)#18 | 8.8%(+33.3)#1,047 |
| 19. | Venice | 41.5% | 8.2%(+33.3)#19 | 8.8%(+32.7)#1,097 |
| 20. | Freeman Spur | 39.5% | 8.2%(+31.4)#20 | 8.8%(+30.8)#1,244 |
| 21. | Brooklyn | 39.5% | 8.2%(+31.3)#21 | 8.8%(+30.7)#1,245 |
| 22. | Hooppole | 38.5% | 8.2%(+30.3)#22 | 8.8%(+29.7)#1,324 |
| 23. | Walshville | 37.8% | 8.2%(+29.7)#23 | 8.8%(+29.1)#1,363 |
| 24. | Broughton | 37.5% | 8.2%(+29.3)#24 | 8.8%(+28.7)#1,382 |
| 25. | Ford Heights | 37.0% | 8.2%(+28.9)#25 | 8.8%(+28.2)#1,424 |
| 26. | Willow Hill | 36.8% | 8.2%(+28.7)#26 | 8.8%(+28.1)#1,438 |
| 27. | Washington Park | 36.5% | 8.2%(+28.3)#27 | 8.8%(+27.7)#1,468 |
| 28. | Phillipstown | 35.3% | 8.2%(+27.1)#28 | 8.8%(+26.5)#1,586 |
| 29. | Cahokia Heights | 35.1% | 8.2%(+26.9)#29 | 8.8%(+26.3)#1,598 |
| 30. | Gorham | 34.4% | 8.2%(+26.3)#30 | 8.8%(+25.6)#1,666 |
| 31. | Ellsworth | 33.9% | 8.2%(+25.8)#31 | 8.8%(+25.1)#1,721 |
| 32. | Bryant | 33.8% | 8.2%(+25.7)#32 | 8.8%(+25.1)#1,731 |
| 33. | Arrowsmith | 33.3% | 8.2%(+25.2)#33 | 8.8%(+24.6)#1,777 |
| 34. | Bingham | 33.3% | 8.2%(+25.2)#34 | 8.8%(+24.6)#1,796 |
| 35. | Macedonia | 33.3% | 8.2%(+25.2)#35 | 8.8%(+24.6)#1,829 |
| 36. | Royal Lakes | 32.6% | 8.2%(+24.4)#36 | 8.8%(+23.8)#1,881 |
| 37. | Lowpoint | 32.5% | 8.2%(+24.3)#37 | 8.8%(+23.7)#1,889 |
| 38. | Old Shawneetown | 31.7% | 8.2%(+23.5)#38 | 8.8%(+22.9)#1,975 |
| 39. | New Canton | 31.4% | 8.2%(+23.2)#39 | 8.8%(+22.6)#2,019 |
| 40. | Mulkeytown | 30.8% | 8.2%(+22.6)#40 | 8.8%(+22.0)#2,110 |
| 41. | Johnsonville | 30.8% | 8.2%(+22.6)#41 | 8.8%(+22.0)#2,112 |
| 42. | Troy Grove | 30.4% | 8.2%(+22.3)#42 | 8.8%(+21.7)#2,157 |
| 43. | Junction City | 30.3% | 8.2%(+22.2)#43 | 8.8%(+21.6)#2,169 |
| 44. | Danforth | 30.3% | 8.2%(+22.1)#44 | 8.8%(+21.5)#2,179 |
| 45. | East St Louis | 30.3% | 8.2%(+22.1)#45 | 8.8%(+21.5)#2,183 |
| 46. | Sammons Point | 29.8% | 8.2%(+21.7)#46 | 8.8%(+21.0)#2,268 |
| 47. | Riverdale | 29.4% | 8.2%(+21.2)#47 | 8.8%(+20.6)#2,330 |
| 48. | Rose Hill | 28.6% | 8.2%(+20.4)#48 | 8.8%(+19.8)#2,474 |
| 49. | Mound City | 28.4% | 8.2%(+20.2)#49 | 8.8%(+19.6)#2,493 |
| 50. | Laplace | 28.2% | 8.2%(+20.0)#50 | 8.8%(+19.4)#2,529 |
| 51. | Shawneetown | 28.1% | 8.2%(+20.0)#51 | 8.8%(+19.4)#2,541 |
| 52. | Girard | 27.9% | 8.2%(+19.7)#52 | 8.8%(+19.1)#2,590 |
| 53. | Fairmont City | 27.7% | 8.2%(+19.5)#53 | 8.8%(+18.9)#2,639 |
| 54. | Anna | 27.6% | 8.2%(+19.4)#54 | 8.8%(+18.8)#2,662 |
| 55. | Cave In Rock | 27.1% | 8.2%(+18.9)#55 | 8.8%(+18.3)#2,750 |
| 56. | Nauvoo | 26.6% | 8.2%(+18.4)#56 | 8.8%(+17.8)#2,848 |
| 57. | Brookport | 26.5% | 8.2%(+18.3)#57 | 8.8%(+17.7)#2,879 |
| 58. | Campbell's Island | 26.4% | 8.2%(+18.3)#58 | 8.8%(+17.7)#2,887 |
| 59. | Loami | 26.4% | 8.2%(+18.2)#59 | 8.8%(+17.6)#2,898 |
| 60. | Sumner | 26.2% | 8.2%(+18.0)#60 | 8.8%(+17.4)#2,953 |
| 61. | West City | 26.1% | 8.2%(+17.9)#61 | 8.8%(+17.3)#2,961 |
| 62. | West Frankfort | 26.0% | 8.2%(+17.8)#62 | 8.8%(+17.2)#2,985 |
| 63. | La Rose | 25.9% | 8.2%(+17.8)#63 | 8.8%(+17.1)#3,019 |
| 64. | Hutsonville | 25.9% | 8.2%(+17.7)#64 | 8.8%(+17.1)#3,024 |
| 65. | Maunie | 25.8% | 8.2%(+17.6)#65 | 8.8%(+17.0)#3,044 |
| 66. | Wenona | 25.7% | 8.2%(+17.6)#66 | 8.8%(+17.0)#3,055 |
| 67. | Clay City | 25.6% | 8.2%(+17.4)#67 | 8.8%(+16.8)#3,090 |
| 68. | Avon | 25.3% | 8.2%(+17.1)#68 | 8.8%(+16.5)#3,156 |
| 69. | Mounds | 25.0% | 8.2%(+16.8)#69 | 8.8%(+16.2)#3,205 |
| 70. | Kilbourne | 25.0% | 8.2%(+16.8)#70 | 8.8%(+16.2)#3,219 |
| 71. | Mount Erie | 25.0% | 8.2%(+16.8)#71 | 8.8%(+16.2)#3,242 |
| 72. | Camden | 25.0% | 8.2%(+16.8)#72 | 8.8%(+16.2)#3,247 |
| 73. | Belle Prairie City | 25.0% | 8.2%(+16.8)#73 | 8.8%(+16.2)#3,253 |
| 74. | Florence | 25.0% | 8.2%(+16.8)#74 | 8.8%(+16.2)#3,271 |
| 75. | Robbins | 24.8% | 8.2%(+16.6)#75 | 8.8%(+16.0)#3,294 |
| 76. | Cowden | 24.6% | 8.2%(+16.4)#76 | 8.8%(+15.8)#3,345 |
| 77. | Nason | 24.4% | 8.2%(+16.2)#77 | 8.8%(+15.6)#3,392 |
| 78. | Baldwin | 24.2% | 8.2%(+16.0)#78 | 8.8%(+15.4)#3,449 |
| 79. | Rockdale | 24.2% | 8.2%(+16.0)#79 | 8.8%(+15.4)#3,451 |
| 80. | Dixmoor | 24.0% | 8.2%(+15.8)#80 | 8.8%(+15.2)#3,501 |
| 81. | Phoenix | 23.6% | 8.2%(+15.5)#81 | 8.8%(+14.9)#3,595 |
| 82. | Gulfport | 23.5% | 8.2%(+15.4)#82 | 8.8%(+14.7)#3,621 |
| 83. | Strawn | 23.5% | 8.2%(+15.4)#83 | 8.8%(+14.7)#3,622 |
| 84. | East Brooklyn | 23.5% | 8.2%(+15.4)#84 | 8.8%(+14.7)#3,623 |
| 85. | Sauk Village | 23.4% | 8.2%(+15.3)#85 | 8.8%(+14.7)#3,644 |
| 86. | Olive Branch | 23.4% | 8.2%(+15.2)#86 | 8.8%(+14.6)#3,649 |
| 87. | Banner | 23.3% | 8.2%(+15.1)#87 | 8.8%(+14.5)#3,692 |
| 88. | Maquon | 23.1% | 8.2%(+14.9)#88 | 8.8%(+14.3)#3,739 |
| 89. | Markham | 23.0% | 8.2%(+14.9)#89 | 8.8%(+14.2)#3,756 |
| 90. | Taylor Springs | 22.9% | 8.2%(+14.7)#90 | 8.8%(+14.1)#3,787 |
| 91. | Carlinville | 22.8% | 8.2%(+14.7)#91 | 8.8%(+14.1)#3,805 |
| 92. | Mineral | 22.7% | 8.2%(+14.6)#92 | 8.8%(+13.9)#3,843 |
| 93. | Forest City | 22.6% | 8.2%(+14.5)#93 | 8.8%(+13.9)#3,872 |
| 94. | Hazel Crest | 22.6% | 8.2%(+14.5)#94 | 8.8%(+13.8)#3,874 |
| 95. | Verona | 22.4% | 8.2%(+14.2)#95 | 8.8%(+13.6)#3,933 |
| 96. | Pleasant Hill | 22.4% | 8.2%(+14.2)#96 | 8.8%(+13.6)#3,936 |
| 97. | Ridgewood | 22.4% | 8.2%(+14.2)#97 | 8.8%(+13.6)#3,937 |
| 98. | Ashmore | 22.4% | 8.2%(+14.2)#98 | 8.8%(+13.6)#3,949 |
| 99. | Mason | 22.2% | 8.2%(+14.1)#99 | 8.8%(+13.4)#3,994 |
| 100. | Dewey | 22.2% | 8.2%(+14.1)#100 | 8.8%(+13.4)#4,005 |
Common Questions
What are the Top 10 Cities with the Highest Poverty Level Among Families in Illinois?
Top 10 Cities with the Highest Poverty Level Among Families in Illinois are:
#1
100.0%
#2
100.0%
#3
71.4%
#4
63.2%
#5
61.5%
#6
59.1%
#7
56.9%
#8
50.0%
#9
48.2%
#10
46.7%
What city has the Highest Poverty Level Among Families in Illinois?
Valley City has the Highest Poverty Level Among Families in Illinois with 100.0%.
What is the Poverty Level Among Families in the State of Illinois?
Poverty Level Among Families in Illinois is 8.2%.
What is the Poverty Level Among Families in the United States?
Poverty Level Among Families in the United States is 8.8%.