Cities with the Highest Poverty Level Among Families in Tennessee
RELATED REPORTS & OPTIONS
Highest Family Poverty
Tennessee
Compare Cities
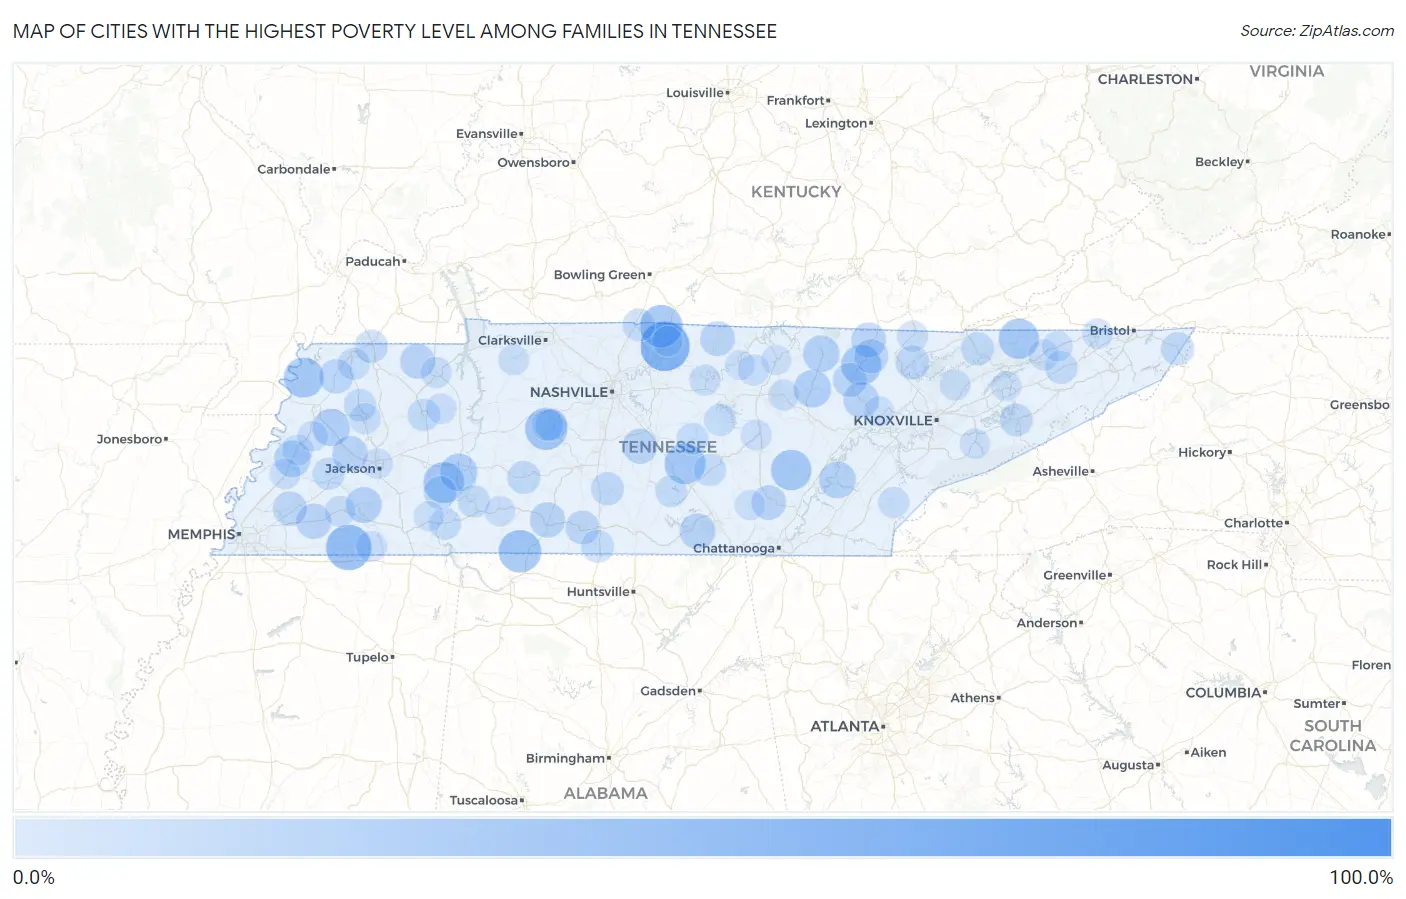
Map of Cities with the Highest Poverty Level Among Families in Tennessee
0.0%
100.0%
Cities with the Highest Poverty Level Among Families in Tennessee
| City | Family Poverty | vs State | vs National | |
| 1. | Morris Chapel | 100.0% | 10.0%(+90.0)#1 | 8.8%(+91.2)#20 |
| 2. | Sequatchie | 81.2% | 10.0%(+71.2)#2 | 8.8%(+72.4)#163 |
| 3. | Bethpage | 63.5% | 10.0%(+53.5)#3 | 8.8%(+54.7)#334 |
| 4. | Nixon | 63.3% | 10.0%(+53.3)#4 | 8.8%(+54.6)#336 |
| 5. | Greenvale | 57.4% | 10.0%(+47.4)#5 | 8.8%(+48.6)#436 |
| 6. | Saulsbury | 54.0% | 10.0%(+44.0)#6 | 8.8%(+45.2)#526 |
| 7. | Essary Springs | 53.8% | 10.0%(+43.8)#7 | 8.8%(+45.1)#534 |
| 8. | Farner | 53.3% | 10.0%(+43.3)#8 | 8.8%(+44.6)#543 |
| 9. | Dukedom | 52.8% | 10.0%(+42.8)#9 | 8.8%(+44.0)#559 |
| 10. | Fairfield | 47.5% | 10.0%(+37.5)#10 | 8.8%(+38.7)#775 |
| 11. | Iron City | 47.4% | 10.0%(+37.4)#11 | 8.8%(+38.6)#783 |
| 12. | Wrigley | 46.7% | 10.0%(+36.7)#12 | 8.8%(+37.9)#807 |
| 13. | Briceville | 44.2% | 10.0%(+34.1)#13 | 8.8%(+35.4)#923 |
| 14. | Lakewood Park | 43.6% | 10.0%(+33.6)#14 | 8.8%(+34.8)#955 |
| 15. | Scotts Hill | 43.2% | 10.0%(+33.2)#15 | 8.8%(+34.4)#981 |
| 16. | Pikeville | 42.6% | 10.0%(+32.6)#16 | 8.8%(+33.8)#1,023 |
| 17. | Robbins | 41.9% | 10.0%(+31.9)#17 | 8.8%(+33.2)#1,058 |
| 18. | Sneedville | 41.9% | 10.0%(+31.9)#18 | 8.8%(+33.1)#1,060 |
| 19. | Hickman | 41.6% | 10.0%(+31.6)#19 | 8.8%(+32.8)#1,091 |
| 20. | Ridgely | 41.4% | 10.0%(+31.4)#20 | 8.8%(+32.6)#1,106 |
| 21. | Clarkrange | 35.8% | 10.0%(+25.8)#21 | 8.8%(+27.0)#1,520 |
| 22. | Decaturville | 35.8% | 10.0%(+25.7)#22 | 8.8%(+27.0)#1,526 |
| 23. | Friendship | 35.6% | 10.0%(+25.6)#23 | 8.8%(+26.8)#1,548 |
| 24. | Rocky Top | 34.8% | 10.0%(+24.8)#24 | 8.8%(+26.0)#1,632 |
| 25. | Decatur | 34.1% | 10.0%(+24.1)#25 | 8.8%(+25.3)#1,700 |
| 26. | Jamestown | 33.5% | 10.0%(+23.5)#26 | 8.8%(+24.7)#1,759 |
| 27. | Henning | 33.3% | 10.0%(+23.3)#27 | 8.8%(+24.6)#1,768 |
| 28. | Toone | 32.6% | 10.0%(+22.5)#28 | 8.8%(+23.8)#1,879 |
| 29. | Cowan | 31.7% | 10.0%(+21.7)#29 | 8.8%(+22.9)#1,968 |
| 30. | Wartburg | 31.6% | 10.0%(+21.6)#30 | 8.8%(+22.8)#1,987 |
| 31. | Bells | 31.3% | 10.0%(+21.3)#31 | 8.8%(+22.5)#2,025 |
| 32. | Lawrenceburg | 31.0% | 10.0%(+21.0)#32 | 8.8%(+22.2)#2,070 |
| 33. | Somerville | 30.5% | 10.0%(+20.4)#33 | 8.8%(+21.7)#2,154 |
| 34. | Rockvale | 30.1% | 10.0%(+20.1)#34 | 8.8%(+21.3)#2,203 |
| 35. | Cottage Grove | 30.0% | 10.0%(+20.0)#35 | 8.8%(+21.2)#2,238 |
| 36. | Oneida | 29.8% | 10.0%(+19.8)#36 | 8.8%(+21.1)#2,266 |
| 37. | Red Boiling Springs | 29.5% | 10.0%(+19.4)#37 | 8.8%(+20.7)#2,312 |
| 38. | Dunlap | 29.3% | 10.0%(+19.3)#38 | 8.8%(+20.5)#2,334 |
| 39. | Obion | 29.1% | 10.0%(+19.1)#39 | 8.8%(+20.3)#2,367 |
| 40. | Sunbright | 28.5% | 10.0%(+18.5)#40 | 8.8%(+19.7)#2,481 |
| 41. | John Sevier | 28.5% | 10.0%(+18.5)#41 | 8.8%(+19.7)#2,482 |
| 42. | Huntsville | 28.4% | 10.0%(+18.4)#42 | 8.8%(+19.6)#2,495 |
| 43. | Randolph | 28.4% | 10.0%(+18.4)#43 | 8.8%(+19.6)#2,496 |
| 44. | Gallaway | 28.3% | 10.0%(+18.3)#44 | 8.8%(+19.5)#2,512 |
| 45. | La Follette | 27.8% | 10.0%(+17.8)#45 | 8.8%(+19.0)#2,608 |
| 46. | Pulaski | 27.4% | 10.0%(+17.4)#46 | 8.8%(+18.6)#2,687 |
| 47. | Bon Air | 26.4% | 10.0%(+16.4)#47 | 8.8%(+17.6)#2,893 |
| 48. | Mountain City | 26.2% | 10.0%(+16.2)#48 | 8.8%(+17.4)#2,951 |
| 49. | Walnut Grove Cdp Hardin County | 25.9% | 10.0%(+15.9)#49 | 8.8%(+17.1)#3,030 |
| 50. | South Fulton | 25.7% | 10.0%(+15.7)#50 | 8.8%(+16.9)#3,059 |
| 51. | Hohenwald | 25.7% | 10.0%(+15.7)#51 | 8.8%(+16.9)#3,065 |
| 52. | Newport | 25.6% | 10.0%(+15.6)#52 | 8.8%(+16.8)#3,085 |
| 53. | Tazewell | 25.6% | 10.0%(+15.5)#53 | 8.8%(+16.8)#3,094 |
| 54. | Lewisburg | 25.5% | 10.0%(+15.5)#54 | 8.8%(+16.8)#3,098 |
| 55. | Sardis | 25.2% | 10.0%(+15.2)#55 | 8.8%(+16.4)#3,173 |
| 56. | Elkton | 25.0% | 10.0%(+15.0)#56 | 8.8%(+16.2)#3,210 |
| 57. | Baileyton | 24.8% | 10.0%(+14.8)#57 | 8.8%(+16.0)#3,296 |
| 58. | Dyer | 24.6% | 10.0%(+14.6)#58 | 8.8%(+15.8)#3,333 |
| 59. | Huntingdon | 24.4% | 10.0%(+14.4)#59 | 8.8%(+15.6)#3,388 |
| 60. | Mitchellville | 24.3% | 10.0%(+14.3)#60 | 8.8%(+15.5)#3,416 |
| 61. | Brownsville | 24.2% | 10.0%(+14.2)#61 | 8.8%(+15.5)#3,430 |
| 62. | Clifton | 24.1% | 10.0%(+14.1)#62 | 8.8%(+15.4)#3,457 |
| 63. | Morrison | 23.9% | 10.0%(+13.9)#63 | 8.8%(+15.1)#3,529 |
| 64. | Rives | 23.7% | 10.0%(+13.7)#64 | 8.8%(+14.9)#3,572 |
| 65. | Savannah | 23.4% | 10.0%(+13.4)#65 | 8.8%(+14.6)#3,645 |
| 66. | Bon Aqua Junction | 23.4% | 10.0%(+13.3)#66 | 8.8%(+14.6)#3,664 |
| 67. | Smithville | 23.3% | 10.0%(+13.3)#67 | 8.8%(+14.5)#3,676 |
| 68. | Woodbury | 23.1% | 10.0%(+13.1)#68 | 8.8%(+14.3)#3,727 |
| 69. | Normandy | 23.1% | 10.0%(+13.1)#69 | 8.8%(+14.3)#3,743 |
| 70. | Lyles | 22.7% | 10.0%(+12.7)#70 | 8.8%(+13.9)#3,864 |
| 71. | Leoma | 21.9% | 10.0%(+11.9)#71 | 8.8%(+13.1)#4,117 |
| 72. | Tellico Plains | 21.6% | 10.0%(+11.6)#72 | 8.8%(+12.9)#4,214 |
| 73. | Dodson Branch | 21.6% | 10.0%(+11.6)#73 | 8.8%(+12.8)#4,230 |
| 74. | Trenton | 21.4% | 10.0%(+11.4)#74 | 8.8%(+12.6)#4,291 |
| 75. | Paris | 21.4% | 10.0%(+11.4)#75 | 8.8%(+12.6)#4,301 |
| 76. | Jellico | 21.3% | 10.0%(+11.3)#76 | 8.8%(+12.5)#4,323 |
| 77. | South Carthage | 21.3% | 10.0%(+11.2)#77 | 8.8%(+12.5)#4,341 |
| 78. | Whiteville | 21.2% | 10.0%(+11.2)#78 | 8.8%(+12.4)#4,353 |
| 79. | Doyle | 21.0% | 10.0%(+11.0)#79 | 8.8%(+12.2)#4,430 |
| 80. | Rogersville | 21.0% | 10.0%(+11.0)#80 | 8.8%(+12.2)#4,456 |
| 81. | Ripley | 20.8% | 10.0%(+10.8)#81 | 8.8%(+12.0)#4,523 |
| 82. | Monterey | 20.7% | 10.0%(+10.7)#82 | 8.8%(+12.0)#4,541 |
| 83. | Covington | 20.6% | 10.0%(+10.6)#83 | 8.8%(+11.8)#4,585 |
| 84. | Middleton | 20.6% | 10.0%(+10.6)#84 | 8.8%(+11.8)#4,598 |
| 85. | Hollow Rock | 20.6% | 10.0%(+10.5)#85 | 8.8%(+11.8)#4,614 |
| 86. | Luttrell | 20.5% | 10.0%(+10.5)#86 | 8.8%(+11.7)#4,636 |
| 87. | Bloomingdale | 20.2% | 10.0%(+10.2)#87 | 8.8%(+11.4)#4,763 |
| 88. | Jackson | 20.1% | 10.0%(+10.1)#88 | 8.8%(+11.3)#4,791 |
| 89. | Waynesboro | 20.0% | 10.0%(+10.0)#89 | 8.8%(+11.3)#4,803 |
| 90. | Cumberland City | 20.0% | 10.0%(+9.99)#90 | 8.8%(+11.2)#4,826 |
| 91. | Bransford | 20.0% | 10.0%(+9.99)#91 | 8.8%(+11.2)#4,858 |
| 92. | Surgoinsville | 20.0% | 10.0%(+9.96)#92 | 8.8%(+11.2)#4,901 |
| 93. | Pigeon Forge | 19.9% | 10.0%(+9.86)#93 | 8.8%(+11.1)#4,932 |
| 94. | Gates | 19.8% | 10.0%(+9.80)#94 | 8.8%(+11.0)#4,950 |
| 95. | Adamsville | 19.8% | 10.0%(+9.76)#95 | 8.8%(+11.0)#4,963 |
| 96. | Palmer | 19.7% | 10.0%(+9.69)#96 | 8.8%(+10.9)#4,979 |
| 97. | Livingston | 19.5% | 10.0%(+9.44)#97 | 8.8%(+10.7)#5,074 |
| 98. | Morristown | 19.4% | 10.0%(+9.44)#98 | 8.8%(+10.7)#5,077 |
| 99. | Coalfield | 19.2% | 10.0%(+9.16)#99 | 8.8%(+10.4)#5,179 |
| 100. | Gainesboro | 19.1% | 10.0%(+9.12)#100 | 8.8%(+10.3)#5,198 |
Common Questions
What are the Top 10 Cities with the Highest Poverty Level Among Families in Tennessee?
Top 10 Cities with the Highest Poverty Level Among Families in Tennessee are:
#1
63.5%
#2
54.0%
#3
47.5%
#4
47.4%
#5
46.7%
#6
43.6%
#7
43.2%
#8
42.6%
#9
41.9%
#10
41.9%
What city has the Highest Poverty Level Among Families in Tennessee?
Bethpage has the Highest Poverty Level Among Families in Tennessee with 63.5%.
What is the Poverty Level Among Families in the State of Tennessee?
Poverty Level Among Families in Tennessee is 10.0%.
What is the Poverty Level Among Families in the United States?
Poverty Level Among Families in the United States is 8.8%.