Cities with the Highest Poverty Level Among Families in North Carolina
RELATED REPORTS & OPTIONS
Highest Family Poverty
North Carolina
Compare Cities
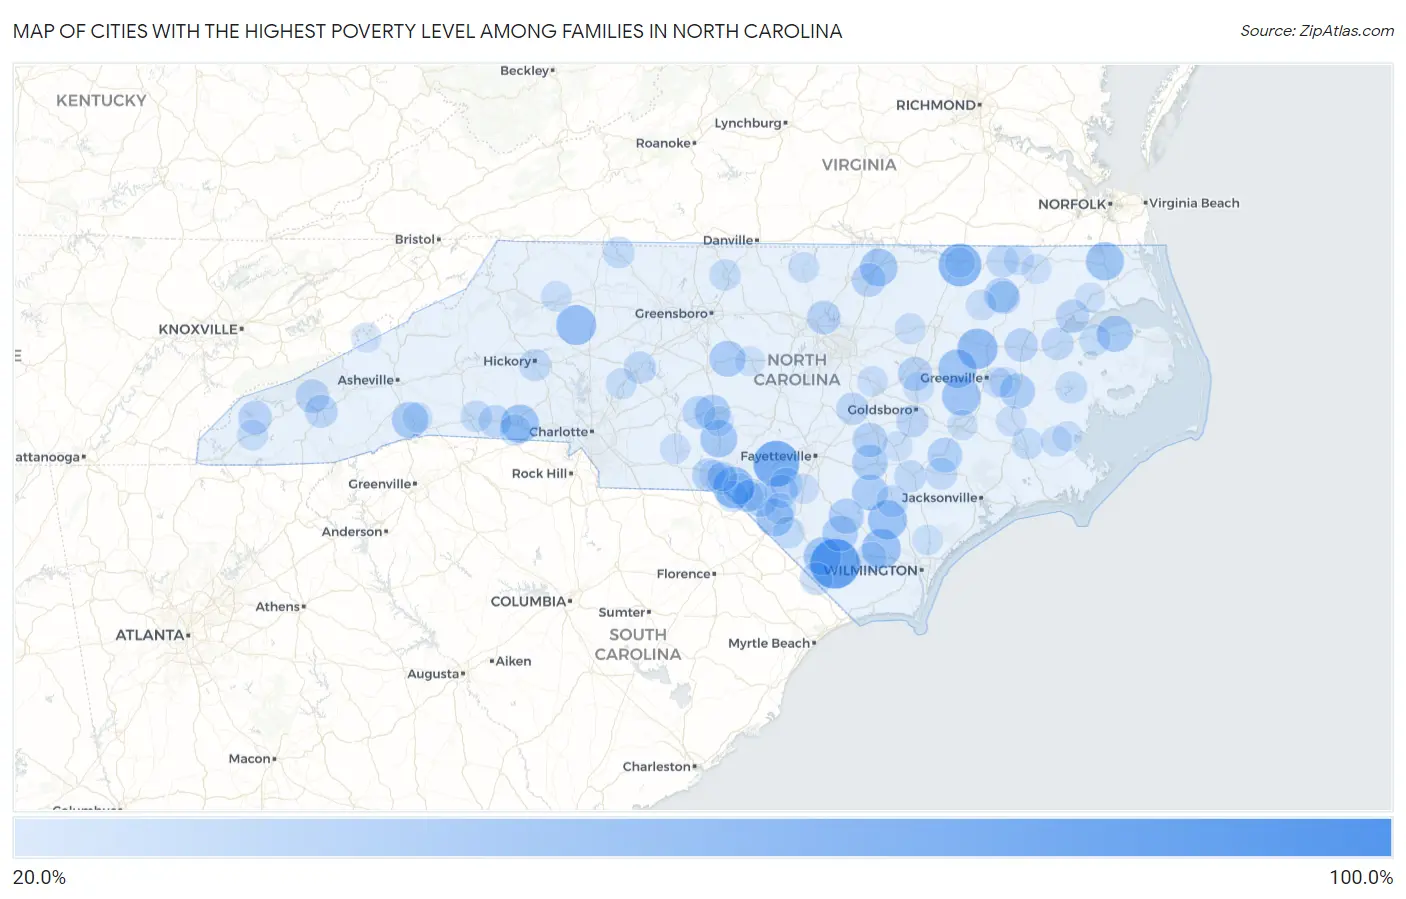
Map of Cities with the Highest Poverty Level Among Families in North Carolina
0.0%
100.0%
Cities with the Highest Poverty Level Among Families in North Carolina
| City | Family Poverty | vs State | vs National | |
| 1. | Long Creek | 100.0% | 9.5%(+90.5)#1 | 8.8%(+91.2)#63 |
| 2. | Brunswick | 84.1% | 9.5%(+74.6)#2 | 8.8%(+75.3)#148 |
| 3. | Silver City | 72.5% | 9.5%(+63.0)#3 | 8.8%(+63.7)#225 |
| 4. | South Weldon | 62.7% | 9.5%(+53.2)#4 | 8.8%(+54.0)#343 |
| 5. | Old Hundred | 58.0% | 9.5%(+48.5)#5 | 8.8%(+49.2)#424 |
| 6. | Conetoe | 55.4% | 9.5%(+45.9)#6 | 8.8%(+46.6)#488 |
| 7. | Love Valley | 54.3% | 9.5%(+44.8)#7 | 8.8%(+45.5)#520 |
| 8. | Sandyfield | 51.8% | 9.5%(+42.3)#8 | 8.8%(+43.0)#597 |
| 9. | Ivanhoe | 51.5% | 9.5%(+42.0)#9 | 8.8%(+42.7)#602 |
| 10. | Maury | 50.0% | 9.5%(+40.5)#10 | 8.8%(+41.2)#640 |
| 11. | Fountain | 50.0% | 9.5%(+40.5)#11 | 8.8%(+41.2)#643 |
| 12. | Light Oak | 48.9% | 9.5%(+39.4)#12 | 8.8%(+40.1)#716 |
| 13. | South Mills | 48.8% | 9.5%(+39.3)#13 | 8.8%(+40.0)#718 |
| 14. | Chadbourn | 47.0% | 9.5%(+37.5)#14 | 8.8%(+38.3)#797 |
| 15. | Elrod | 46.6% | 9.5%(+37.1)#15 | 8.8%(+37.8)#819 |
| 16. | Middleburg | 46.3% | 9.5%(+36.8)#16 | 8.8%(+37.6)#822 |
| 17. | Norman | 45.5% | 9.5%(+36.0)#17 | 8.8%(+36.7)#851 |
| 18. | Barker Heights | 43.3% | 9.5%(+33.8)#18 | 8.8%(+34.6)#969 |
| 19. | Columbia | 42.6% | 9.5%(+33.1)#19 | 8.8%(+33.9)#1,020 |
| 20. | Ramseur | 42.1% | 9.5%(+32.6)#20 | 8.8%(+33.3)#1,049 |
| 21. | Garland | 41.8% | 9.5%(+32.3)#21 | 8.8%(+33.0)#1,068 |
| 22. | Bonnetsville | 41.0% | 9.5%(+31.5)#22 | 8.8%(+32.3)#1,141 |
| 23. | Clarkton | 41.0% | 9.5%(+31.5)#23 | 8.8%(+32.2)#1,142 |
| 24. | Biscoe | 40.7% | 9.5%(+31.2)#24 | 8.8%(+31.9)#1,161 |
| 25. | Elizabethtown | 39.9% | 9.5%(+30.4)#25 | 8.8%(+31.1)#1,222 |
| 26. | Chocowinity | 39.4% | 9.5%(+29.9)#26 | 8.8%(+30.6)#1,256 |
| 27. | Pink Hill | 37.9% | 9.5%(+28.4)#27 | 8.8%(+29.1)#1,361 |
| 28. | Vann Crossroads | 37.5% | 9.5%(+28.0)#28 | 8.8%(+28.7)#1,379 |
| 29. | Roxobel | 37.3% | 9.5%(+27.8)#29 | 8.8%(+28.6)#1,403 |
| 30. | Chowan Beach | 37.1% | 9.5%(+27.6)#30 | 8.8%(+28.4)#1,417 |
| 31. | Lucama | 36.1% | 9.5%(+26.6)#31 | 8.8%(+27.3)#1,496 |
| 32. | South Henderson | 35.5% | 9.5%(+26.0)#32 | 8.8%(+26.7)#1,556 |
| 33. | Maxton | 35.5% | 9.5%(+26.0)#33 | 8.8%(+26.7)#1,558 |
| 34. | Gorman | 35.4% | 9.5%(+25.9)#34 | 8.8%(+26.6)#1,569 |
| 35. | Cherokee | 35.0% | 9.5%(+25.5)#35 | 8.8%(+26.2)#1,608 |
| 36. | Robbinsville | 34.7% | 9.5%(+25.2)#36 | 8.8%(+25.9)#1,639 |
| 37. | Williamston | 34.3% | 9.5%(+24.8)#37 | 8.8%(+25.5)#1,680 |
| 38. | Edenton | 34.2% | 9.5%(+24.7)#38 | 8.8%(+25.4)#1,693 |
| 39. | Cordova | 34.0% | 9.5%(+24.5)#39 | 8.8%(+25.2)#1,709 |
| 40. | Kelford | 33.3% | 9.5%(+23.8)#40 | 8.8%(+24.6)#1,784 |
| 41. | Red Springs | 33.3% | 9.5%(+23.8)#41 | 8.8%(+24.5)#1,835 |
| 42. | Troy | 32.8% | 9.5%(+23.3)#42 | 8.8%(+24.0)#1,855 |
| 43. | Sylva | 32.7% | 9.5%(+23.2)#43 | 8.8%(+23.9)#1,868 |
| 44. | East Laurinburg | 32.4% | 9.5%(+22.9)#44 | 8.8%(+23.6)#1,898 |
| 45. | Tabor City | 32.2% | 9.5%(+22.7)#45 | 8.8%(+23.5)#1,910 |
| 46. | Mooresboro | 31.5% | 9.5%(+22.0)#46 | 8.8%(+22.7)#2,002 |
| 47. | Benson | 31.3% | 9.5%(+21.8)#47 | 8.8%(+22.6)#2,022 |
| 48. | Brogden | 31.3% | 9.5%(+21.8)#48 | 8.8%(+22.5)#2,029 |
| 49. | Plymouth | 31.2% | 9.5%(+21.7)#49 | 8.8%(+22.4)#2,045 |
| 50. | Shannon | 31.0% | 9.5%(+21.5)#50 | 8.8%(+22.3)#2,067 |
| 51. | Conway | 30.9% | 9.5%(+21.4)#51 | 8.8%(+22.1)#2,078 |
| 52. | Magnolia | 30.7% | 9.5%(+21.2)#52 | 8.8%(+22.0)#2,114 |
| 53. | East Spencer | 30.7% | 9.5%(+21.2)#53 | 8.8%(+21.9)#2,121 |
| 54. | Harrells | 30.4% | 9.5%(+20.9)#54 | 8.8%(+21.6)#2,166 |
| 55. | Brookford | 30.3% | 9.5%(+20.8)#55 | 8.8%(+21.5)#2,181 |
| 56. | Dudley | 30.1% | 9.5%(+20.6)#56 | 8.8%(+21.3)#2,208 |
| 57. | Belhaven | 29.7% | 9.5%(+20.2)#57 | 8.8%(+21.0)#2,277 |
| 58. | Beulaville | 29.6% | 9.5%(+20.1)#58 | 8.8%(+20.8)#2,294 |
| 59. | Fairmont | 29.2% | 9.5%(+19.7)#59 | 8.8%(+20.5)#2,344 |
| 60. | Laurinburg | 28.8% | 9.5%(+19.3)#60 | 8.8%(+20.1)#2,409 |
| 61. | Forest City | 28.8% | 9.5%(+19.3)#61 | 8.8%(+20.0)#2,417 |
| 62. | Mount Airy | 28.8% | 9.5%(+19.3)#62 | 8.8%(+20.0)#2,426 |
| 63. | Hamlet | 28.7% | 9.5%(+19.2)#63 | 8.8%(+20.0)#2,430 |
| 64. | Pembroke | 28.6% | 9.5%(+19.1)#64 | 8.8%(+19.8)#2,443 |
| 65. | Gibson | 28.6% | 9.5%(+19.1)#65 | 8.8%(+19.8)#2,449 |
| 66. | Bridgeton | 28.1% | 9.5%(+18.6)#66 | 8.8%(+19.3)#2,553 |
| 67. | Creswell | 27.9% | 9.5%(+18.4)#67 | 8.8%(+19.1)#2,585 |
| 68. | Reidsville | 27.9% | 9.5%(+18.4)#68 | 8.8%(+19.1)#2,587 |
| 69. | Laurel Hill | 27.9% | 9.5%(+18.4)#69 | 8.8%(+19.1)#2,588 |
| 70. | Patterson Springs | 27.8% | 9.5%(+18.3)#70 | 8.8%(+19.0)#2,607 |
| 71. | Grimesland | 27.5% | 9.5%(+18.0)#71 | 8.8%(+18.7)#2,676 |
| 72. | Momeyer | 27.1% | 9.5%(+17.6)#72 | 8.8%(+18.3)#2,749 |
| 73. | China Grove | 27.0% | 9.5%(+17.5)#73 | 8.8%(+18.3)#2,756 |
| 74. | Andrews | 27.0% | 9.5%(+17.5)#74 | 8.8%(+18.2)#2,760 |
| 75. | Bolton | 26.9% | 9.5%(+17.4)#75 | 8.8%(+18.1)#2,799 |
| 76. | Bayboro | 26.7% | 9.5%(+17.2)#76 | 8.8%(+17.9)#2,830 |
| 77. | Fremont | 26.6% | 9.5%(+17.1)#77 | 8.8%(+17.9)#2,840 |
| 78. | Scotland Neck | 26.4% | 9.5%(+16.9)#78 | 8.8%(+17.6)#2,900 |
| 79. | Roxboro | 26.2% | 9.5%(+16.7)#79 | 8.8%(+17.4)#2,939 |
| 80. | Wilson S Mills | 26.1% | 9.5%(+16.6)#80 | 8.8%(+17.3)#2,979 |
| 81. | Simpson | 25.8% | 9.5%(+16.3)#81 | 8.8%(+17.1)#3,035 |
| 82. | Fairplains | 25.8% | 9.5%(+16.3)#82 | 8.8%(+17.0)#3,036 |
| 83. | Murfreesboro | 25.6% | 9.5%(+16.1)#83 | 8.8%(+16.8)#3,086 |
| 84. | Vanceboro | 25.5% | 9.5%(+16.0)#84 | 8.8%(+16.7)#3,114 |
| 85. | Arrowhead Beach | 25.5% | 9.5%(+16.0)#85 | 8.8%(+16.7)#3,118 |
| 86. | Ansonville | 25.4% | 9.5%(+15.9)#86 | 8.8%(+16.7)#3,135 |
| 87. | St Pauls | 25.4% | 9.5%(+15.9)#87 | 8.8%(+16.6)#3,144 |
| 88. | Rocky Point | 25.2% | 9.5%(+15.7)#88 | 8.8%(+16.4)#3,171 |
| 89. | Weldon | 25.0% | 9.5%(+15.5)#89 | 8.8%(+16.2)#3,199 |
| 90. | Vandemere | 25.0% | 9.5%(+15.5)#90 | 8.8%(+16.2)#3,226 |
| 91. | Kinston | 25.0% | 9.5%(+15.5)#91 | 8.8%(+16.2)#3,272 |
| 92. | East Rockingham | 24.9% | 9.5%(+15.4)#92 | 8.8%(+16.1)#3,279 |
| 93. | Hertford | 24.8% | 9.5%(+15.3)#93 | 8.8%(+16.0)#3,293 |
| 94. | Candor | 24.8% | 9.5%(+15.3)#94 | 8.8%(+16.0)#3,302 |
| 95. | Dana | 24.7% | 9.5%(+15.2)#95 | 8.8%(+15.9)#3,309 |
| 96. | Faison | 24.5% | 9.5%(+15.0)#96 | 8.8%(+15.8)#3,349 |
| 97. | Hot Springs | 24.5% | 9.5%(+15.0)#97 | 8.8%(+15.8)#3,350 |
| 98. | Dobbins Heights | 24.5% | 9.5%(+15.0)#98 | 8.8%(+15.7)#3,359 |
| 99. | Winton | 24.5% | 9.5%(+15.0)#99 | 8.8%(+15.7)#3,371 |
| 100. | Siler City | 24.3% | 9.5%(+14.8)#100 | 8.8%(+15.5)#3,422 |
Common Questions
What are the Top 10 Cities with the Highest Poverty Level Among Families in North Carolina?
Top 10 Cities with the Highest Poverty Level Among Families in North Carolina are:
#1
84.1%
#2
72.5%
#3
62.7%
#4
58.0%
#5
55.4%
#6
54.3%
#7
51.8%
#8
51.5%
#9
50.0%
#10
50.0%
What city has the Highest Poverty Level Among Families in North Carolina?
Brunswick has the Highest Poverty Level Among Families in North Carolina with 84.1%.
What is the Poverty Level Among Families in the State of North Carolina?
Poverty Level Among Families in North Carolina is 9.5%.
What is the Poverty Level Among Families in the United States?
Poverty Level Among Families in the United States is 8.8%.