Linnell Camp, CA Map & Demographics
Linnell Camp Map
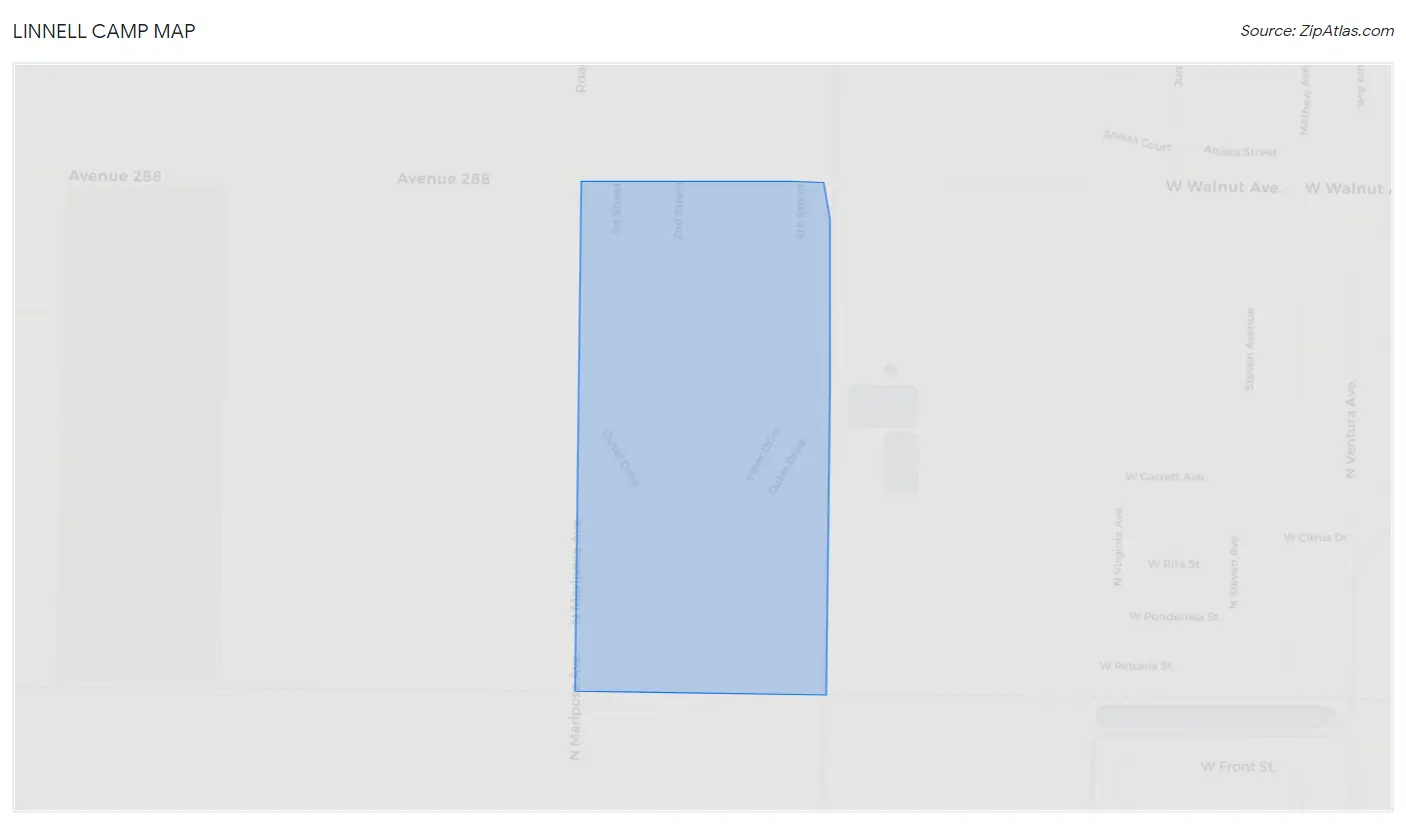
Linnell Camp Overview
$9,786
PER CAPITA INCOME
$33,292
AVG FAMILY INCOME
$33,292
AVG HOUSEHOLD INCOME
$14,258
FAMILY INCOME DEFICIT
0.36
INEQUALITY / GINI INDEX
737
TOTAL POPULATION
397
MALE POPULATION
340
FEMALE POPULATION
116.76
MALES / 100 FEMALES
85.64
FEMALES / 100 MALES
26.1
MEDIAN AGE
4.7
AVG FAMILY SIZE
4.7
AVG HOUSEHOLD SIZE
272
LABOR FORCE [ PEOPLE ]
66.2%
PERCENT IN LABOR FORCE
Income in Linnell Camp
Income Overview in Linnell Camp
Per Capita Income in Linnell Camp is $9,786, while median incomes of families and households are $33,292 and $33,292 respectively.
| Characteristic | Number | Measure |
| Per Capita Income | 737 | $9,786 |
| Median Family Income | 157 | $33,292 |
| Mean Family Income | 157 | $46,120 |
| Median Household Income | 157 | $33,292 |
| Mean Household Income | 157 | $46,120 |
| Income Deficit | 157 | $14,258 |
| Wage / Income Gap (%) | 737 | 0.00% |
| Wage / Income Gap ($) | 737 | 100.00¢ per $1 |
| Gini / Inequality Index | 737 | 0.36 |
Earnings by Sex in Linnell Camp
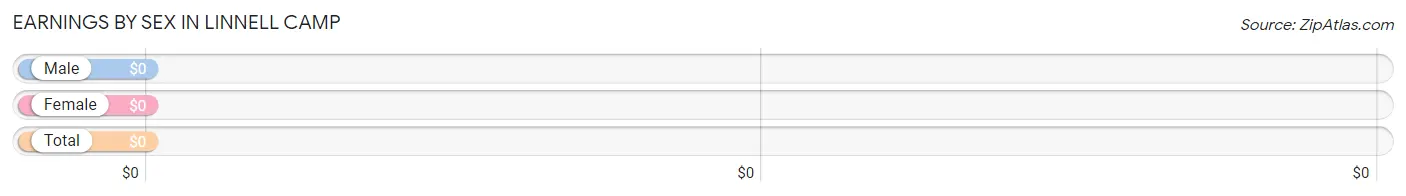
| Sex | Number | Average Earnings |
| Male | 190 (55.2%) | $0 |
| Female | 154 (44.8%) | $0 |
| Total | 344 (100.0%) | $0 |
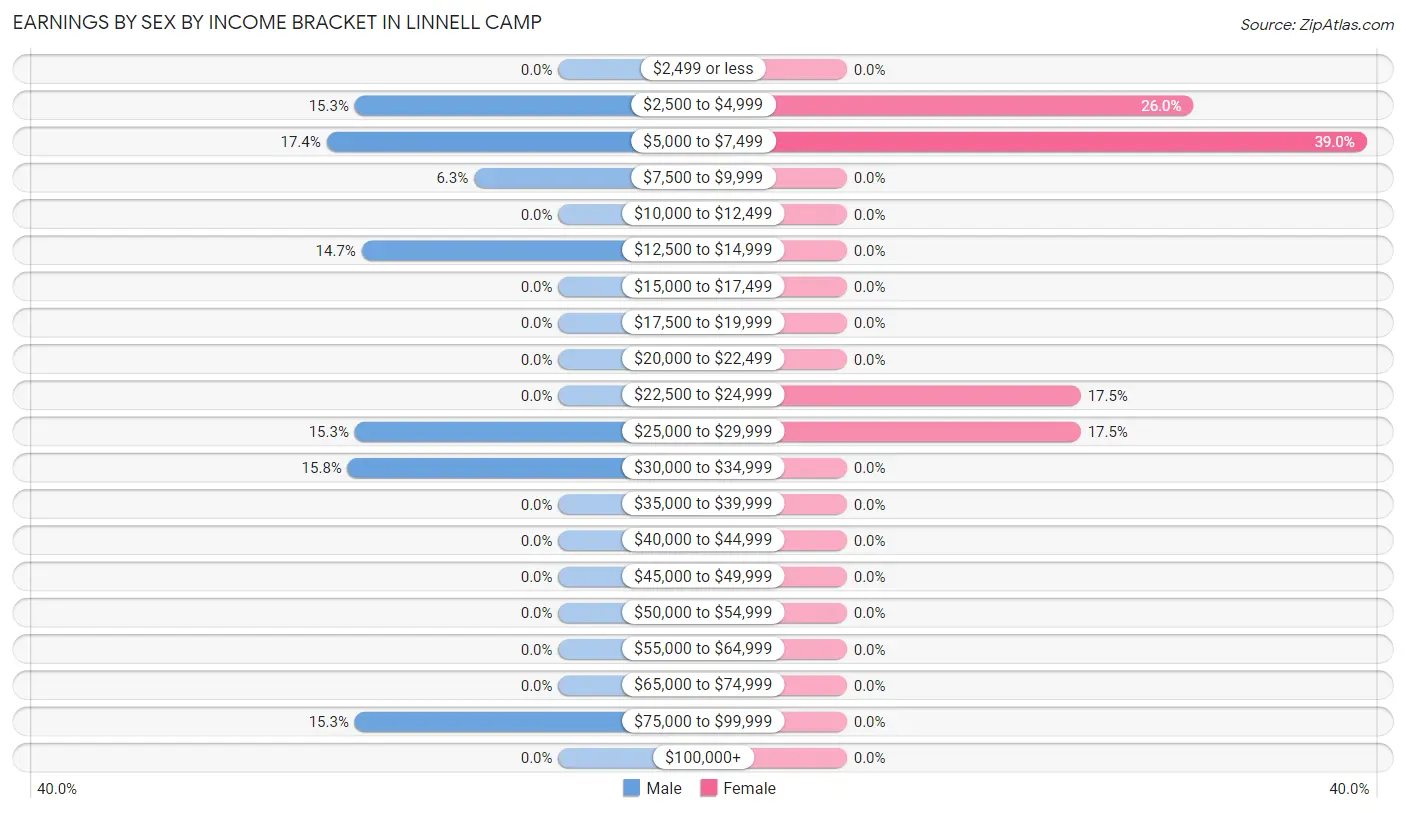
Earnings by Sex by Income Bracket in Linnell Camp
The most common earnings brackets in Linnell Camp are $5,000 to $7,499 for men (33 | 17.4%) and $5,000 to $7,499 for women (60 | 39.0%).
| Income | Male | Female |
| $2,499 or less | 0 (0.0%) | 0 (0.0%) |
| $2,500 to $4,999 | 29 (15.3%) | 40 (26.0%) |
| $5,000 to $7,499 | 33 (17.4%) | 60 (39.0%) |
| $7,500 to $9,999 | 12 (6.3%) | 0 (0.0%) |
| $10,000 to $12,499 | 0 (0.0%) | 0 (0.0%) |
| $12,500 to $14,999 | 28 (14.7%) | 0 (0.0%) |
| $15,000 to $17,499 | 0 (0.0%) | 0 (0.0%) |
| $17,500 to $19,999 | 0 (0.0%) | 0 (0.0%) |
| $20,000 to $22,499 | 0 (0.0%) | 0 (0.0%) |
| $22,500 to $24,999 | 0 (0.0%) | 27 (17.5%) |
| $25,000 to $29,999 | 29 (15.3%) | 27 (17.5%) |
| $30,000 to $34,999 | 30 (15.8%) | 0 (0.0%) |
| $35,000 to $39,999 | 0 (0.0%) | 0 (0.0%) |
| $40,000 to $44,999 | 0 (0.0%) | 0 (0.0%) |
| $45,000 to $49,999 | 0 (0.0%) | 0 (0.0%) |
| $50,000 to $54,999 | 0 (0.0%) | 0 (0.0%) |
| $55,000 to $64,999 | 0 (0.0%) | 0 (0.0%) |
| $65,000 to $74,999 | 0 (0.0%) | 0 (0.0%) |
| $75,000 to $99,999 | 29 (15.3%) | 0 (0.0%) |
| $100,000+ | 0 (0.0%) | 0 (0.0%) |
| Total | 190 (100.0%) | 154 (100.0%) |
Earnings by Sex by Educational Attainment in Linnell Camp
| Educational Attainment | Male Income | Female Income |
| Less than High School | - | - |
| High School Diploma | - | - |
| College or Associate's Degree | - | - |
| Bachelor's Degree | - | - |
| Graduate Degree | - | - |
| Total | - | - |
Family Income in Linnell Camp
Family Income Brackets in Linnell Camp
According to the Linnell Camp family income data, there are 57 families falling into the $15,000 to $24,999 income range, which is the most common income bracket and makes up 36.3% of all families.
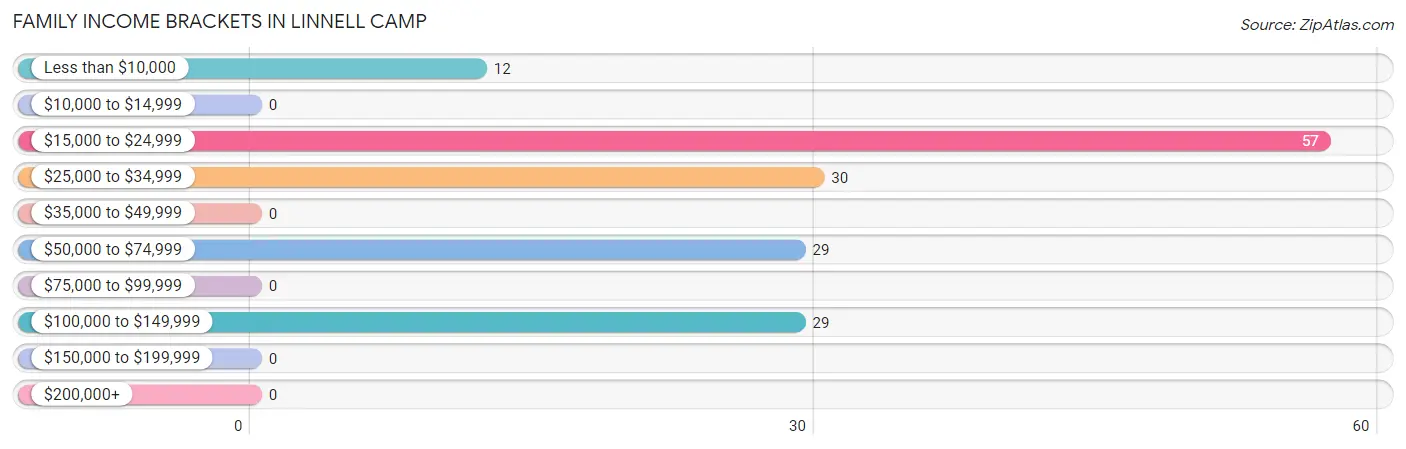
| Income Bracket | # Families | % Families |
| Less than $10,000 | 12 | 7.6% |
| $10,000 to $14,999 | 0 | 0.0% |
| $15,000 to $24,999 | 57 | 36.3% |
| $25,000 to $34,999 | 30 | 19.1% |
| $35,000 to $49,999 | 0 | 0.0% |
| $50,000 to $74,999 | 29 | 18.5% |
| $75,000 to $99,999 | 0 | 0.0% |
| $100,000 to $149,999 | 29 | 18.5% |
| $150,000 to $199,999 | 0 | 0.0% |
| $200,000+ | 0 | 0.0% |
Family Income by Famaliy Size in Linnell Camp
4-person families (87 | 55.4%) account for the highest median family income in Linnell Camp with $33,792 per family, while 4-person families (87 | 55.4%) have the highest median income of $8,448 per family member.
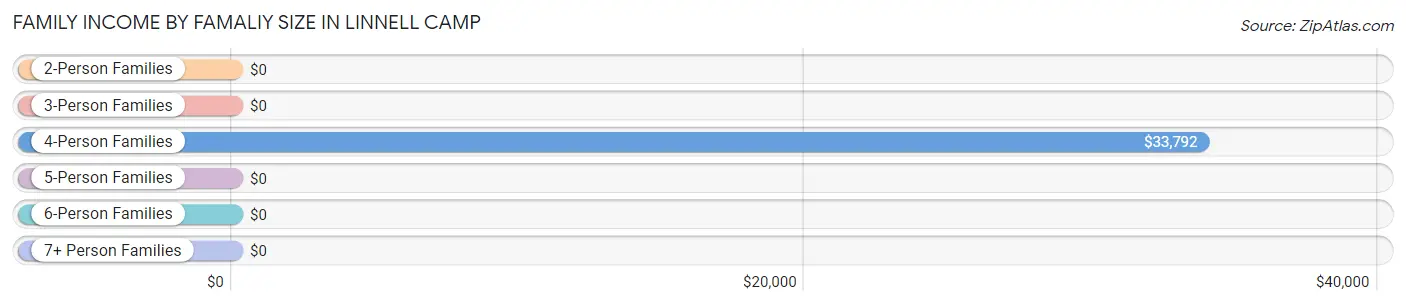
| Income Bracket | # Families | Median Income |
| 2-Person Families | 0 (0.0%) | $0 |
| 3-Person Families | 0 (0.0%) | $0 |
| 4-Person Families | 87 (55.4%) | $33,792 |
| 5-Person Families | 41 (26.1%) | $0 |
| 6-Person Families | 29 (18.5%) | $0 |
| 7+ Person Families | 0 (0.0%) | $0 |
| Total | 157 (100.0%) | $33,292 |
Family Income by Number of Earners in Linnell Camp
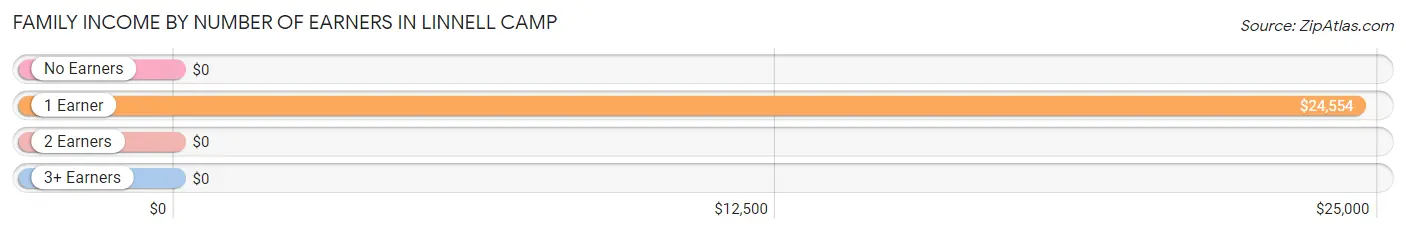
| Number of Earners | # Families | Median Income |
| No Earners | 0 (0.0%) | $0 |
| 1 Earner | 70 (44.6%) | $24,554 |
| 2 Earners | 58 (36.9%) | $0 |
| 3+ Earners | 29 (18.5%) | $0 |
| Total | 157 (100.0%) | $33,292 |
Household Income in Linnell Camp
Household Income Brackets in Linnell Camp
With 57 households falling in the category, the $15,000 to $24,999 income range is the most frequent in Linnell Camp, accounting for 36.3% of all households.
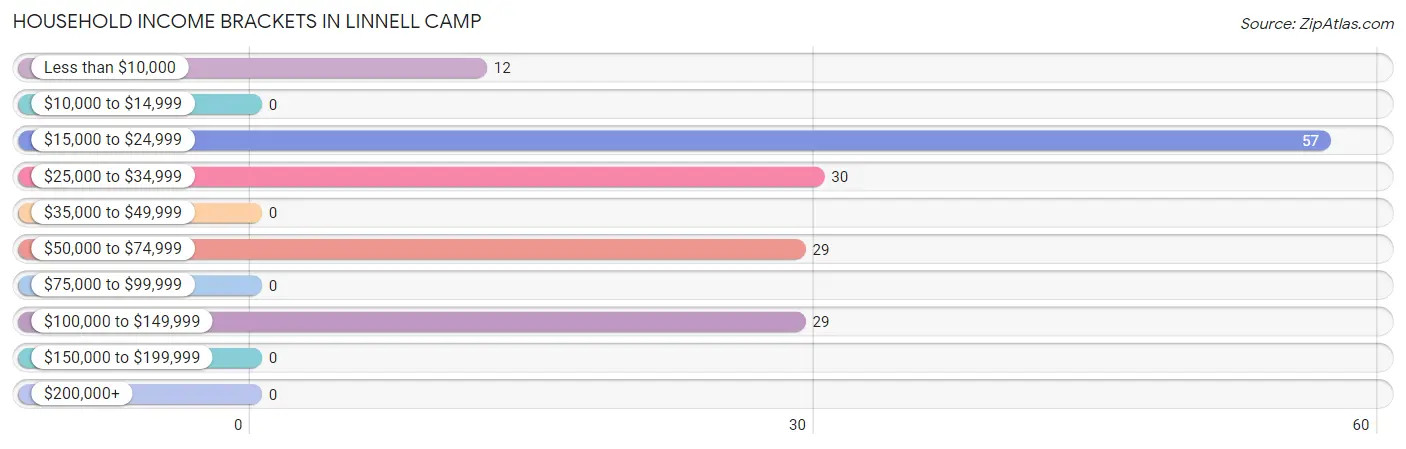
| Income Bracket | # Households | % Households |
| Less than $10,000 | 12 | 7.6% |
| $10,000 to $14,999 | 0 | 0.0% |
| $15,000 to $24,999 | 57 | 36.3% |
| $25,000 to $34,999 | 30 | 19.1% |
| $35,000 to $49,999 | 0 | 0.0% |
| $50,000 to $74,999 | 29 | 18.5% |
| $75,000 to $99,999 | 0 | 0.0% |
| $100,000 to $149,999 | 29 | 18.5% |
| $150,000 to $199,999 | 0 | 0.0% |
| $200,000+ | 0 | 0.0% |
Household Income by Householder Age in Linnell Camp
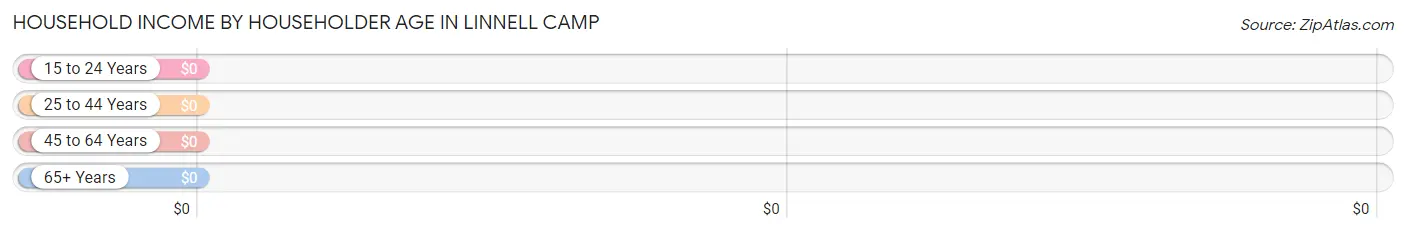
| Income Bracket | # Households | Median Income |
| 15 to 24 Years | 0 (0.0%) | $0 |
| 25 to 44 Years | 128 (81.5%) | $0 |
| 45 to 64 Years | 29 (18.5%) | $0 |
| 65+ Years | 0 (0.0%) | $0 |
| Total | 157 (100.0%) | $33,292 |
Poverty in Linnell Camp
Income Below Poverty by Sex and Age in Linnell Camp
With 49.9% poverty level for males and 52.9% for females among the residents of Linnell Camp, 12 to 14 year old males and 18 to 24 year old females are the most vulnerable to poverty, with 30 males (100.0%) and 40 females (100.0%) in their respective age groups living below the poverty level.
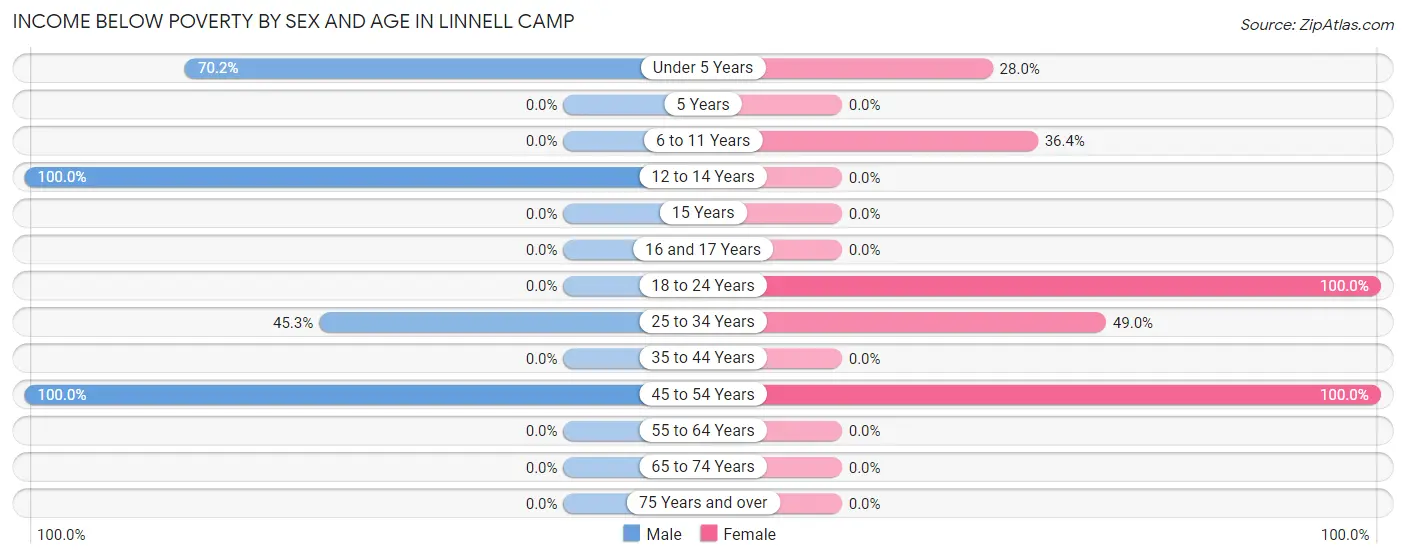
| Age Bracket | Male | Female |
| Under 5 Years | 66 (70.2%) | 21 (28.0%) |
| 5 Years | 0 (0.0%) | 0 (0.0%) |
| 6 to 11 Years | 0 (0.0%) | 16 (36.4%) |
| 12 to 14 Years | 30 (100.0%) | 0 (0.0%) |
| 15 Years | 0 (0.0%) | 0 (0.0%) |
| 16 and 17 Years | 0 (0.0%) | 0 (0.0%) |
| 18 to 24 Years | 0 (0.0%) | 40 (100.0%) |
| 25 to 34 Years | 73 (45.3%) | 75 (49.0%) |
| 35 to 44 Years | 0 (0.0%) | 0 (0.0%) |
| 45 to 54 Years | 29 (100.0%) | 28 (100.0%) |
| 55 to 64 Years | 0 (0.0%) | 0 (0.0%) |
| 65 to 74 Years | 0 (0.0%) | 0 (0.0%) |
| 75 Years and over | 0 (0.0%) | 0 (0.0%) |
| Total | 198 (49.9%) | 180 (52.9%) |
Income Above Poverty by Sex and Age in Linnell Camp
According to the poverty statistics in Linnell Camp, males aged 6 to 11 years and females aged under 5 years are the age groups that are most secure financially, with 100.0% of males and 72.0% of females in these age groups living above the poverty line.
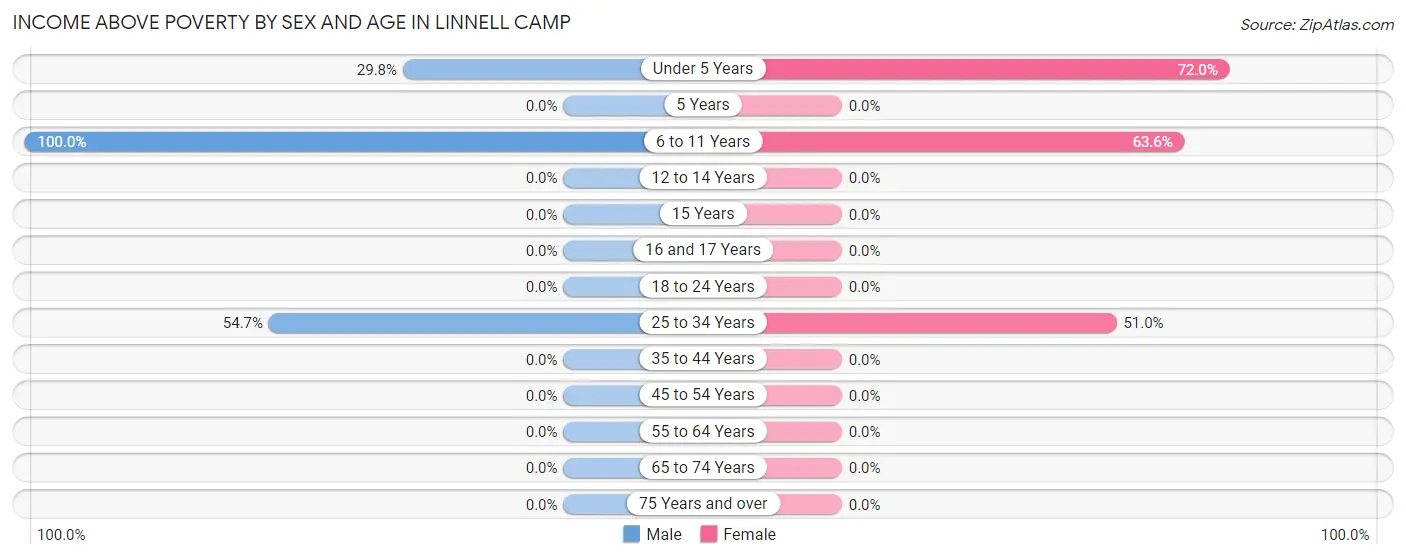
| Age Bracket | Male | Female |
| Under 5 Years | 28 (29.8%) | 54 (72.0%) |
| 5 Years | 0 (0.0%) | 0 (0.0%) |
| 6 to 11 Years | 83 (100.0%) | 28 (63.6%) |
| 12 to 14 Years | 0 (0.0%) | 0 (0.0%) |
| 15 Years | 0 (0.0%) | 0 (0.0%) |
| 16 and 17 Years | 0 (0.0%) | 0 (0.0%) |
| 18 to 24 Years | 0 (0.0%) | 0 (0.0%) |
| 25 to 34 Years | 88 (54.7%) | 78 (51.0%) |
| 35 to 44 Years | 0 (0.0%) | 0 (0.0%) |
| 45 to 54 Years | 0 (0.0%) | 0 (0.0%) |
| 55 to 64 Years | 0 (0.0%) | 0 (0.0%) |
| 65 to 74 Years | 0 (0.0%) | 0 (0.0%) |
| 75 Years and over | 0 (0.0%) | 0 (0.0%) |
| Total | 199 (50.1%) | 160 (47.1%) |
Income Below Poverty Among Married-Couple Families in Linnell Camp
The poverty statistics for married-couple families in Linnell Camp show that 44.0% or 69 of the total 157 families live below the poverty line. Families with 1 or 2 children have the highest poverty rate of 49.1%, comprising of 57 families. On the other hand, families with 3 or 4 children have the lowest poverty rate of 29.3%, which includes 12 families.
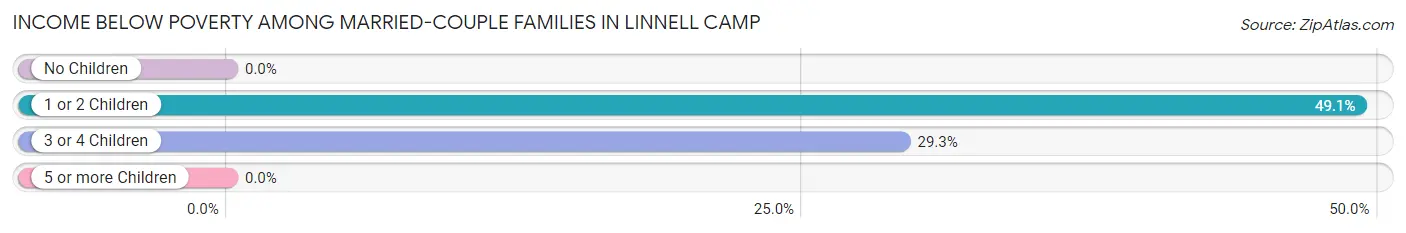
| Children | Above Poverty | Below Poverty |
| No Children | 0 (0.0%) | 0 (0.0%) |
| 1 or 2 Children | 59 (50.9%) | 57 (49.1%) |
| 3 or 4 Children | 29 (70.7%) | 12 (29.3%) |
| 5 or more Children | 0 (0.0%) | 0 (0.0%) |
| Total | 88 (56.0%) | 69 (44.0%) |
Income Below Poverty Among Single-Parent Households in Linnell Camp
| Children | Single Father | Single Mother |
| No Children | 0 (0.0%) | 0 (0.0%) |
| 1 or 2 Children | 0 (0.0%) | 0 (0.0%) |
| 3 or 4 Children | 0 (0.0%) | 0 (0.0%) |
| 5 or more Children | 0 (0.0%) | 0 (0.0%) |
| Total | 0 (0.0%) | 0 (0.0%) |
Income Below Poverty Among Married-Couple vs Single-Parent Households in Linnell Camp
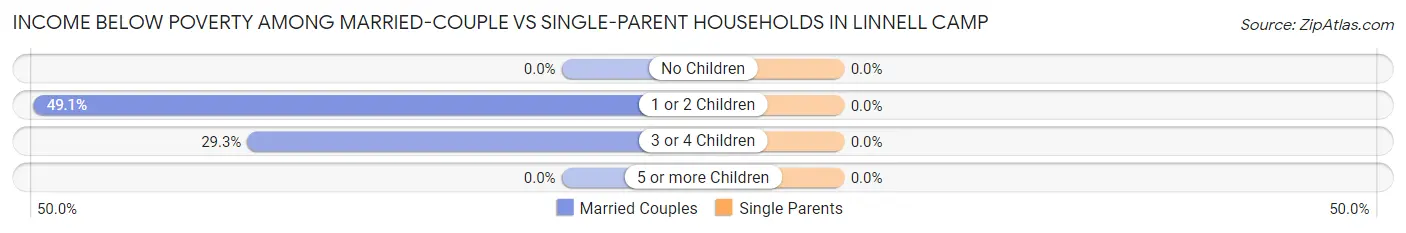
| Children | Married-Couple Families | Single-Parent Households |
| No Children | 0 (0.0%) | 0 (0.0%) |
| 1 or 2 Children | 57 (49.1%) | 0 (0.0%) |
| 3 or 4 Children | 12 (29.3%) | 0 (0.0%) |
| 5 or more Children | 0 (0.0%) | 0 (0.0%) |
| Total | 69 (44.0%) | 0 (0.0%) |
Race in Linnell Camp
The most populous races in Linnell Camp are Hispanic or Latino (737 | 100.0%), Some other Race (487 | 66.1%), and Two or more Races (139 | 18.9%).
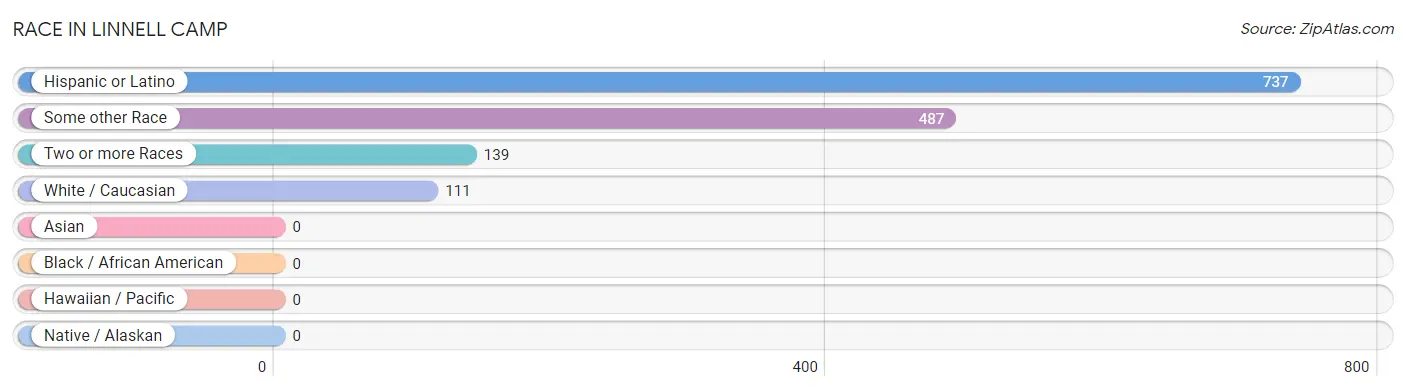
| Race | # Population | % Population |
| Asian | 0 | 0.0% |
| Black / African American | 0 | 0.0% |
| Hawaiian / Pacific | 0 | 0.0% |
| Hispanic or Latino | 737 | 100.0% |
| Native / Alaskan | 0 | 0.0% |
| White / Caucasian | 111 | 15.1% |
| Two or more Races | 139 | 18.9% |
| Some other Race | 487 | 66.1% |
| Total | 737 | 100.0% |
Ancestry in Linnell Camp
The most populous ancestries reported in Linnell Camp are , and Mexican (737 | 100.0%), together accounting for 100.0% of all Linnell Camp residents.

| Ancestry | # Population | % Population |
| Mexican | 737 | 100.0% | View All 1 Rows |
Immigrants in Linnell Camp
The most numerous immigrant groups reported in Linnell Camp came from Central America (430 | 58.3%), Latin America (430 | 58.3%), and Mexico (430 | 58.3%), together accounting for 175.0% of all Linnell Camp residents.
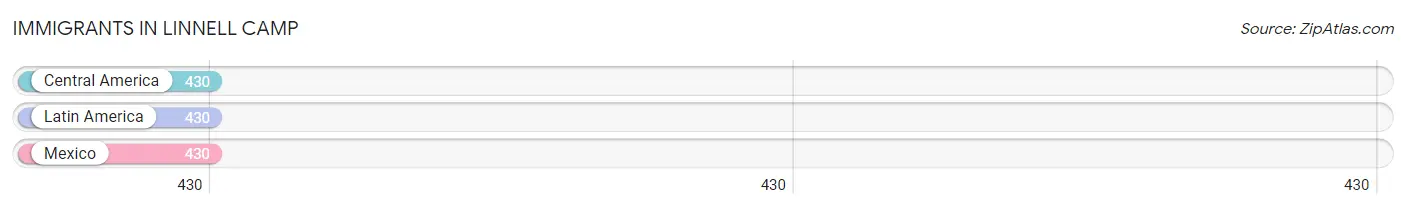
| Immigration Origin | # Population | % Population |
| Central America | 430 | 58.3% |
| Latin America | 430 | 58.3% |
| Mexico | 430 | 58.3% | View All 3 Rows |
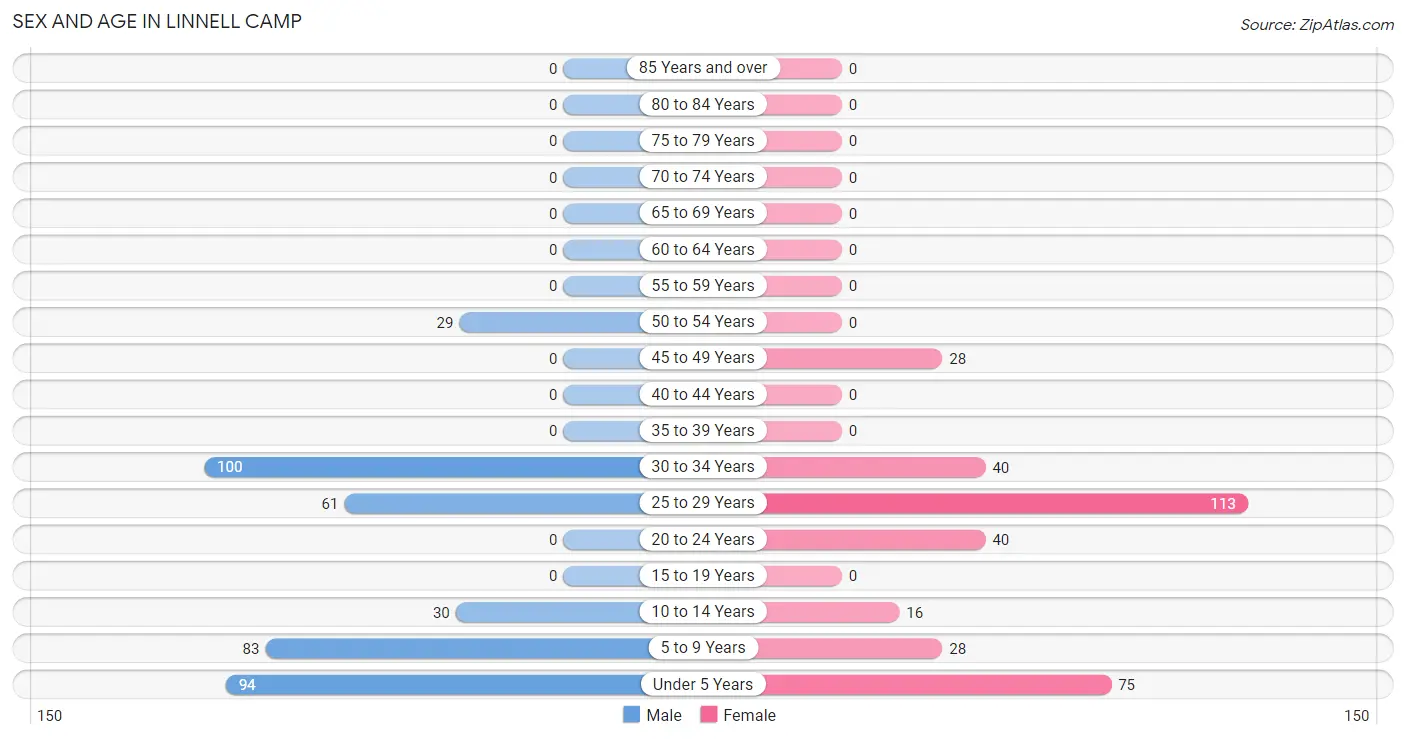
Sex and Age in Linnell Camp
Sex and Age in Linnell Camp
The most populous age groups in Linnell Camp are 30 to 34 Years (100 | 25.2%) for men and 25 to 29 Years (113 | 33.2%) for women.
| Age Bracket | Male | Female |
| Under 5 Years | 94 (23.7%) | 75 (22.1%) |
| 5 to 9 Years | 83 (20.9%) | 28 (8.2%) |
| 10 to 14 Years | 30 (7.6%) | 16 (4.7%) |
| 15 to 19 Years | 0 (0.0%) | 0 (0.0%) |
| 20 to 24 Years | 0 (0.0%) | 40 (11.8%) |
| 25 to 29 Years | 61 (15.4%) | 113 (33.2%) |
| 30 to 34 Years | 100 (25.2%) | 40 (11.8%) |
| 35 to 39 Years | 0 (0.0%) | 0 (0.0%) |
| 40 to 44 Years | 0 (0.0%) | 0 (0.0%) |
| 45 to 49 Years | 0 (0.0%) | 28 (8.2%) |
| 50 to 54 Years | 29 (7.3%) | 0 (0.0%) |
| 55 to 59 Years | 0 (0.0%) | 0 (0.0%) |
| 60 to 64 Years | 0 (0.0%) | 0 (0.0%) |
| 65 to 69 Years | 0 (0.0%) | 0 (0.0%) |
| 70 to 74 Years | 0 (0.0%) | 0 (0.0%) |
| 75 to 79 Years | 0 (0.0%) | 0 (0.0%) |
| 80 to 84 Years | 0 (0.0%) | 0 (0.0%) |
| 85 Years and over | 0 (0.0%) | 0 (0.0%) |
| Total | 397 (100.0%) | 340 (100.0%) |
Families and Households in Linnell Camp
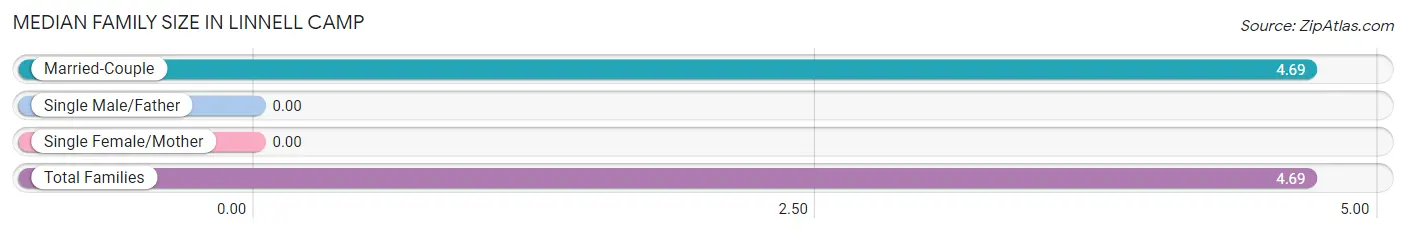
Median Family Size in Linnell Camp
| Family Type | # Families | Family Size |
| Married-Couple | 157 (100.0%) | 4.69 |
| Single Male/Father | 0 (0.0%) | - |
| Single Female/Mother | 0 (0.0%) | - |
| Total Families | 157 (100.0%) | 4.69 |
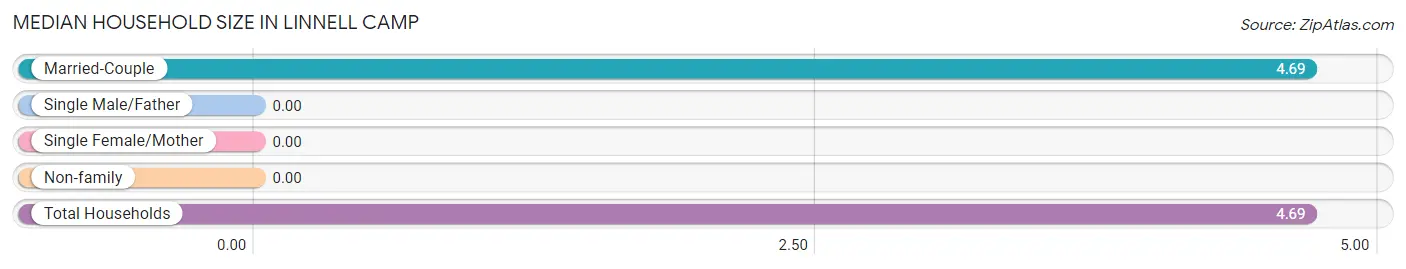
Median Household Size in Linnell Camp
| Household Type | # Households | Household Size |
| Married-Couple | 157 (100.0%) | 4.69 |
| Single Male/Father | 0 (0.0%) | - |
| Single Female/Mother | 0 (0.0%) | - |
| Non-family | 0 (0.0%) | - |
| Total Households | 157 (100.0%) | 4.69 |
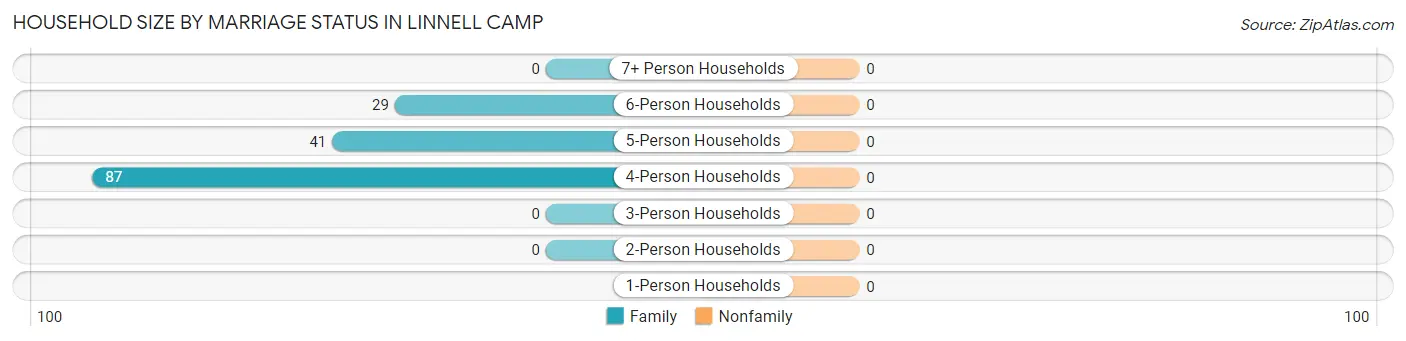
Household Size by Marriage Status in Linnell Camp
| Household Size | Family Households | Nonfamily Households |
| 1-Person Households | - | 0 (0.0%) |
| 2-Person Households | 0 (0.0%) | 0 (0.0%) |
| 3-Person Households | 0 (0.0%) | 0 (0.0%) |
| 4-Person Households | 87 (55.4%) | 0 (0.0%) |
| 5-Person Households | 41 (26.1%) | 0 (0.0%) |
| 6-Person Households | 29 (18.5%) | 0 (0.0%) |
| 7+ Person Households | 0 (0.0%) | 0 (0.0%) |
| Total | 157 (100.0%) | 0 (0.0%) |
Female Fertility in Linnell Camp
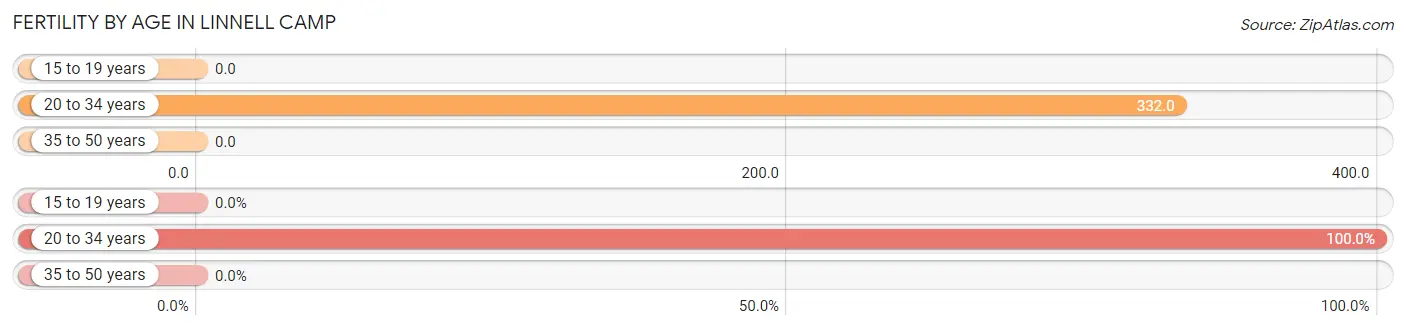
Fertility by Age in Linnell Camp
Average fertility rate in Linnell Camp is 290.0 births per 1,000 women. Women in the age bracket of 20 to 34 years have the highest fertility rate with 332.0 births per 1,000 women. Women in the age bracket of 20 to 34 years acount for 100.0% of all women with births.
| Age Bracket | Women with Births | Births / 1,000 Women |
| 15 to 19 years | 0 (0.0%) | 0.0 |
| 20 to 34 years | 64 (100.0%) | 332.0 |
| 35 to 50 years | 0 (0.0%) | 0.0 |
| Total | 64 (100.0%) | 290.0 |
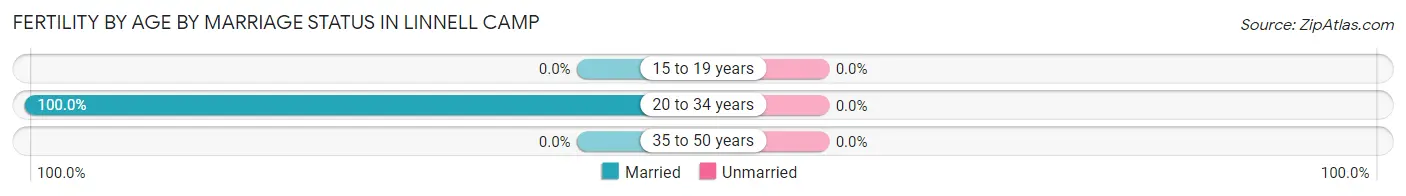
Fertility by Age by Marriage Status in Linnell Camp
| Age Bracket | Married | Unmarried |
| 15 to 19 years | 0 (0.0%) | 0 (0.0%) |
| 20 to 34 years | 64 (100.0%) | 0 (0.0%) |
| 35 to 50 years | 0 (0.0%) | 0 (0.0%) |
| Total | 64 (100.0%) | 0 (0.0%) |
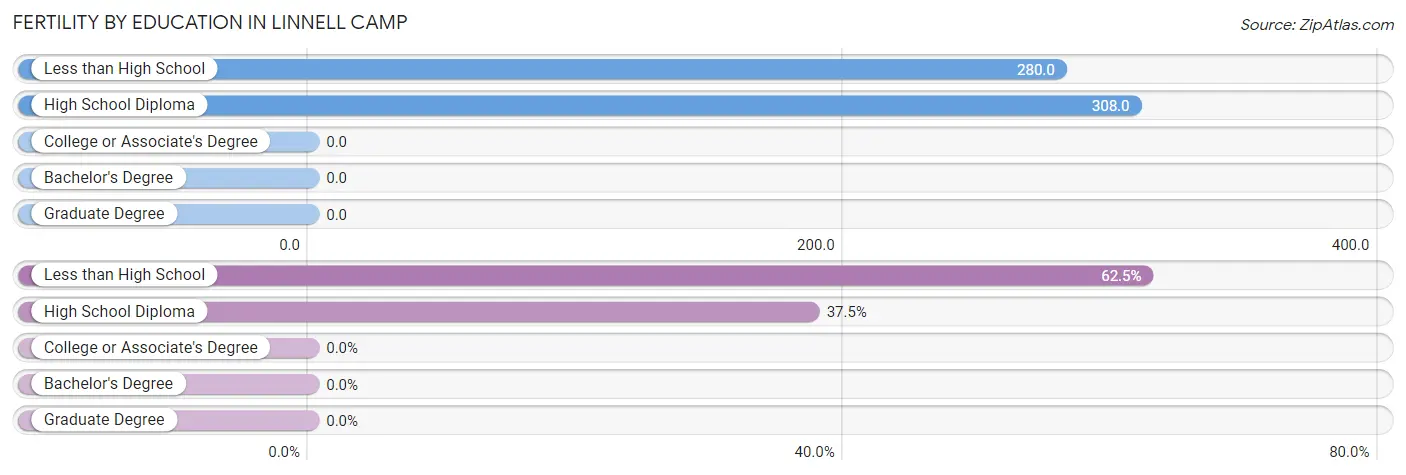
Fertility by Education in Linnell Camp
| Educational Attainment | Women with Births | Births / 1,000 Women |
| Less than High School | 40 (62.5%) | 280.0 |
| High School Diploma | 24 (37.5%) | 308.0 |
| College or Associate's Degree | 0 (0.0%) | 0.0 |
| Bachelor's Degree | 0 (0.0%) | 0.0 |
| Graduate Degree | 0 (0.0%) | 0.0 |
| Total | 64 (100.0%) | 290.0 |
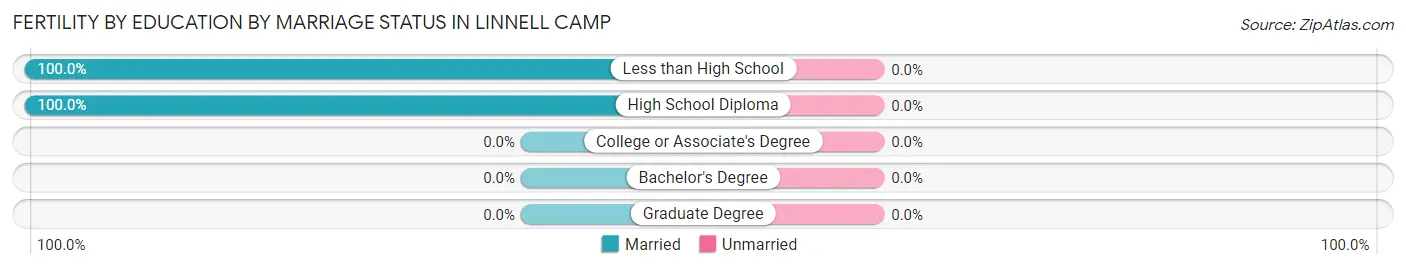
Fertility by Education by Marriage Status in Linnell Camp
| Educational Attainment | Married | Unmarried |
| Less than High School | 40 (100.0%) | 0 (0.0%) |
| High School Diploma | 24 (100.0%) | 0 (0.0%) |
| College or Associate's Degree | 0 (0.0%) | 0 (0.0%) |
| Bachelor's Degree | 0 (0.0%) | 0 (0.0%) |
| Graduate Degree | 0 (0.0%) | 0 (0.0%) |
| Total | 64 (100.0%) | 0 (0.0%) |
Employment Characteristics in Linnell Camp
Employment by Class of Employer in Linnell Camp
Among the 260 employed individuals in Linnell Camp, private company employees (233 | 89.6%), and not-for-profit organizations (27 | 10.4%) make up the most common classes of employment.
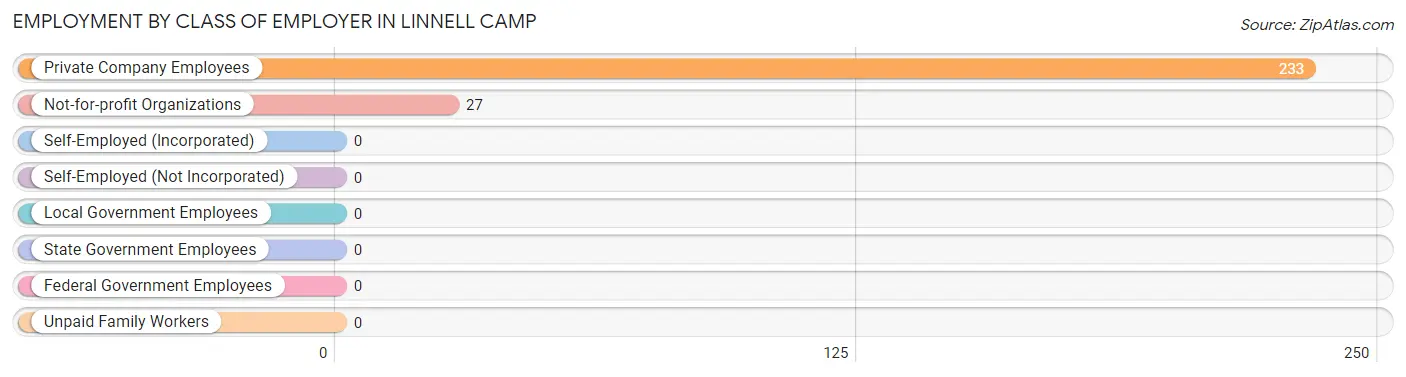
| Employer Class | # Employees | % Employees |
| Private Company Employees | 233 | 89.6% |
| Self-Employed (Incorporated) | 0 | 0.0% |
| Self-Employed (Not Incorporated) | 0 | 0.0% |
| Not-for-profit Organizations | 27 | 10.4% |
| Local Government Employees | 0 | 0.0% |
| State Government Employees | 0 | 0.0% |
| Federal Government Employees | 0 | 0.0% |
| Unpaid Family Workers | 0 | 0.0% |
| Total | 260 | 100.0% |
Employment Status by Age in Linnell Camp
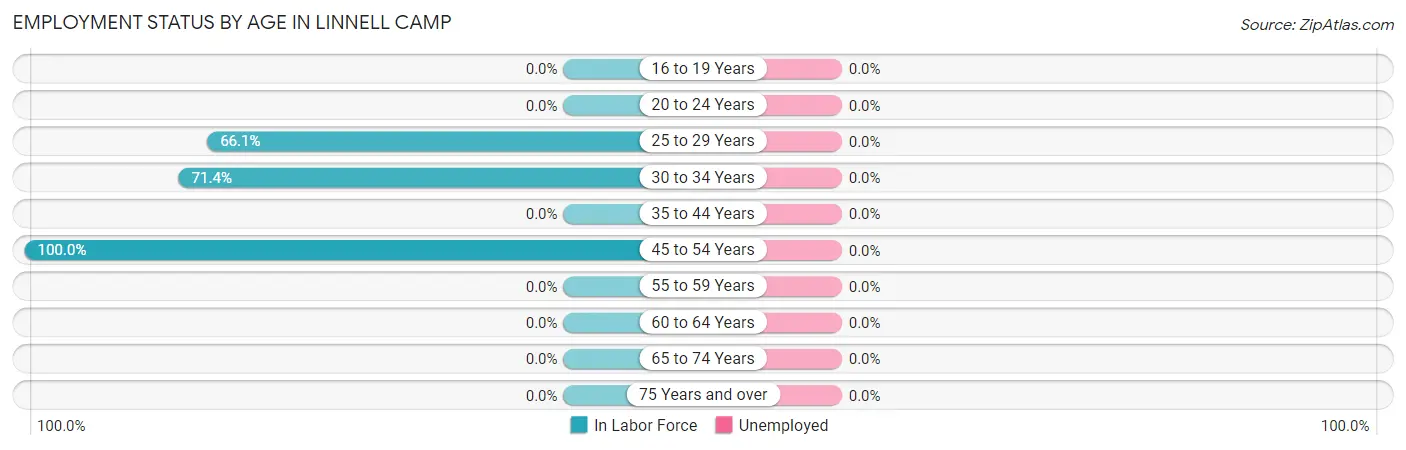
| Age Bracket | In Labor Force | Unemployed |
| 16 to 19 Years | 0 (0.0%) | 0 (0.0%) |
| 20 to 24 Years | 0 (0.0%) | 0 (0.0%) |
| 25 to 29 Years | 115 (66.1%) | 0 (0.0%) |
| 30 to 34 Years | 100 (71.4%) | 0 (0.0%) |
| 35 to 44 Years | 0 (0.0%) | 0 (0.0%) |
| 45 to 54 Years | 57 (100.0%) | 0 (0.0%) |
| 55 to 59 Years | 0 (0.0%) | 0 (0.0%) |
| 60 to 64 Years | 0 (0.0%) | 0 (0.0%) |
| 65 to 74 Years | 0 (0.0%) | 0 (0.0%) |
| 75 Years and over | 0 (0.0%) | 0 (0.0%) |
| Total | 272 (66.2%) | 0 (0.0%) |
Employment Status by Educational Attainment in Linnell Camp
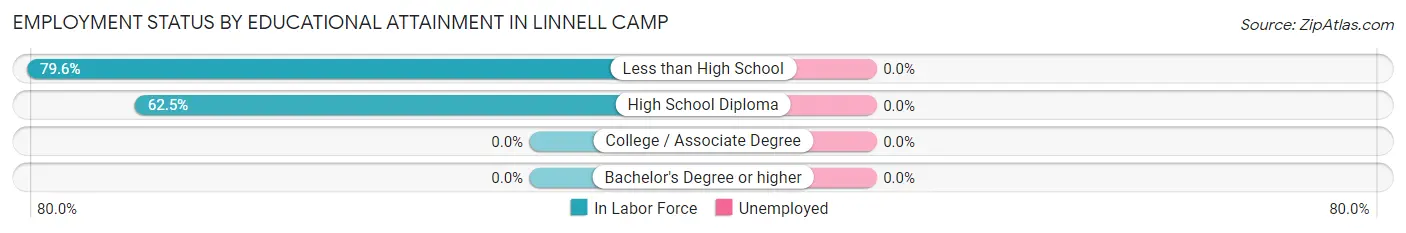
| Educational Attainment | In Labor Force | Unemployed |
| Less than High School | 187 (79.6%) | 0 (0.0%) |
| High School Diploma | 85 (62.5%) | 0 (0.0%) |
| College / Associate Degree | 0 (0.0%) | 0 (0.0%) |
| Bachelor's Degree or higher | 0 (0.0%) | 0 (0.0%) |
| Total | 272 (73.3%) | 0 (0.0%) |
Employment Occupations by Sex in Linnell Camp
Management, Business, Science and Arts Occupations
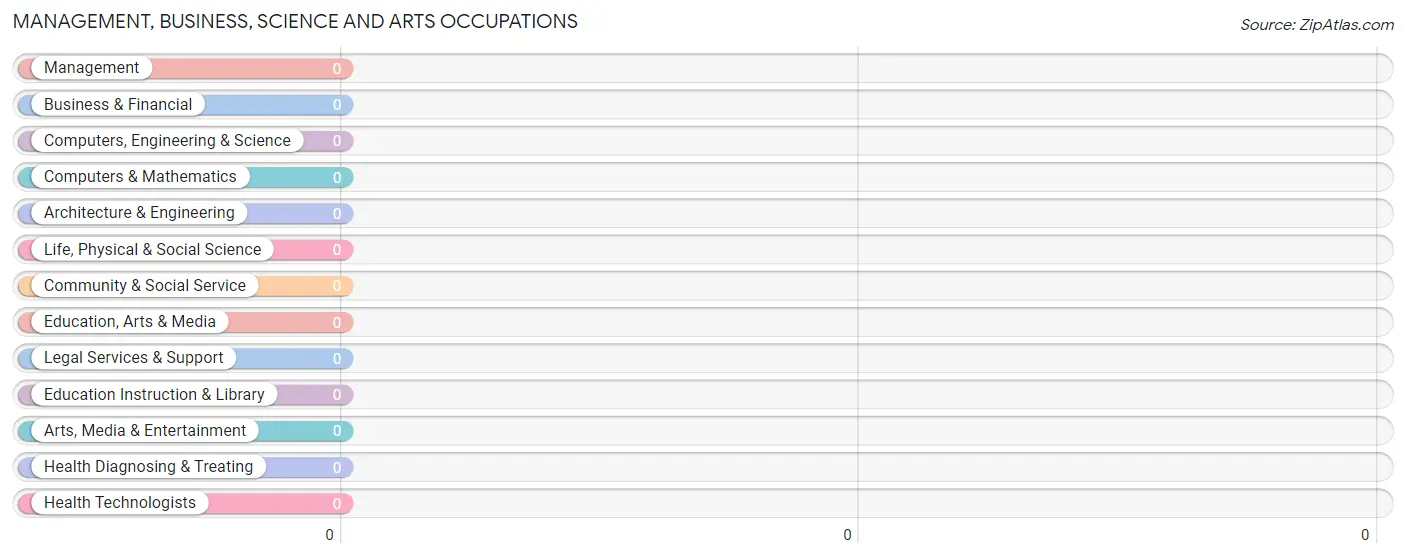
Management, Business, Science and Arts Occupations by Sex
| Occupation | Male | Female |
| Management | 0 (0.0%) | 0 (0.0%) |
| Business & Financial | 0 (0.0%) | 0 (0.0%) |
| Computers, Engineering & Science | 0 (0.0%) | 0 (0.0%) |
| Computers & Mathematics | 0 (0.0%) | 0 (0.0%) |
| Architecture & Engineering | 0 (0.0%) | 0 (0.0%) |
| Life, Physical & Social Science | 0 (0.0%) | 0 (0.0%) |
| Community & Social Service | 0 (0.0%) | 0 (0.0%) |
| Education, Arts & Media | 0 (0.0%) | 0 (0.0%) |
| Legal Services & Support | 0 (0.0%) | 0 (0.0%) |
| Education Instruction & Library | 0 (0.0%) | 0 (0.0%) |
| Arts, Media & Entertainment | 0 (0.0%) | 0 (0.0%) |
| Health Diagnosing & Treating | 0 (0.0%) | 0 (0.0%) |
| Health Technologists | 0 (0.0%) | 0 (0.0%) |
| Total (Category) | 0 (0.0%) | 0 (0.0%) |
| Total (Overall) | 190 (69.9%) | 82 (30.1%) |
Services Occupations
Services Occupations by Sex
| Occupation | Male | Female |
| Healthcare Support | 0 (0.0%) | 0 (0.0%) |
| Security & Protection | 0 (0.0%) | 0 (0.0%) |
| Firefighting & Prevention | 0 (0.0%) | 0 (0.0%) |
| Law Enforcement | 0 (0.0%) | 0 (0.0%) |
| Food Preparation & Serving | 0 (0.0%) | 0 (0.0%) |
| Cleaning & Maintenance | 0 (0.0%) | 0 (0.0%) |
| Personal Care & Service | 0 (0.0%) | 0 (0.0%) |
| Total (Category) | 0 (0.0%) | 0 (0.0%) |
| Total (Overall) | 190 (69.9%) | 82 (30.1%) |
Sales and Office Occupations
The most common Sales and Office occupations in Linnell Camp are , and Office & Administration (27 | 9.9%).
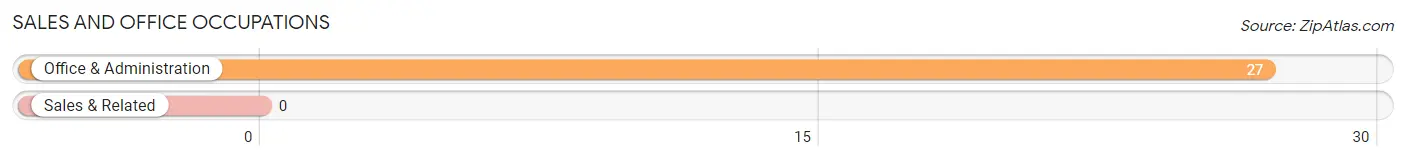
Sales and Office Occupations by Sex
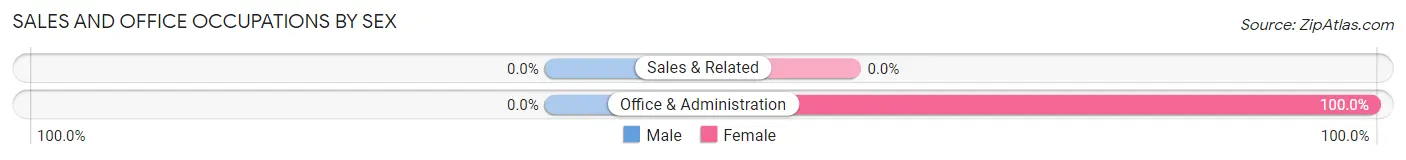
| Occupation | Male | Female |
| Sales & Related | 0 (0.0%) | 0 (0.0%) |
| Office & Administration | 0 (0.0%) | 27 (100.0%) |
| Total (Category) | 0 (0.0%) | 27 (100.0%) |
| Total (Overall) | 190 (69.9%) | 82 (30.1%) |
Natural Resources, Construction and Maintenance Occupations
The most common Natural Resources, Construction and Maintenance occupations in Linnell Camp are , and Farming, Fishing & Forestry (216 | 79.4%).
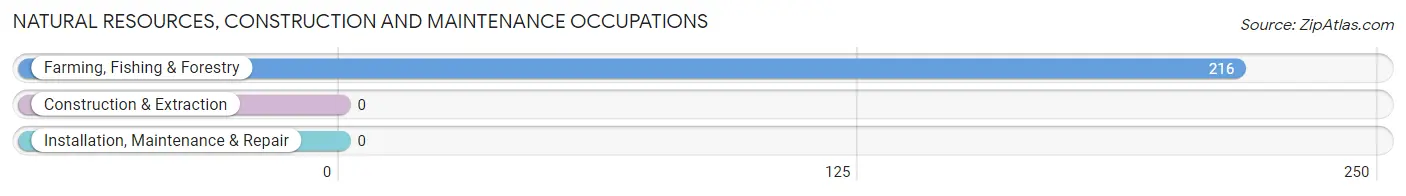
Natural Resources, Construction and Maintenance Occupations by Sex
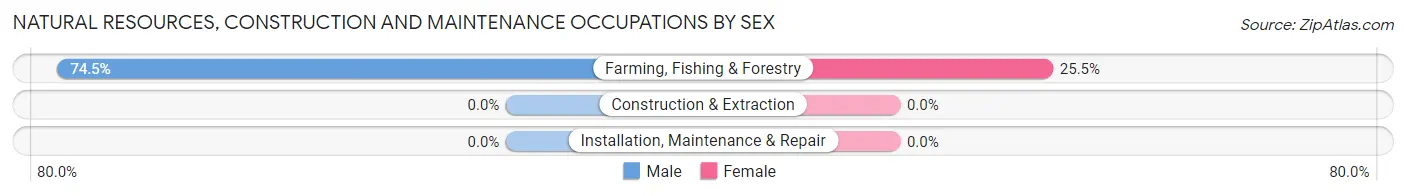
| Occupation | Male | Female |
| Farming, Fishing & Forestry | 161 (74.5%) | 55 (25.5%) |
| Construction & Extraction | 0 (0.0%) | 0 (0.0%) |
| Installation, Maintenance & Repair | 0 (0.0%) | 0 (0.0%) |
| Total (Category) | 161 (74.5%) | 55 (25.5%) |
| Total (Overall) | 190 (69.9%) | 82 (30.1%) |
Production, Transportation and Moving Occupations
The most common Production, Transportation and Moving occupations in Linnell Camp are , and Transportation (29 | 10.7%).
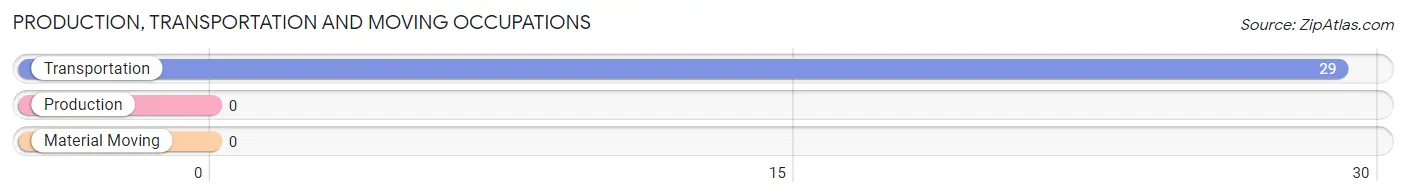
Production, Transportation and Moving Occupations by Sex
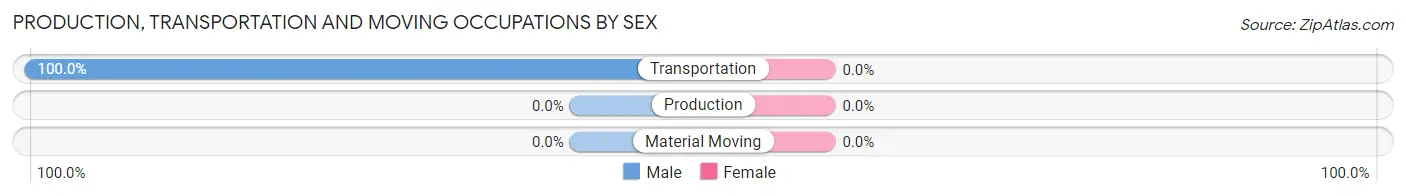
| Occupation | Male | Female |
| Production | 0 (0.0%) | 0 (0.0%) |
| Transportation | 29 (100.0%) | 0 (0.0%) |
| Material Moving | 0 (0.0%) | 0 (0.0%) |
| Total (Category) | 29 (100.0%) | 0 (0.0%) |
| Total (Overall) | 190 (69.9%) | 82 (30.1%) |
Employment Industries by Sex in Linnell Camp
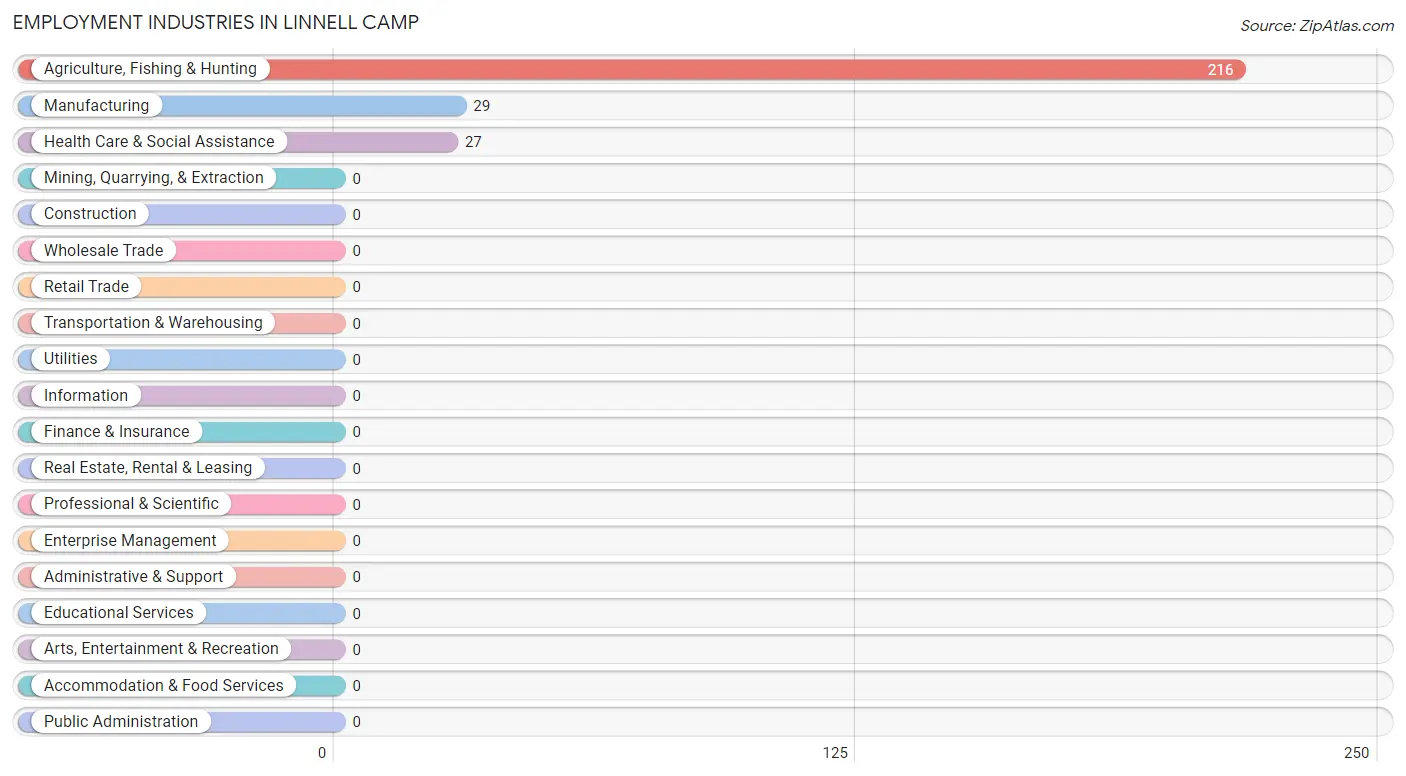
Employment Industries in Linnell Camp
The major employment industries in Linnell Camp include Agriculture, Fishing & Hunting (216 | 79.4%), Manufacturing (29 | 10.7%), and Health Care & Social Assistance (27 | 9.9%).
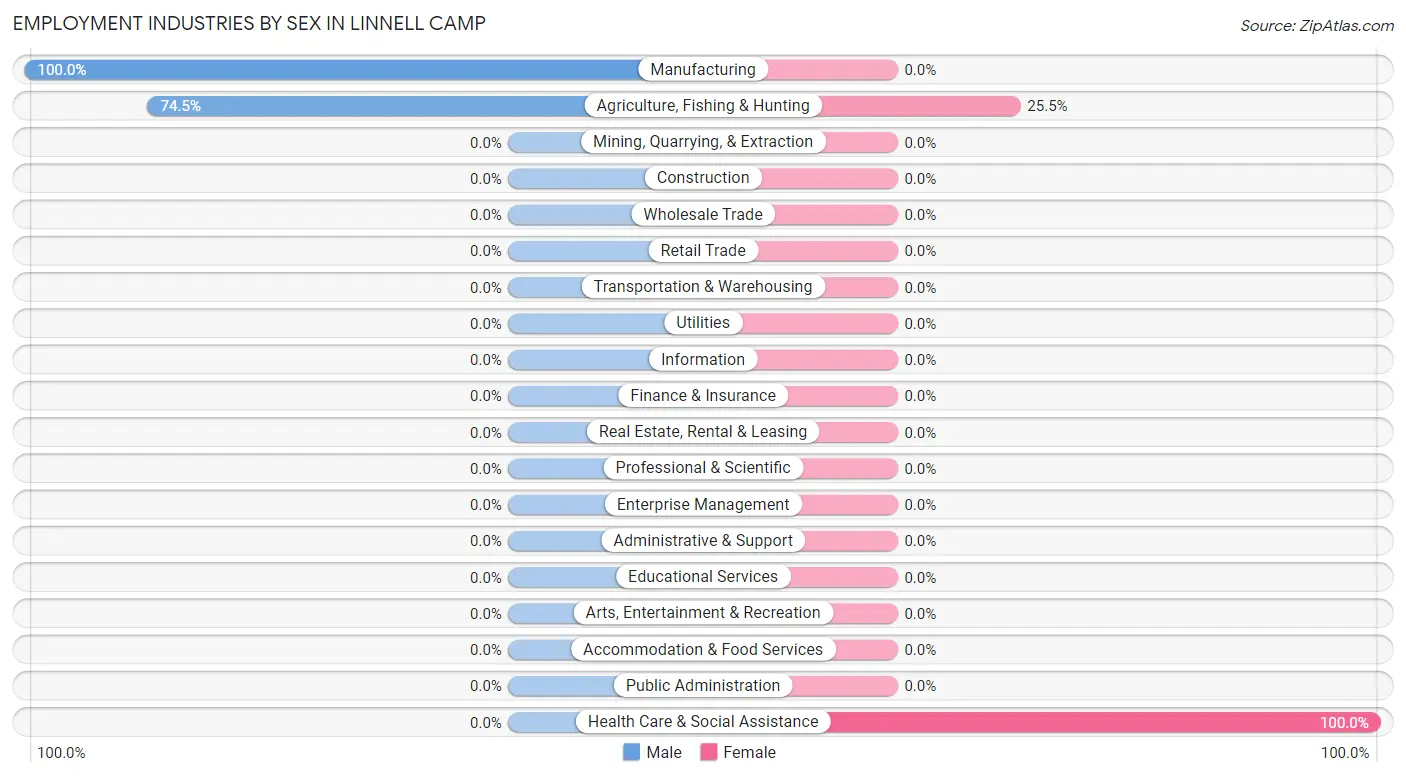
Employment Industries by Sex in Linnell Camp
The Linnell Camp industries that see more men than women are Manufacturing (100.0%), and Agriculture, Fishing & Hunting (74.5%), whereas the industries that tend to have a higher number of women are Health Care & Social Assistance (100.0%), and Agriculture, Fishing & Hunting (25.5%).
| Industry | Male | Female |
| Agriculture, Fishing & Hunting | 161 (74.5%) | 55 (25.5%) |
| Mining, Quarrying, & Extraction | 0 (0.0%) | 0 (0.0%) |
| Construction | 0 (0.0%) | 0 (0.0%) |
| Manufacturing | 29 (100.0%) | 0 (0.0%) |
| Wholesale Trade | 0 (0.0%) | 0 (0.0%) |
| Retail Trade | 0 (0.0%) | 0 (0.0%) |
| Transportation & Warehousing | 0 (0.0%) | 0 (0.0%) |
| Utilities | 0 (0.0%) | 0 (0.0%) |
| Information | 0 (0.0%) | 0 (0.0%) |
| Finance & Insurance | 0 (0.0%) | 0 (0.0%) |
| Real Estate, Rental & Leasing | 0 (0.0%) | 0 (0.0%) |
| Professional & Scientific | 0 (0.0%) | 0 (0.0%) |
| Enterprise Management | 0 (0.0%) | 0 (0.0%) |
| Administrative & Support | 0 (0.0%) | 0 (0.0%) |
| Educational Services | 0 (0.0%) | 0 (0.0%) |
| Health Care & Social Assistance | 0 (0.0%) | 27 (100.0%) |
| Arts, Entertainment & Recreation | 0 (0.0%) | 0 (0.0%) |
| Accommodation & Food Services | 0 (0.0%) | 0 (0.0%) |
| Public Administration | 0 (0.0%) | 0 (0.0%) |
| Total | 190 (69.9%) | 82 (30.1%) |
Education in Linnell Camp
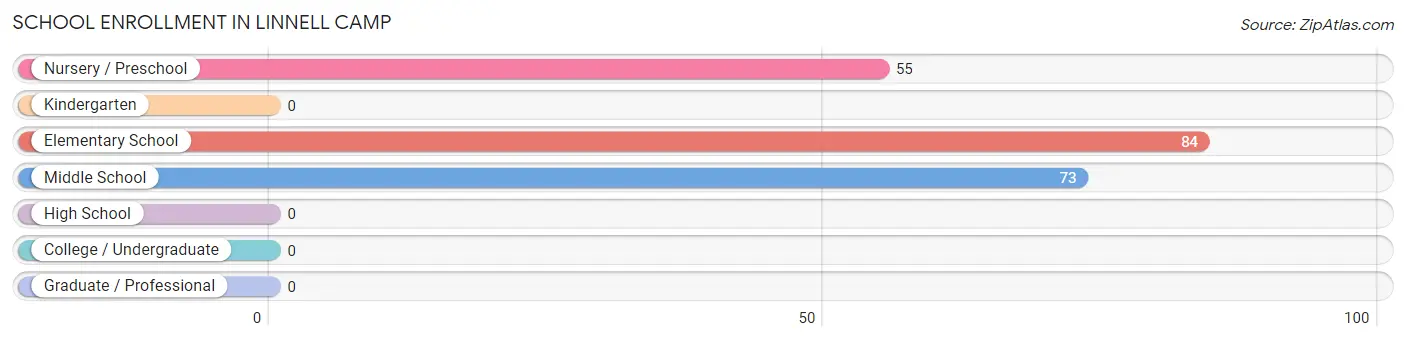
School Enrollment in Linnell Camp
The most common levels of schooling among the 212 students in Linnell Camp are elementary school (84 | 39.6%), middle school (73 | 34.4%), and nursery / preschool (55 | 25.9%).
| School Level | # Students | % Students |
| Nursery / Preschool | 55 | 25.9% |
| Kindergarten | 0 | 0.0% |
| Elementary School | 84 | 39.6% |
| Middle School | 73 | 34.4% |
| High School | 0 | 0.0% |
| College / Undergraduate | 0 | 0.0% |
| Graduate / Professional | 0 | 0.0% |
| Total | 212 | 100.0% |
School Enrollment by Age by Funding Source in Linnell Camp
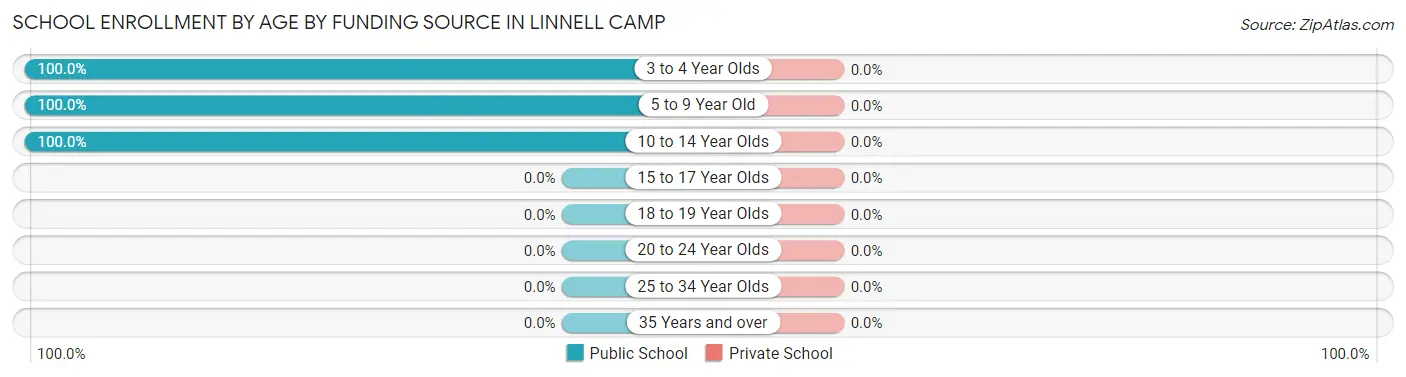
| Age Bracket | Public School | Private School |
| 3 to 4 Year Olds | 55 (100.0%) | 0 (0.0%) |
| 5 to 9 Year Old | 111 (100.0%) | 0 (0.0%) |
| 10 to 14 Year Olds | 46 (100.0%) | 0 (0.0%) |
| 15 to 17 Year Olds | 0 (0.0%) | 0 (0.0%) |
| 18 to 19 Year Olds | 0 (0.0%) | 0 (0.0%) |
| 20 to 24 Year Olds | 0 (0.0%) | 0 (0.0%) |
| 25 to 34 Year Olds | 0 (0.0%) | 0 (0.0%) |
| 35 Years and over | 0 (0.0%) | 0 (0.0%) |
| Total | 212 (100.0%) | 0 (0.0%) |
Educational Attainment by Field of Study in Linnell Camp
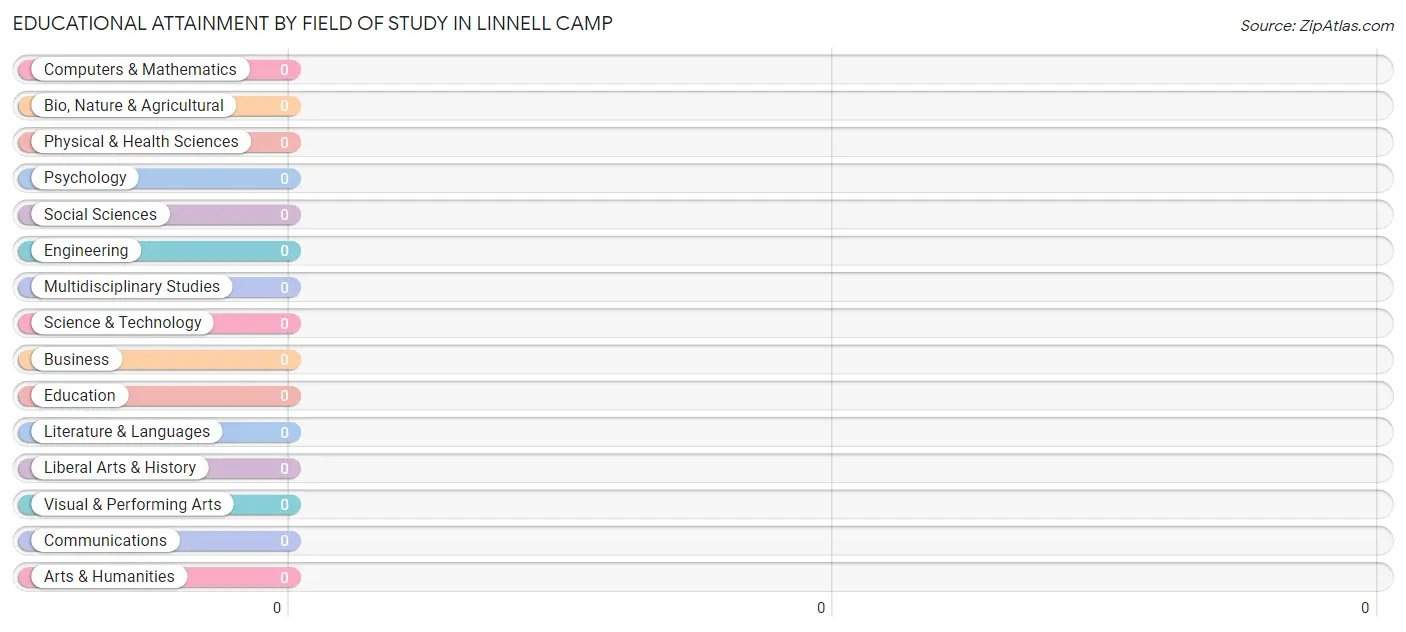
| Field of Study | # Graduates | % Graduates |
| Computers & Mathematics | 0 | 0.0% |
| Bio, Nature & Agricultural | 0 | 0.0% |
| Physical & Health Sciences | 0 | 0.0% |
| Psychology | 0 | 0.0% |
| Social Sciences | 0 | 0.0% |
| Engineering | 0 | 0.0% |
| Multidisciplinary Studies | 0 | 0.0% |
| Science & Technology | 0 | 0.0% |
| Business | 0 | 0.0% |
| Education | 0 | 0.0% |
| Literature & Languages | 0 | 0.0% |
| Liberal Arts & History | 0 | 0.0% |
| Visual & Performing Arts | 0 | 0.0% |
| Communications | 0 | 0.0% |
| Arts & Humanities | 0 | 0.0% |
| Total | 0 | 0.0% |
Transportation & Commute in Linnell Camp
Vehicle Availability by Sex in Linnell Camp
The most prevalent vehicle ownership categories in Linnell Camp are males with 2 vehicles (86, accounting for 48.3%) and females with 2 vehicles (54, making up 104.9%).
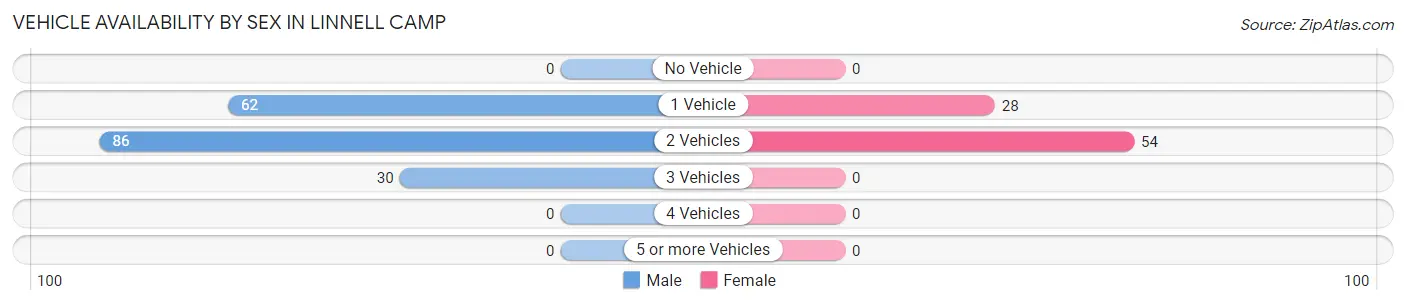
| Vehicles Available | Male | Female |
| No Vehicle | 0 (0.0%) | 0 (0.0%) |
| 1 Vehicle | 62 (34.8%) | 28 (34.2%) |
| 2 Vehicles | 86 (48.3%) | 54 (65.8%) |
| 3 Vehicles | 30 (16.9%) | 0 (0.0%) |
| 4 Vehicles | 0 (0.0%) | 0 (0.0%) |
| 5 or more Vehicles | 0 (0.0%) | 0 (0.0%) |
| Total | 178 (100.0%) | 82 (100.0%) |
Commute Time in Linnell Camp
The most frequently occuring commute durations in Linnell Camp are 20 to 24 minutes (62 commuters, 23.8%), 15 to 19 minutes (57 commuters, 21.9%), and 40 to 44 minutes (56 commuters, 21.5%).
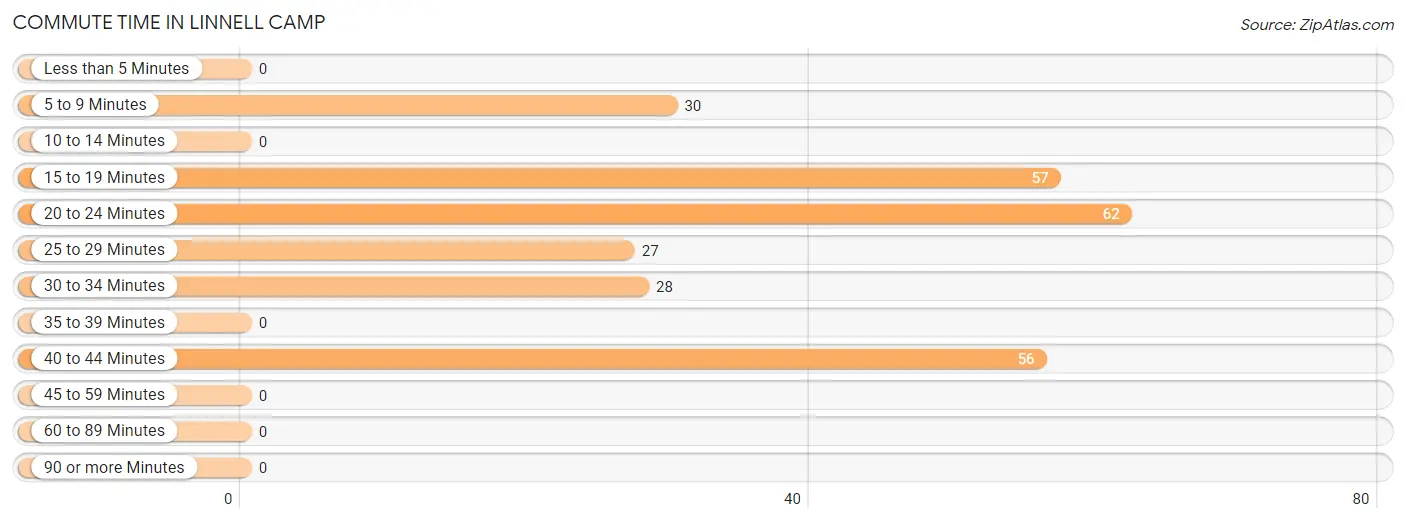
| Commute Time | # Commuters | % Commuters |
| Less than 5 Minutes | 0 | 0.0% |
| 5 to 9 Minutes | 30 | 11.5% |
| 10 to 14 Minutes | 0 | 0.0% |
| 15 to 19 Minutes | 57 | 21.9% |
| 20 to 24 Minutes | 62 | 23.8% |
| 25 to 29 Minutes | 27 | 10.4% |
| 30 to 34 Minutes | 28 | 10.8% |
| 35 to 39 Minutes | 0 | 0.0% |
| 40 to 44 Minutes | 56 | 21.5% |
| 45 to 59 Minutes | 0 | 0.0% |
| 60 to 89 Minutes | 0 | 0.0% |
| 90 or more Minutes | 0 | 0.0% |
Commute Time by Sex in Linnell Camp
The most common commute times in Linnell Camp are 20 to 24 minutes (62 commuters, 34.8%) for males and 15 to 19 minutes (28 commuters, 34.2%) for females.
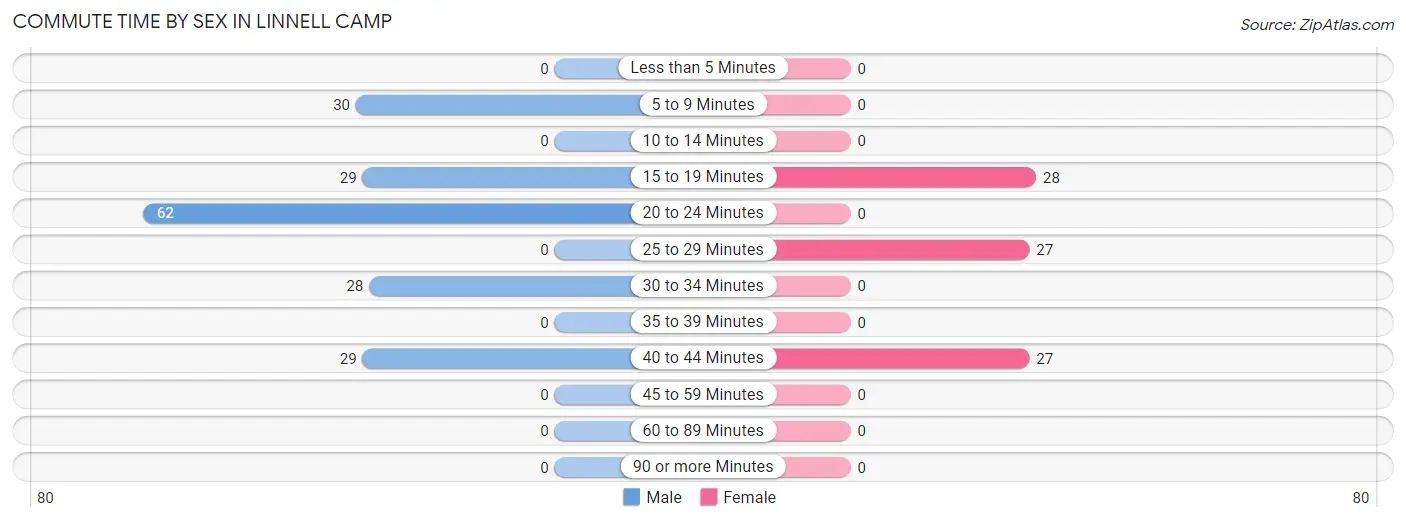
| Commute Time | Male | Female |
| Less than 5 Minutes | 0 (0.0%) | 0 (0.0%) |
| 5 to 9 Minutes | 30 (16.9%) | 0 (0.0%) |
| 10 to 14 Minutes | 0 (0.0%) | 0 (0.0%) |
| 15 to 19 Minutes | 29 (16.3%) | 28 (34.2%) |
| 20 to 24 Minutes | 62 (34.8%) | 0 (0.0%) |
| 25 to 29 Minutes | 0 (0.0%) | 27 (32.9%) |
| 30 to 34 Minutes | 28 (15.7%) | 0 (0.0%) |
| 35 to 39 Minutes | 0 (0.0%) | 0 (0.0%) |
| 40 to 44 Minutes | 29 (16.3%) | 27 (32.9%) |
| 45 to 59 Minutes | 0 (0.0%) | 0 (0.0%) |
| 60 to 89 Minutes | 0 (0.0%) | 0 (0.0%) |
| 90 or more Minutes | 0 (0.0%) | 0 (0.0%) |
Time of Departure to Work by Sex in Linnell Camp
The most frequent times of departure to work in Linnell Camp are 6:00 AM to 6:29 AM (86, 48.3%) for males and 6:00 AM to 6:29 AM (28, 34.2%) for females.
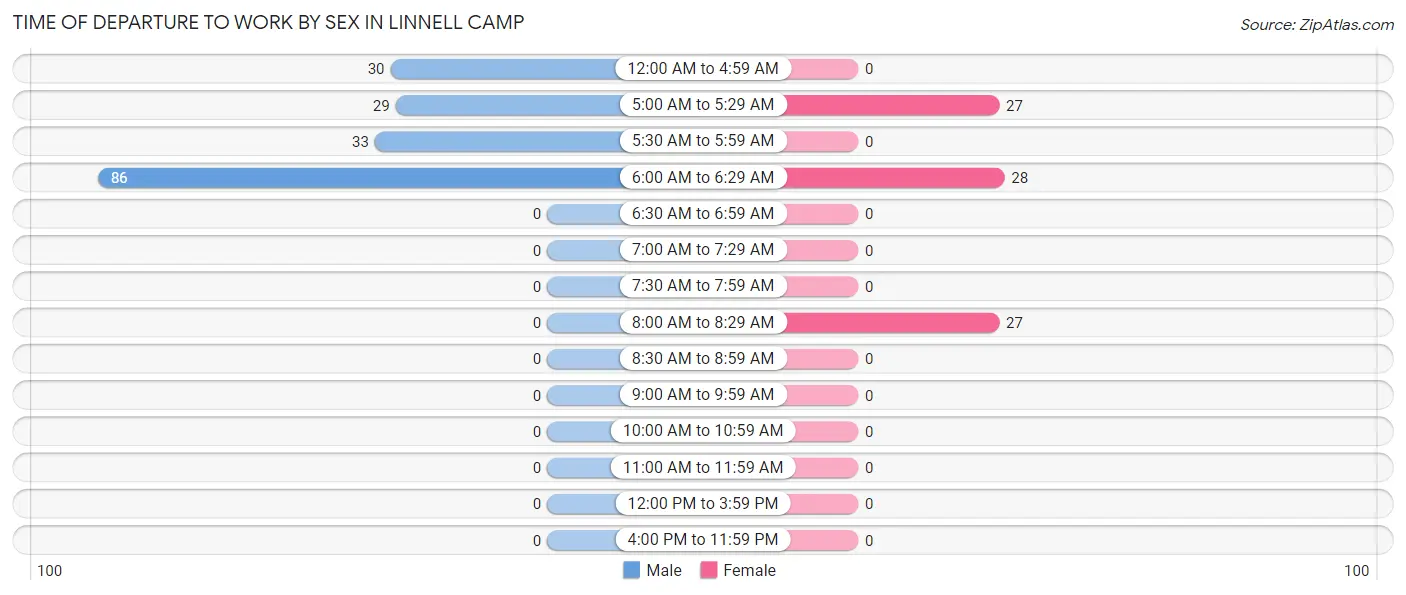
| Time of Departure | Male | Female |
| 12:00 AM to 4:59 AM | 30 (16.9%) | 0 (0.0%) |
| 5:00 AM to 5:29 AM | 29 (16.3%) | 27 (32.9%) |
| 5:30 AM to 5:59 AM | 33 (18.5%) | 0 (0.0%) |
| 6:00 AM to 6:29 AM | 86 (48.3%) | 28 (34.2%) |
| 6:30 AM to 6:59 AM | 0 (0.0%) | 0 (0.0%) |
| 7:00 AM to 7:29 AM | 0 (0.0%) | 0 (0.0%) |
| 7:30 AM to 7:59 AM | 0 (0.0%) | 0 (0.0%) |
| 8:00 AM to 8:29 AM | 0 (0.0%) | 27 (32.9%) |
| 8:30 AM to 8:59 AM | 0 (0.0%) | 0 (0.0%) |
| 9:00 AM to 9:59 AM | 0 (0.0%) | 0 (0.0%) |
| 10:00 AM to 10:59 AM | 0 (0.0%) | 0 (0.0%) |
| 11:00 AM to 11:59 AM | 0 (0.0%) | 0 (0.0%) |
| 12:00 PM to 3:59 PM | 0 (0.0%) | 0 (0.0%) |
| 4:00 PM to 11:59 PM | 0 (0.0%) | 0 (0.0%) |
| Total | 178 (100.0%) | 82 (100.0%) |
Housing Occupancy in Linnell Camp
Occupancy by Ownership in Linnell Camp
Of the total 157 dwellings in Linnell Camp, owner-occupied units account for 0 (0.0%), while renter-occupied units make up 157 (100.0%).
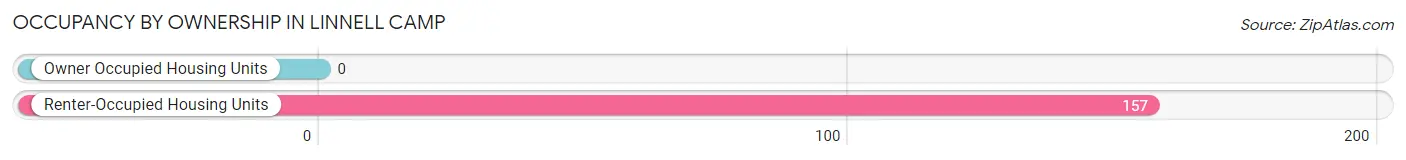
| Occupancy | # Housing Units | % Housing Units |
| Owner Occupied Housing Units | 0 | 0.0% |
| Renter-Occupied Housing Units | 157 | 100.0% |
| Total Occupied Housing Units | 157 | 100.0% |
Occupancy by Household Size in Linnell Camp
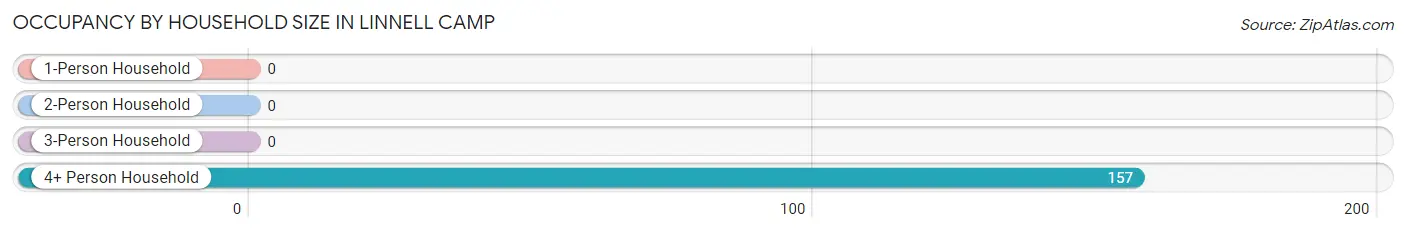
| Household Size | # Housing Units | % Housing Units |
| 1-Person Household | 0 | 0.0% |
| 2-Person Household | 0 | 0.0% |
| 3-Person Household | 0 | 0.0% |
| 4+ Person Household | 157 | 100.0% |
| Total Housing Units | 157 | 100.0% |
Occupancy by Ownership by Household Size in Linnell Camp
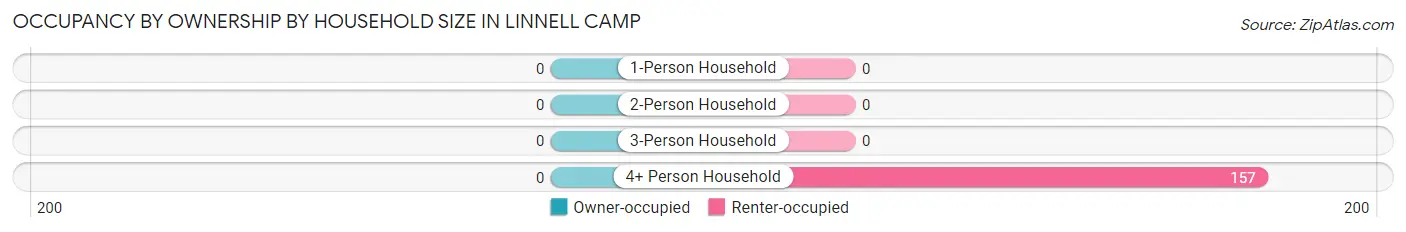
| Household Size | Owner-occupied | Renter-occupied |
| 1-Person Household | 0 (0.0%) | 0 (0.0%) |
| 2-Person Household | 0 (0.0%) | 0 (0.0%) |
| 3-Person Household | 0 (0.0%) | 0 (0.0%) |
| 4+ Person Household | 0 (0.0%) | 157 (100.0%) |
| Total Housing Units | 0 (0.0%) | 157 (100.0%) |
Occupancy by Educational Attainment in Linnell Camp
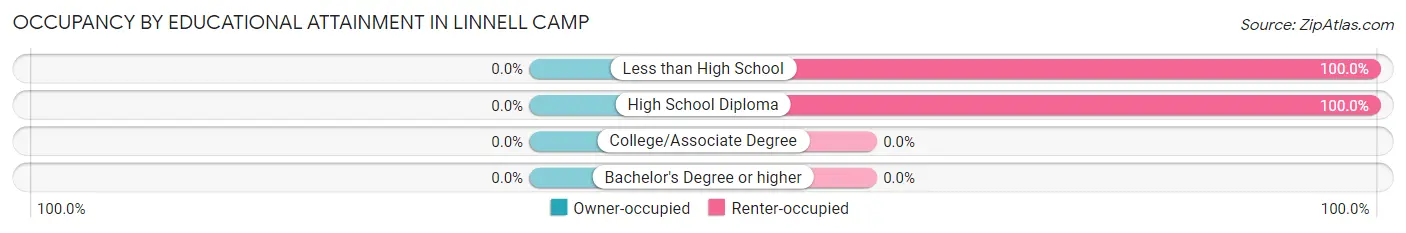
| Household Size | Owner-occupied | Renter-occupied |
| Less than High School | 0 (0.0%) | 99 (100.0%) |
| High School Diploma | 0 (0.0%) | 58 (100.0%) |
| College/Associate Degree | 0 (0.0%) | 0 (0.0%) |
| Bachelor's Degree or higher | 0 (0.0%) | 0 (0.0%) |
Occupancy by Age of Householder in Linnell Camp
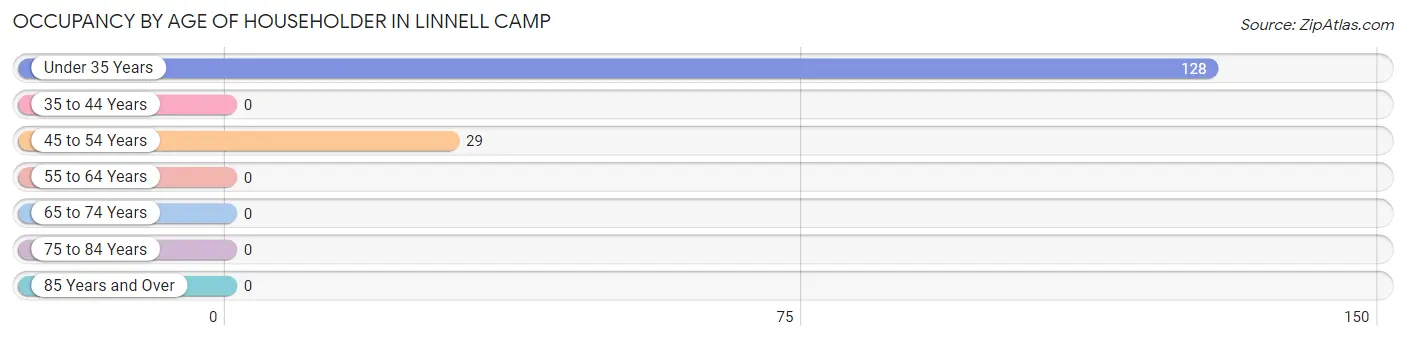
| Age Bracket | # Households | % Households |
| Under 35 Years | 128 | 81.5% |
| 35 to 44 Years | 0 | 0.0% |
| 45 to 54 Years | 29 | 18.5% |
| 55 to 64 Years | 0 | 0.0% |
| 65 to 74 Years | 0 | 0.0% |
| 75 to 84 Years | 0 | 0.0% |
| 85 Years and Over | 0 | 0.0% |
| Total | 157 | 100.0% |
Housing Finances in Linnell Camp
Median Income by Occupancy in Linnell Camp
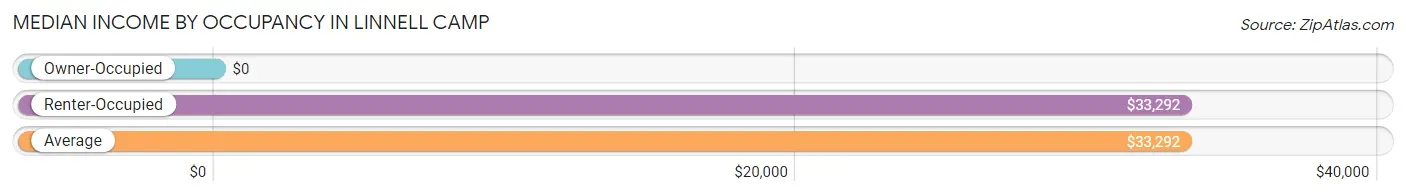
| Occupancy Type | # Households | Median Income |
| Owner-Occupied | 0 (0.0%) | $0 |
| Renter-Occupied | 157 (100.0%) | $33,292 |
| Average | 157 (100.0%) | $33,292 |
Occupancy by Householder Income Bracket in Linnell Camp
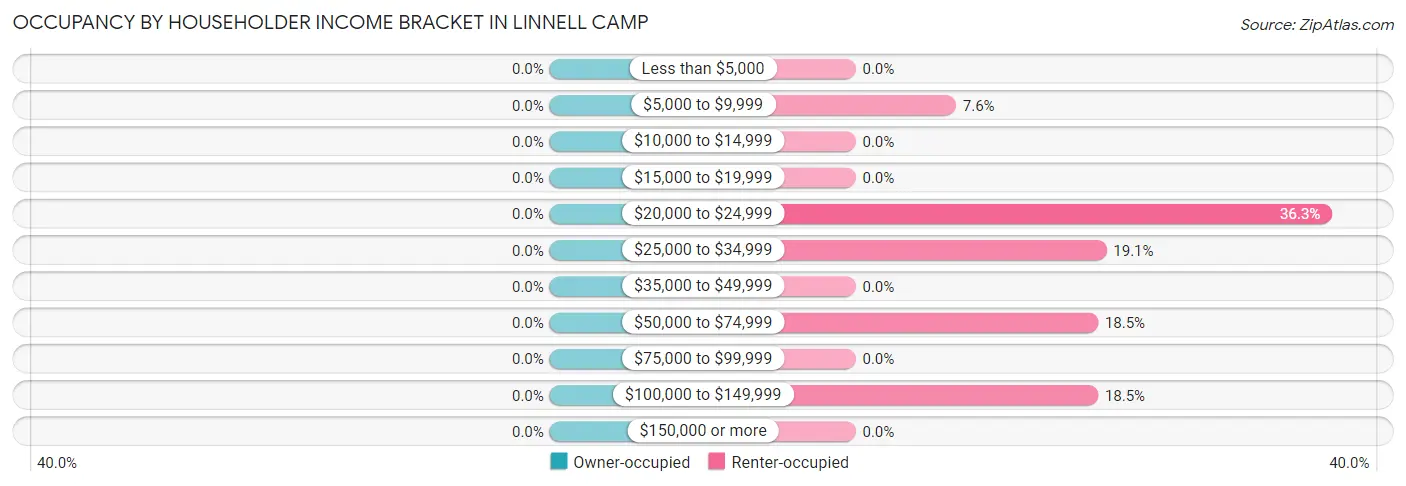
| Income Bracket | Owner-occupied | Renter-occupied |
| Less than $5,000 | 0 (0.0%) | 0 (0.0%) |
| $5,000 to $9,999 | 0 (0.0%) | 12 (7.6%) |
| $10,000 to $14,999 | 0 (0.0%) | 0 (0.0%) |
| $15,000 to $19,999 | 0 (0.0%) | 0 (0.0%) |
| $20,000 to $24,999 | 0 (0.0%) | 57 (36.3%) |
| $25,000 to $34,999 | 0 (0.0%) | 30 (19.1%) |
| $35,000 to $49,999 | 0 (0.0%) | 0 (0.0%) |
| $50,000 to $74,999 | 0 (0.0%) | 29 (18.5%) |
| $75,000 to $99,999 | 0 (0.0%) | 0 (0.0%) |
| $100,000 to $149,999 | 0 (0.0%) | 29 (18.5%) |
| $150,000 or more | 0 (0.0%) | 0 (0.0%) |
| Total | 0 (0.0%) | 157 (100.0%) |
Monthly Housing Cost Tiers in Linnell Camp
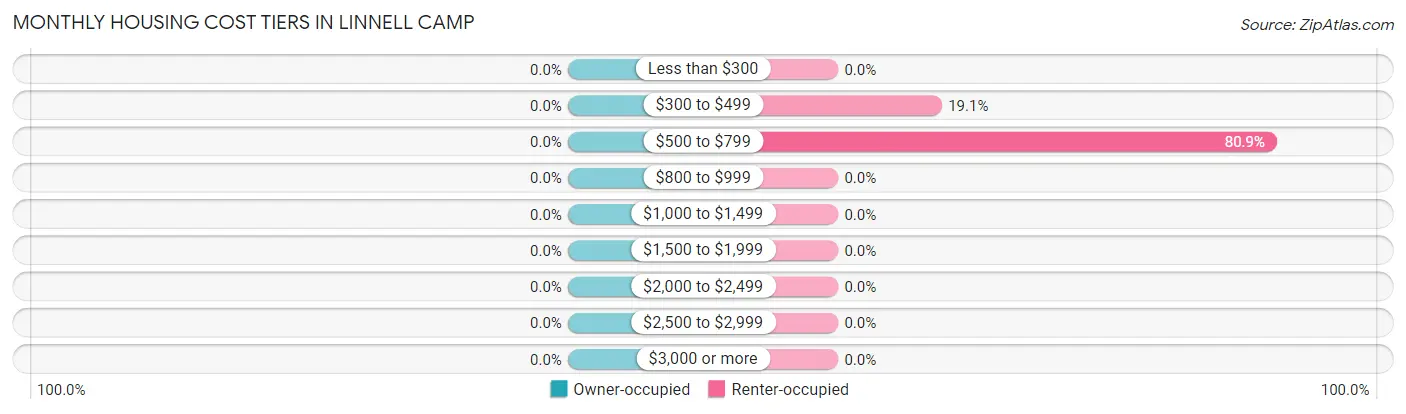
| Monthly Cost | Owner-occupied | Renter-occupied |
| Less than $300 | 0 (0.0%) | 0 (0.0%) |
| $300 to $499 | 0 (0.0%) | 30 (19.1%) |
| $500 to $799 | 0 (0.0%) | 127 (80.9%) |
| $800 to $999 | 0 (0.0%) | 0 (0.0%) |
| $1,000 to $1,499 | 0 (0.0%) | 0 (0.0%) |
| $1,500 to $1,999 | 0 (0.0%) | 0 (0.0%) |
| $2,000 to $2,499 | 0 (0.0%) | 0 (0.0%) |
| $2,500 to $2,999 | 0 (0.0%) | 0 (0.0%) |
| $3,000 or more | 0 (0.0%) | 0 (0.0%) |
| Total | 0 (0.0%) | 157 (100.0%) |
Physical Housing Characteristics in Linnell Camp
Housing Structures in Linnell Camp
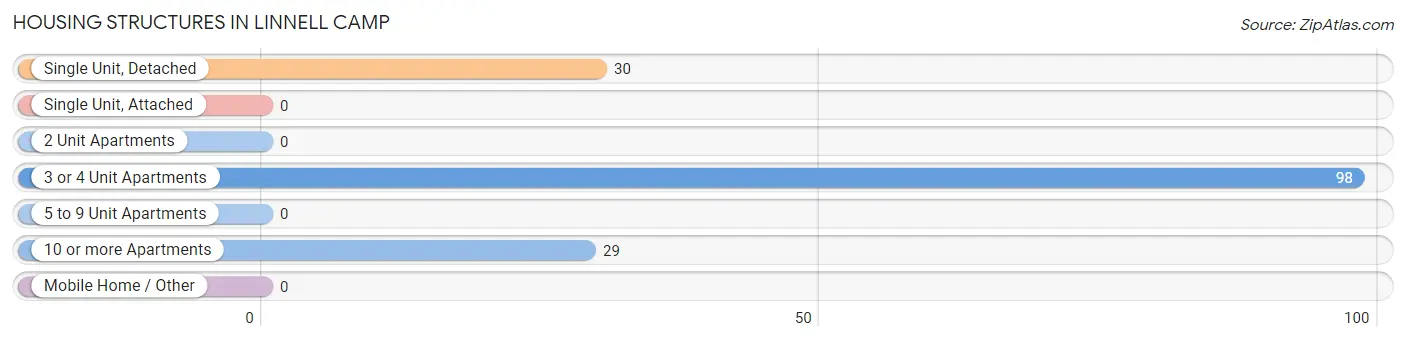
| Structure Type | # Housing Units | % Housing Units |
| Single Unit, Detached | 30 | 19.1% |
| Single Unit, Attached | 0 | 0.0% |
| 2 Unit Apartments | 0 | 0.0% |
| 3 or 4 Unit Apartments | 98 | 62.4% |
| 5 to 9 Unit Apartments | 0 | 0.0% |
| 10 or more Apartments | 29 | 18.5% |
| Mobile Home / Other | 0 | 0.0% |
| Total | 157 | 100.0% |
Housing Structures by Occupancy in Linnell Camp
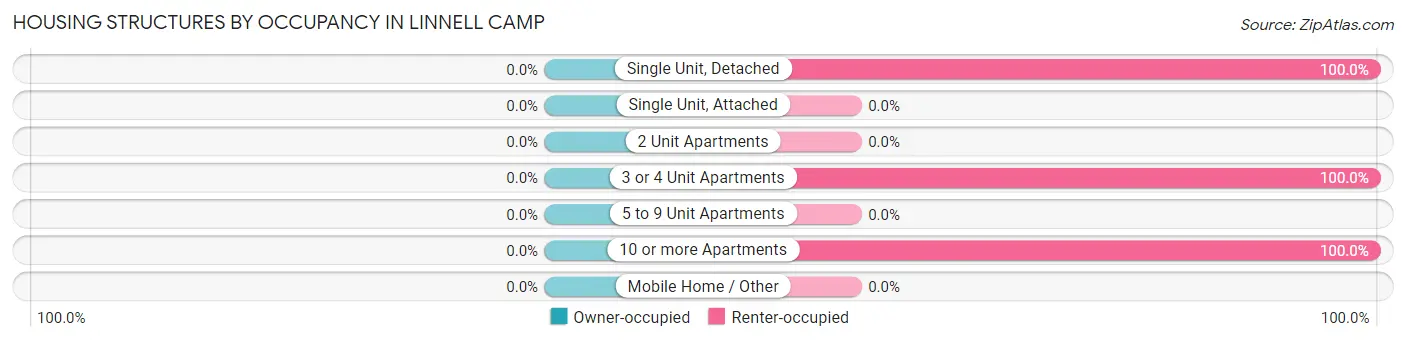
| Structure Type | Owner-occupied | Renter-occupied |
| Single Unit, Detached | 0 (0.0%) | 30 (100.0%) |
| Single Unit, Attached | 0 (0.0%) | 0 (0.0%) |
| 2 Unit Apartments | 0 (0.0%) | 0 (0.0%) |
| 3 or 4 Unit Apartments | 0 (0.0%) | 98 (100.0%) |
| 5 to 9 Unit Apartments | 0 (0.0%) | 0 (0.0%) |
| 10 or more Apartments | 0 (0.0%) | 29 (100.0%) |
| Mobile Home / Other | 0 (0.0%) | 0 (0.0%) |
| Total | 0 (0.0%) | 157 (100.0%) |
Housing Structures by Number of Rooms in Linnell Camp
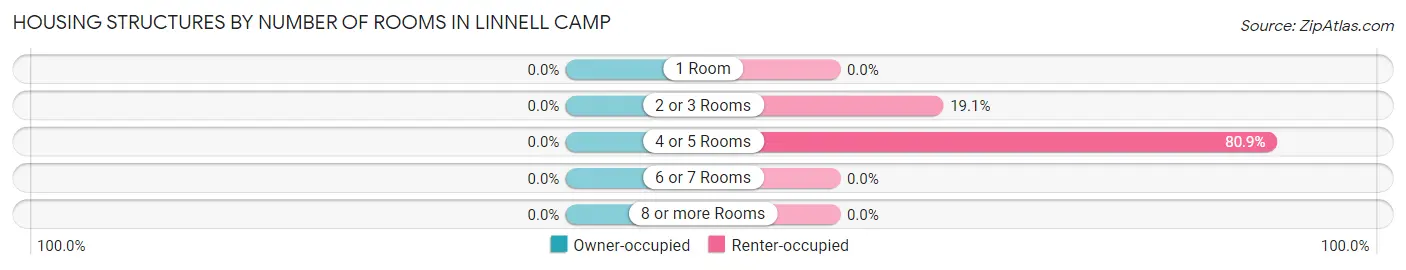
| Number of Rooms | Owner-occupied | Renter-occupied |
| 1 Room | 0 (0.0%) | 0 (0.0%) |
| 2 or 3 Rooms | 0 (0.0%) | 30 (19.1%) |
| 4 or 5 Rooms | 0 (0.0%) | 127 (80.9%) |
| 6 or 7 Rooms | 0 (0.0%) | 0 (0.0%) |
| 8 or more Rooms | 0 (0.0%) | 0 (0.0%) |
| Total | 0 (0.0%) | 157 (100.0%) |
Housing Structure by Heating Type in Linnell Camp
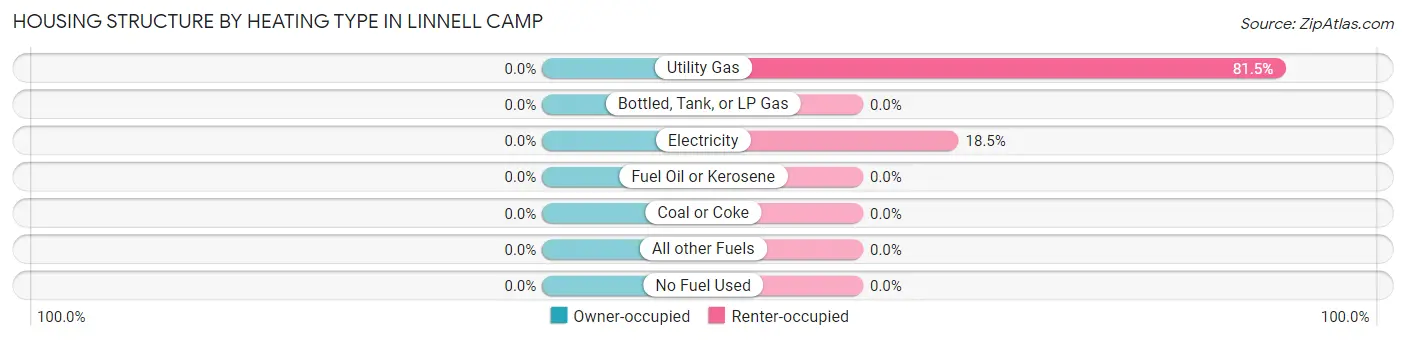
| Heating Type | Owner-occupied | Renter-occupied |
| Utility Gas | 0 (0.0%) | 128 (81.5%) |
| Bottled, Tank, or LP Gas | 0 (0.0%) | 0 (0.0%) |
| Electricity | 0 (0.0%) | 29 (18.5%) |
| Fuel Oil or Kerosene | 0 (0.0%) | 0 (0.0%) |
| Coal or Coke | 0 (0.0%) | 0 (0.0%) |
| All other Fuels | 0 (0.0%) | 0 (0.0%) |
| No Fuel Used | 0 (0.0%) | 0 (0.0%) |
| Total | 0 (0.0%) | 157 (100.0%) |
Household Vehicle Usage in Linnell Camp
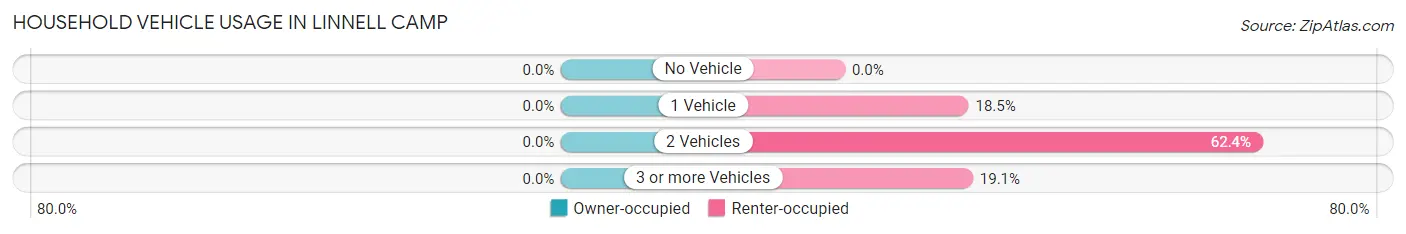
| Vehicles per Household | Owner-occupied | Renter-occupied |
| No Vehicle | 0 (0.0%) | 0 (0.0%) |
| 1 Vehicle | 0 (0.0%) | 29 (18.5%) |
| 2 Vehicles | 0 (0.0%) | 98 (62.4%) |
| 3 or more Vehicles | 0 (0.0%) | 30 (19.1%) |
| Total | 0 (0.0%) | 157 (100.0%) |
Real Estate & Mortgages in Linnell Camp
Real Estate and Mortgage Overview in Linnell Camp
| Characteristic | Without Mortgage | With Mortgage |
| Housing Units | 0 | 0 |
| Median Property Value | - | - |
| Median Household Income | - | - |
| Monthly Housing Costs | - | - |
| Real Estate Taxes | - | - |
Property Value by Mortgage Status in Linnell Camp
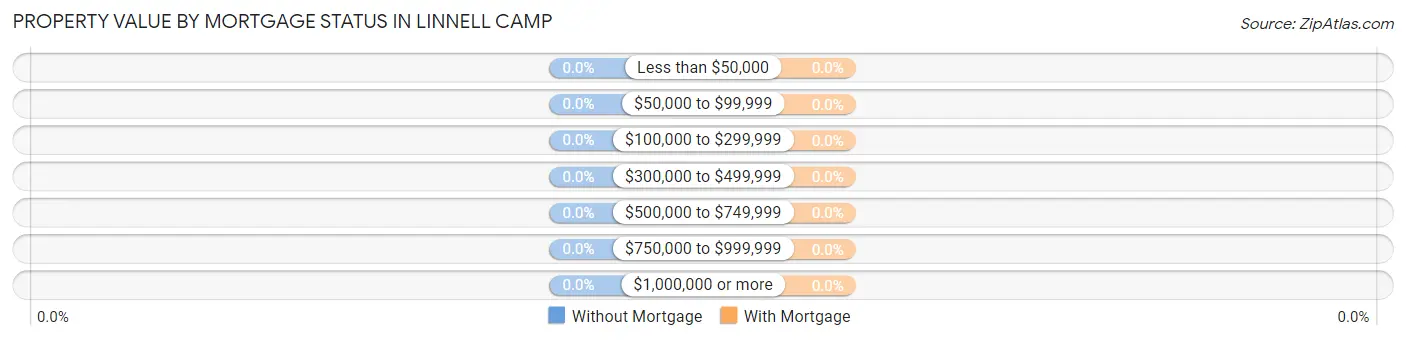
| Property Value | Without Mortgage | With Mortgage |
| Less than $50,000 | 0 (0.0%) | 0 (0.0%) |
| $50,000 to $99,999 | 0 (0.0%) | 0 (0.0%) |
| $100,000 to $299,999 | 0 (0.0%) | 0 (0.0%) |
| $300,000 to $499,999 | 0 (0.0%) | 0 (0.0%) |
| $500,000 to $749,999 | 0 (0.0%) | 0 (0.0%) |
| $750,000 to $999,999 | 0 (0.0%) | 0 (0.0%) |
| $1,000,000 or more | 0 (0.0%) | 0 (0.0%) |
| Total | 0 (0.0%) | 0 (0.0%) |
Household Income by Mortgage Status in Linnell Camp
| Household Income | Without Mortgage | With Mortgage |
| Less than $10,000 | 0 (0.0%) | 0 (0.0%) |
| $10,000 to $24,999 | 0 (0.0%) | 0 (0.0%) |
| $25,000 to $34,999 | 0 (0.0%) | 0 (0.0%) |
| $35,000 to $49,999 | 0 (0.0%) | 0 (0.0%) |
| $50,000 to $74,999 | 0 (0.0%) | 0 (0.0%) |
| $75,000 to $99,999 | 0 (0.0%) | 0 (0.0%) |
| $100,000 to $149,999 | 0 (0.0%) | 0 (0.0%) |
| $150,000 or more | 0 (0.0%) | 0 (0.0%) |
| Total | 0 (0.0%) | 0 (0.0%) |
Property Value to Household Income Ratio in Linnell Camp
| Value-to-Income Ratio | Without Mortgage | With Mortgage |
| Less than 2.0x | 0 (0.0%) | 0 (0.0%) |
| 2.0x to 2.9x | 0 (0.0%) | 0 (0.0%) |
| 3.0x to 3.9x | 0 (0.0%) | 0 (0.0%) |
| 4.0x or more | 0 (0.0%) | 0 (0.0%) |
| Total | 0 (0.0%) | 0 (0.0%) |
Real Estate Taxes by Mortgage Status in Linnell Camp
| Property Taxes | Without Mortgage | With Mortgage |
| Less than $800 | 0 (0.0%) | 0 (0.0%) |
| $800 to $1,499 | 0 (0.0%) | 0 (0.0%) |
| $800 to $1,499 | 0 (0.0%) | 0 (0.0%) |
| Total | 0 (0.0%) | 0 (0.0%) |
Health & Disability in Linnell Camp
Health Insurance Coverage by Age in Linnell Camp
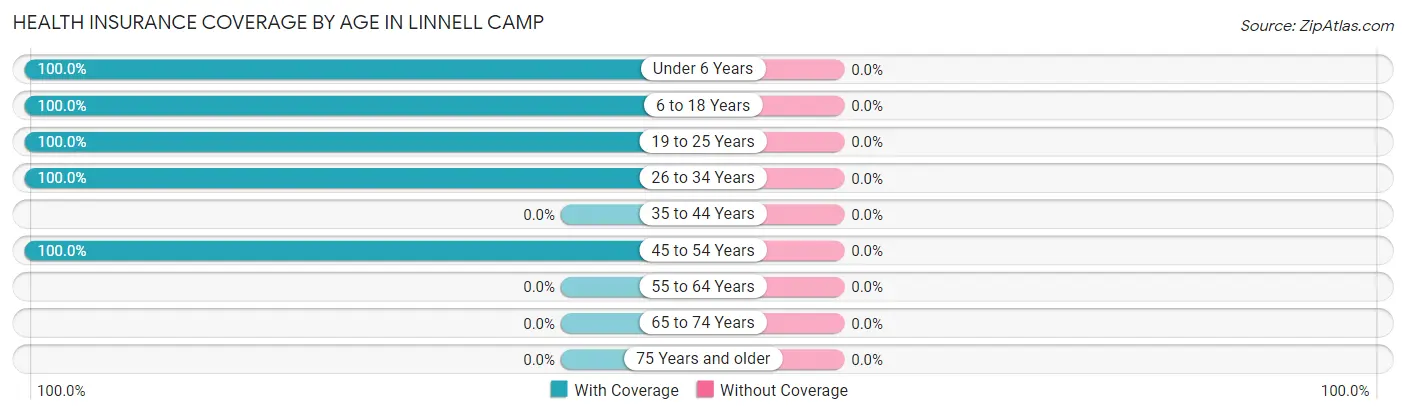
| Age Bracket | With Coverage | Without Coverage |
| Under 6 Years | 169 (100.0%) | 0 (0.0%) |
| 6 to 18 Years | 157 (100.0%) | 0 (0.0%) |
| 19 to 25 Years | 40 (100.0%) | 0 (0.0%) |
| 26 to 34 Years | 314 (100.0%) | 0 (0.0%) |
| 35 to 44 Years | 0 (0.0%) | 0 (0.0%) |
| 45 to 54 Years | 57 (100.0%) | 0 (0.0%) |
| 55 to 64 Years | 0 (0.0%) | 0 (0.0%) |
| 65 to 74 Years | 0 (0.0%) | 0 (0.0%) |
| 75 Years and older | 0 (0.0%) | 0 (0.0%) |
| Total | 737 (100.0%) | 0 (0.0%) |
Health Insurance Coverage by Citizenship Status in Linnell Camp
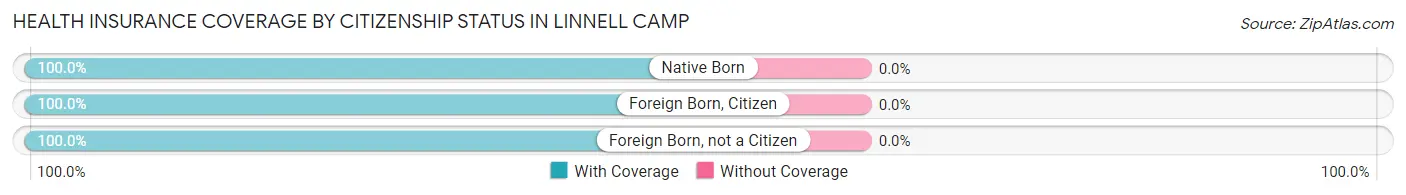
| Citizenship Status | With Coverage | Without Coverage |
| Native Born | 169 (100.0%) | 0 (0.0%) |
| Foreign Born, Citizen | 157 (100.0%) | 0 (0.0%) |
| Foreign Born, not a Citizen | 40 (100.0%) | 0 (0.0%) |
Health Insurance Coverage by Household Income in Linnell Camp
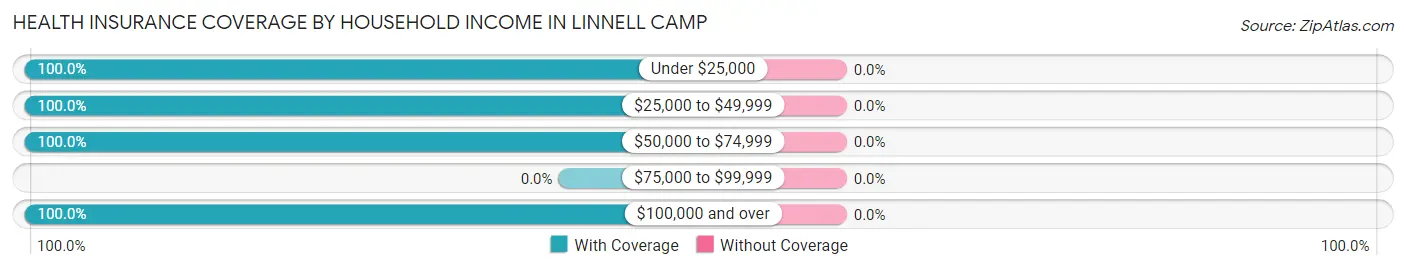
| Household Income | With Coverage | Without Coverage |
| Under $25,000 | 378 (100.0%) | 0 (0.0%) |
| $25,000 to $49,999 | 109 (100.0%) | 0 (0.0%) |
| $50,000 to $74,999 | 111 (100.0%) | 0 (0.0%) |
| $75,000 to $99,999 | 0 (0.0%) | 0 (0.0%) |
| $100,000 and over | 139 (100.0%) | 0 (0.0%) |
Public vs Private Health Insurance Coverage by Age in Linnell Camp
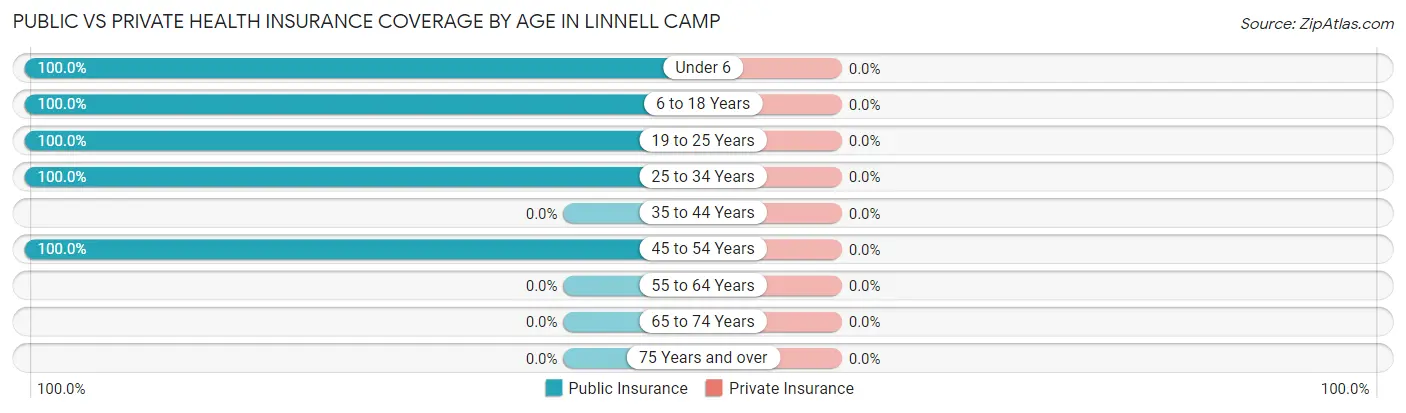
| Age Bracket | Public Insurance | Private Insurance |
| Under 6 | 169 (100.0%) | 0 (0.0%) |
| 6 to 18 Years | 157 (100.0%) | 0 (0.0%) |
| 19 to 25 Years | 40 (100.0%) | 0 (0.0%) |
| 25 to 34 Years | 314 (100.0%) | 0 (0.0%) |
| 35 to 44 Years | 0 (0.0%) | 0 (0.0%) |
| 45 to 54 Years | 57 (100.0%) | 0 (0.0%) |
| 55 to 64 Years | 0 (0.0%) | 0 (0.0%) |
| 65 to 74 Years | 0 (0.0%) | 0 (0.0%) |
| 75 Years and over | 0 (0.0%) | 0 (0.0%) |
| Total | 737 (100.0%) | 0 (0.0%) |
Disability Status by Sex by Age in Linnell Camp
| Age Bracket | Male | Female |
| Under 5 Years | 0 (0.0%) | 0 (0.0%) |
| 5 to 17 Years | 0 (0.0%) | 0 (0.0%) |
| 18 to 34 Years | 0 (0.0%) | 0 (0.0%) |
| 35 to 64 Years | 0 (0.0%) | 0 (0.0%) |
| 65 to 74 Years | 0 (0.0%) | 0 (0.0%) |
| 75 Years and over | 0 (0.0%) | 0 (0.0%) |
Disability Class by Sex by Age in Linnell Camp
Disability Class: Hearing Difficulty
| Age Bracket | Male | Female |
| Under 5 Years | 0 (0.0%) | 0 (0.0%) |
| 5 to 17 Years | 0 (0.0%) | 0 (0.0%) |
| 18 to 34 Years | 0 (0.0%) | 0 (0.0%) |
| 35 to 64 Years | 0 (0.0%) | 0 (0.0%) |
| 65 to 74 Years | 0 (0.0%) | 0 (0.0%) |
| 75 Years and over | 0 (0.0%) | 0 (0.0%) |
Disability Class: Vision Difficulty
| Age Bracket | Male | Female |
| Under 5 Years | 0 (0.0%) | 0 (0.0%) |
| 5 to 17 Years | 0 (0.0%) | 0 (0.0%) |
| 18 to 34 Years | 0 (0.0%) | 0 (0.0%) |
| 35 to 64 Years | 0 (0.0%) | 0 (0.0%) |
| 65 to 74 Years | 0 (0.0%) | 0 (0.0%) |
| 75 Years and over | 0 (0.0%) | 0 (0.0%) |
Disability Class: Cognitive Difficulty
| Age Bracket | Male | Female |
| 5 to 17 Years | 0 (0.0%) | 0 (0.0%) |
| 18 to 34 Years | 0 (0.0%) | 0 (0.0%) |
| 35 to 64 Years | 0 (0.0%) | 0 (0.0%) |
| 65 to 74 Years | 0 (0.0%) | 0 (0.0%) |
| 75 Years and over | 0 (0.0%) | 0 (0.0%) |
Disability Class: Ambulatory Difficulty
| Age Bracket | Male | Female |
| 5 to 17 Years | 0 (0.0%) | 0 (0.0%) |
| 18 to 34 Years | 0 (0.0%) | 0 (0.0%) |
| 35 to 64 Years | 0 (0.0%) | 0 (0.0%) |
| 65 to 74 Years | 0 (0.0%) | 0 (0.0%) |
| 75 Years and over | 0 (0.0%) | 0 (0.0%) |
Disability Class: Self-Care Difficulty
| Age Bracket | Male | Female |
| 5 to 17 Years | 0 (0.0%) | 0 (0.0%) |
| 18 to 34 Years | 0 (0.0%) | 0 (0.0%) |
| 35 to 64 Years | 0 (0.0%) | 0 (0.0%) |
| 65 to 74 Years | 0 (0.0%) | 0 (0.0%) |
| 75 Years and over | 0 (0.0%) | 0 (0.0%) |
Technology Access in Linnell Camp
Computing Device Access in Linnell Camp
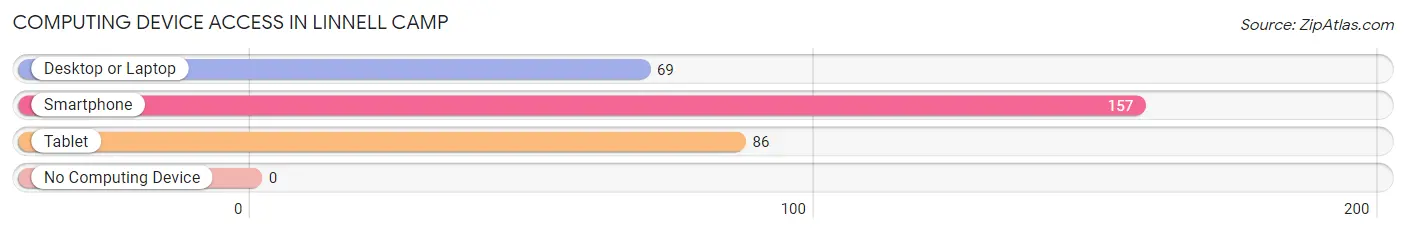
| Device Type | # Households | % Households |
| Desktop or Laptop | 69 | 44.0% |
| Smartphone | 157 | 100.0% |
| Tablet | 86 | 54.8% |
| No Computing Device | 0 | 0.0% |
| Total | 157 | 100.0% |
Internet Access in Linnell Camp
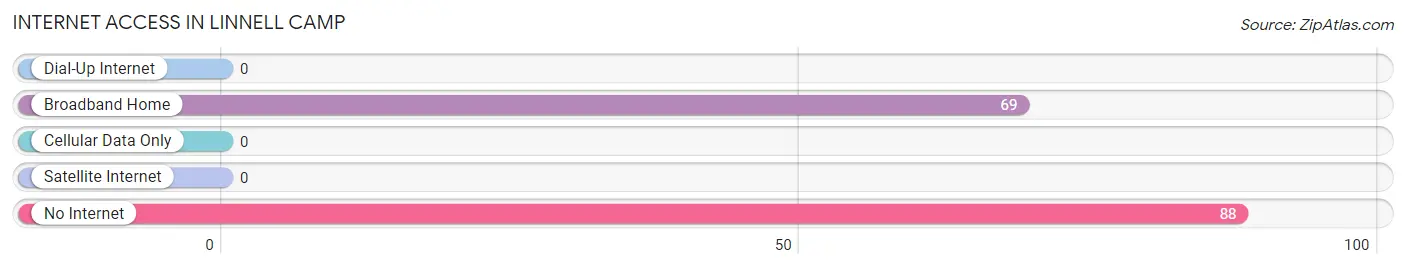
| Internet Type | # Households | % Households |
| Dial-Up Internet | 0 | 0.0% |
| Broadband Home | 69 | 44.0% |
| Cellular Data Only | 0 | 0.0% |
| Satellite Internet | 0 | 0.0% |
| No Internet | 88 | 56.0% |
| Total | 157 | 100.0% |
Linnell Camp Summary
Linnell Camp is a small unincorporated community located in the Sierra Nevada Mountains of California. It is situated in the Plumas National Forest, approximately 10 miles east of Quincy, California. The camp is named after the Linnell family, who were among the first settlers in the area.
History
The Linnell family first settled in the area in the late 1800s. They were drawn to the area by the abundance of natural resources, including timber, water, and wildlife. The family built a cabin and began to farm the land. They also built a sawmill and a general store.
The Linnell family was instrumental in the development of the area. They helped to build roads, bridges, and other infrastructure. They also helped to establish the local school and post office.
In the early 1900s, the Linnell family sold their land to the U.S. Forest Service. The Forest Service established the Linnell Camp Recreation Area in the area. The camp was used as a base for logging operations and as a recreational area for visitors.
Geography
Linnell Camp is located in the Sierra Nevada Mountains of California. It is situated in the Plumas National Forest, approximately 10 miles east of Quincy, California. The camp is surrounded by the Plumas National Forest and is located at an elevation of 5,000 feet.
The area is characterized by rolling hills, dense forests, and numerous streams and lakes. The climate is generally mild, with temperatures ranging from the mid-30s in the winter to the mid-80s in the summer.
Economy
The economy of Linnell Camp is largely based on tourism. The camp is a popular destination for hikers, campers, and other outdoor enthusiasts. The camp also offers a variety of recreational activities, including fishing, hunting, and horseback riding.
The camp is also home to a number of small businesses, including a general store, a gas station, and a restaurant. The camp is also home to a number of small-scale logging operations.
Demographics
As of the 2010 census, the population of Linnell Camp was estimated to be around 200 people. The population is largely white, with a small percentage of Native American and Hispanic residents. The median household income is around $30,000.
Conclusion
Linnell Camp is a small unincorporated community located in the Sierra Nevada Mountains of California. It is situated in the Plumas National Forest, approximately 10 miles east of Quincy, California. The camp is named after the Linnell family, who were among the first settlers in the area. The economy of Linnell Camp is largely based on tourism, with a number of small businesses and recreational activities available. As of the 2010 census, the population of Linnell Camp was estimated to be around 200 people.
Common Questions
What is Per Capita Income in Linnell Camp?
Per Capita income in Linnell Camp is $9,786.
What is the Median Family Income in Linnell Camp?
Median Family Income in Linnell Camp is $33,292.
What is the Median Household income in Linnell Camp?
Median Household Income in Linnell Camp is $33,292.
What is Family Income Deficit in Linnell Camp?
Family Income Deficit in Linnell Camp is $14,258.
Families that are below poverty line in Linnell Camp earn $14,258 less on average than the poverty threshold level.
What is Inequality or Gini Index in Linnell Camp?
Inequality or Gini Index in Linnell Camp is 0.36.
What is the Total Population of Linnell Camp?
Total Population of Linnell Camp is 737.
What is the Total Male Population of Linnell Camp?
Total Male Population of Linnell Camp is 397.
What is the Total Female Population of Linnell Camp?
Total Female Population of Linnell Camp is 340.
What is the Ratio of Males per 100 Females in Linnell Camp?
There are 116.76 Males per 100 Females in Linnell Camp.
What is the Ratio of Females per 100 Males in Linnell Camp?
There are 85.64 Females per 100 Males in Linnell Camp.
What is the Median Population Age in Linnell Camp?
Median Population Age in Linnell Camp is 26.1 Years.
What is the Average Family Size in Linnell Camp
Average Family Size in Linnell Camp is 4.7 People.
What is the Average Household Size in Linnell Camp
Average Household Size in Linnell Camp is 4.7 People.
How Large is the Labor Force in Linnell Camp?
There are 272 People in the Labor Forcein in Linnell Camp.
What is the Percentage of People in the Labor Force in Linnell Camp?
66.2% of People are in the Labor Force in Linnell Camp.