Cities with the Highest Poverty Level Among Families in Oklahoma
RELATED REPORTS & OPTIONS
Highest Family Poverty
Oklahoma
Compare Cities
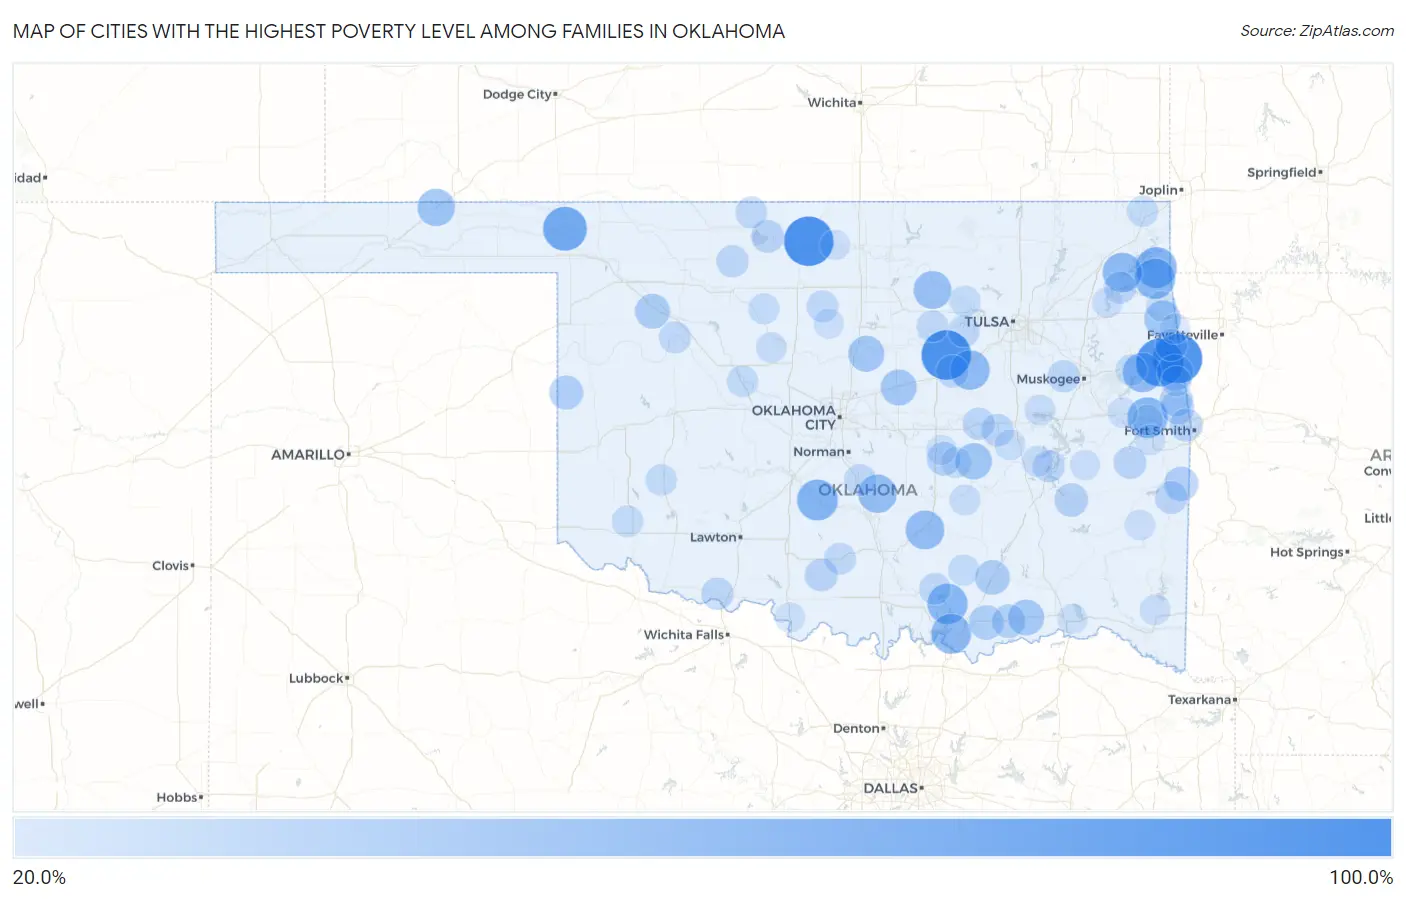
Map of Cities with the Highest Poverty Level Among Families in Oklahoma
0.0%
100.0%
Cities with the Highest Poverty Level Among Families in Oklahoma
| City | Family Poverty | vs State | vs National | |
| 1. | Oak Hill-Piney | 100.0% | 11.0%(+89.0)#1 | 8.8%(+91.2)#35 |
| 2. | Shamrock | 100.0% | 11.0%(+89.0)#2 | 8.8%(+91.2)#92 |
| 3. | Piney | 100.0% | 11.0%(+89.0)#3 | 8.8%(+91.2)#111 |
| 4. | Jefferson | 100.0% | 11.0%(+89.0)#4 | 8.8%(+91.2)#118 |
| 5. | Mulberry | 93.8% | 11.0%(+82.7)#5 | 8.8%(+85.0)#127 |
| 6. | Rosston | 77.8% | 11.0%(+66.8)#6 | 8.8%(+69.0)#181 |
| 7. | Butler | 66.7% | 11.0%(+55.7)#7 | 8.8%(+57.9)#270 |
| 8. | Bradley | 66.7% | 11.0%(+55.7)#8 | 8.8%(+57.9)#271 |
| 9. | Elohim | 66.7% | 11.0%(+55.7)#9 | 8.8%(+57.9)#279 |
| 10. | Deer Lick | 64.7% | 11.0%(+53.7)#10 | 8.8%(+55.9)#302 |
| 11. | Badger Lee | 64.7% | 11.0%(+53.7)#11 | 8.8%(+55.9)#304 |
| 12. | Bee | 64.3% | 11.0%(+53.3)#12 | 8.8%(+55.5)#314 |
| 13. | Platter | 62.8% | 11.0%(+51.8)#13 | 8.8%(+54.0)#342 |
| 14. | Grand Lake Towne | 61.7% | 11.0%(+50.7)#14 | 8.8%(+52.9)#360 |
| 15. | Slick | 61.5% | 11.0%(+50.5)#15 | 8.8%(+52.8)#364 |
| 16. | Tenkiller | 61.1% | 11.0%(+50.1)#16 | 8.8%(+52.3)#367 |
| 17. | Fitzhugh | 58.6% | 11.0%(+47.5)#17 | 8.8%(+49.8)#415 |
| 18. | Rosedale | 57.1% | 11.0%(+46.1)#18 | 8.8%(+48.4)#444 |
| 19. | Bowring | 55.6% | 11.0%(+44.5)#19 | 8.8%(+46.8)#483 |
| 20. | Skedee | 55.6% | 11.0%(+44.5)#20 | 8.8%(+46.8)#485 |
| 21. | Tyrone | 53.9% | 11.0%(+42.9)#21 | 8.8%(+45.1)#530 |
| 22. | Elm Grove | 50.0% | 11.0%(+39.0)#22 | 8.8%(+41.2)#649 |
| 23. | Yeager | 50.0% | 11.0%(+39.0)#23 | 8.8%(+41.2)#652 |
| 24. | Moyers | 50.0% | 11.0%(+39.0)#24 | 8.8%(+41.2)#653 |
| 25. | Dripping Springs | 50.0% | 11.0%(+39.0)#25 | 8.8%(+41.2)#671 |
| 26. | Langston | 48.6% | 11.0%(+37.6)#26 | 8.8%(+39.8)#723 |
| 27. | Warwick | 48.5% | 11.0%(+37.5)#27 | 8.8%(+39.7)#728 |
| 28. | Boswell | 48.2% | 11.0%(+37.2)#28 | 8.8%(+39.4)#736 |
| 29. | Mutual | 44.4% | 11.0%(+33.4)#29 | 8.8%(+35.7)#912 |
| 30. | Tushka | 43.7% | 11.0%(+32.7)#30 | 8.8%(+34.9)#944 |
| 31. | Blue | 42.9% | 11.0%(+31.8)#31 | 8.8%(+34.1)#1,007 |
| 32. | Monroe | 41.9% | 11.0%(+30.9)#32 | 8.8%(+33.2)#1,057 |
| 33. | Reydon | 41.3% | 11.0%(+30.3)#33 | 8.8%(+32.5)#1,115 |
| 34. | Mcbride | 40.7% | 11.0%(+29.7)#34 | 8.8%(+32.0)#1,159 |
| 35. | Bennington | 40.0% | 11.0%(+29.0)#35 | 8.8%(+31.2)#1,199 |
| 36. | Gowen | 40.0% | 11.0%(+29.0)#36 | 8.8%(+31.2)#1,202 |
| 37. | Lima | 40.0% | 11.0%(+29.0)#37 | 8.8%(+31.2)#1,209 |
| 38. | White Eagle | 39.5% | 11.0%(+28.5)#38 | 8.8%(+30.8)#1,243 |
| 39. | Belfonte | 39.0% | 11.0%(+28.0)#39 | 8.8%(+30.2)#1,286 |
| 40. | Nicut | 38.3% | 11.0%(+27.3)#40 | 8.8%(+29.5)#1,335 |
| 41. | Nescatunga | 37.5% | 11.0%(+26.5)#41 | 8.8%(+28.7)#1,384 |
| 42. | Baker | 37.5% | 11.0%(+26.5)#42 | 8.8%(+28.7)#1,387 |
| 43. | Moffett | 37.5% | 11.0%(+26.5)#43 | 8.8%(+28.7)#1,389 |
| 44. | Loco | 36.8% | 11.0%(+25.8)#44 | 8.8%(+28.1)#1,442 |
| 45. | Heavener | 36.7% | 11.0%(+25.7)#45 | 8.8%(+27.9)#1,449 |
| 46. | Mccurtain | 36.4% | 11.0%(+25.4)#46 | 8.8%(+27.6)#1,474 |
| 47. | Hodgen | 36.4% | 11.0%(+25.4)#47 | 8.8%(+27.6)#1,481 |
| 48. | Depew | 36.1% | 11.0%(+25.1)#48 | 8.8%(+27.3)#1,500 |
| 49. | Weleetka | 35.2% | 11.0%(+24.2)#49 | 8.8%(+26.4)#1,592 |
| 50. | Devol | 35.1% | 11.0%(+24.1)#50 | 8.8%(+26.4)#1,597 |
| 51. | Carmen | 35.0% | 11.0%(+24.0)#51 | 8.8%(+26.2)#1,609 |
| 52. | Taft | 34.8% | 11.0%(+23.8)#52 | 8.8%(+26.0)#1,630 |
| 53. | Okemah | 34.7% | 11.0%(+23.7)#53 | 8.8%(+25.9)#1,638 |
| 54. | Spavinaw | 34.5% | 11.0%(+23.5)#54 | 8.8%(+25.7)#1,654 |
| 55. | Old Green | 34.4% | 11.0%(+23.4)#55 | 8.8%(+25.6)#1,673 |
| 56. | Crowder | 34.3% | 11.0%(+23.3)#56 | 8.8%(+25.5)#1,685 |
| 57. | Taloga | 33.9% | 11.0%(+22.9)#57 | 8.8%(+25.1)#1,718 |
| 58. | Lexington | 33.7% | 11.0%(+22.7)#58 | 8.8%(+24.9)#1,747 |
| 59. | Tishomingo | 33.3% | 11.0%(+22.3)#59 | 8.8%(+24.6)#1,764 |
| 60. | Little Rock | 33.3% | 11.0%(+22.3)#60 | 8.8%(+24.6)#1,793 |
| 61. | Lawrence Creek | 33.3% | 11.0%(+22.3)#61 | 8.8%(+24.6)#1,804 |
| 62. | Ratliff City | 33.3% | 11.0%(+22.3)#62 | 8.8%(+24.6)#1,805 |
| 63. | Bunch | 33.3% | 11.0%(+22.3)#63 | 8.8%(+24.6)#1,823 |
| 64. | Douglas | 33.3% | 11.0%(+22.3)#64 | 8.8%(+24.6)#1,825 |
| 65. | Amorita | 33.3% | 11.0%(+22.3)#65 | 8.8%(+24.6)#1,827 |
| 66. | Avard | 33.3% | 11.0%(+22.3)#66 | 8.8%(+24.6)#1,832 |
| 67. | Yale | 32.8% | 11.0%(+21.8)#67 | 8.8%(+24.0)#1,856 |
| 68. | Hobart | 32.3% | 11.0%(+21.3)#68 | 8.8%(+23.5)#1,906 |
| 69. | Martha | 32.1% | 11.0%(+21.1)#69 | 8.8%(+23.4)#1,916 |
| 70. | Greenfield | 32.1% | 11.0%(+21.1)#70 | 8.8%(+23.4)#1,917 |
| 71. | Keys | 31.8% | 11.0%(+20.7)#71 | 8.8%(+23.0)#1,965 |
| 72. | Bache | 31.6% | 11.0%(+20.6)#72 | 8.8%(+22.8)#1,996 |
| 73. | Commerce | 31.5% | 11.0%(+20.4)#73 | 8.8%(+22.7)#2,006 |
| 74. | Ames | 31.1% | 11.0%(+20.1)#74 | 8.8%(+22.3)#2,059 |
| 75. | Osage | 30.8% | 11.0%(+19.8)#75 | 8.8%(+22.0)#2,108 |
| 76. | Tonkawa Tribal Housing | 30.6% | 11.0%(+19.6)#76 | 8.8%(+21.8)#2,131 |
| 77. | Wapanucka | 30.5% | 11.0%(+19.5)#77 | 8.8%(+21.7)#2,148 |
| 78. | Wewoka | 30.2% | 11.0%(+19.2)#78 | 8.8%(+21.5)#2,187 |
| 79. | Indianola | 30.0% | 11.0%(+19.0)#79 | 8.8%(+21.2)#2,232 |
| 80. | Allen | 29.9% | 11.0%(+18.9)#80 | 8.8%(+21.1)#2,260 |
| 81. | Loyal | 29.6% | 11.0%(+18.6)#81 | 8.8%(+20.8)#2,290 |
| 82. | Dustin | 29.6% | 11.0%(+18.6)#82 | 8.8%(+20.8)#2,299 |
| 83. | Pumpkin Hollow | 29.4% | 11.0%(+18.4)#83 | 8.8%(+20.6)#2,325 |
| 84. | Hitchita | 29.4% | 11.0%(+18.4)#84 | 8.8%(+20.6)#2,327 |
| 85. | Sallisaw | 28.8% | 11.0%(+17.8)#85 | 8.8%(+20.0)#2,411 |
| 86. | Broken Bow | 28.8% | 11.0%(+17.8)#86 | 8.8%(+20.0)#2,423 |
| 87. | Whitesboro | 28.6% | 11.0%(+17.6)#87 | 8.8%(+19.8)#2,459 |
| 88. | Cowlington | 28.6% | 11.0%(+17.6)#88 | 8.8%(+19.8)#2,462 |
| 89. | Salina | 28.5% | 11.0%(+17.5)#89 | 8.8%(+19.7)#2,483 |
| 90. | Bell | 28.3% | 11.0%(+17.3)#90 | 8.8%(+19.6)#2,504 |
| 91. | Colcord | 28.2% | 11.0%(+17.2)#91 | 8.8%(+19.4)#2,533 |
| 92. | Canadian Shores | 28.1% | 11.0%(+17.1)#92 | 8.8%(+19.3)#2,544 |
| 93. | Watts | 28.0% | 11.0%(+17.0)#93 | 8.8%(+19.2)#2,565 |
| 94. | Quinton | 27.9% | 11.0%(+16.9)#94 | 8.8%(+19.1)#2,591 |
| 95. | Carlisle | 27.8% | 11.0%(+16.8)#95 | 8.8%(+19.0)#2,606 |
| 96. | Seminole | 27.7% | 11.0%(+16.7)#96 | 8.8%(+19.0)#2,625 |
| 97. | Hugo | 27.7% | 11.0%(+16.7)#97 | 8.8%(+18.9)#2,629 |
| 98. | Ryan | 27.6% | 11.0%(+16.6)#98 | 8.8%(+18.9)#2,640 |
| 99. | Marshall | 27.3% | 11.0%(+16.3)#99 | 8.8%(+18.5)#2,712 |
| 100. | Lamont | 27.3% | 11.0%(+16.3)#100 | 8.8%(+18.5)#2,716 |
Common Questions
What are the Top 10 Cities with the Highest Poverty Level Among Families in Oklahoma?
Top 10 Cities with the Highest Poverty Level Among Families in Oklahoma are:
What city has the Highest Poverty Level Among Families in Oklahoma?
Shamrock has the Highest Poverty Level Among Families in Oklahoma with 100.0%.
What is the Poverty Level Among Families in the State of Oklahoma?
Poverty Level Among Families in Oklahoma is 11.0%.
What is the Poverty Level Among Families in the United States?
Poverty Level Among Families in the United States is 8.8%.