Cities with the Highest Poverty Level Among Families in Georgia
RELATED REPORTS & OPTIONS
Highest Family Poverty
Georgia
Compare Cities
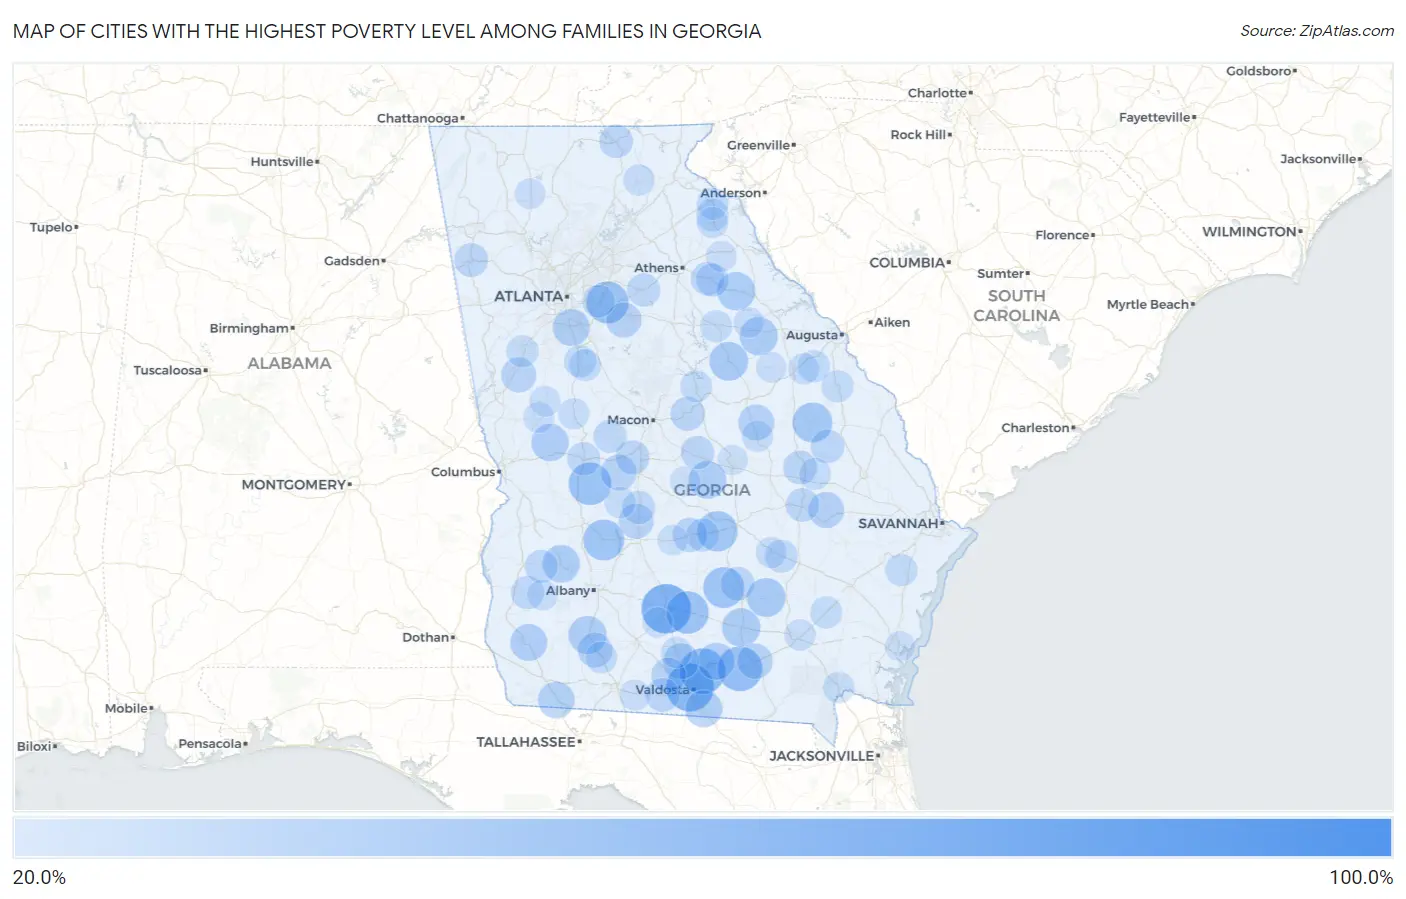
Map of Cities with the Highest Poverty Level Among Families in Georgia
0.0%
100.0%
Cities with the Highest Poverty Level Among Families in Georgia
| City | Family Poverty | vs State | vs National | |
| 1. | Gough | 100.0% | 10.0%(+90.0)#1 | 8.8%(+91.2)#46 |
| 2. | Warthen | 95.1% | 10.0%(+85.1)#2 | 8.8%(+86.3)#124 |
| 3. | Phillipsburg | 68.4% | 10.0%(+58.4)#3 | 8.8%(+59.6)#255 |
| 4. | Remerton | 64.8% | 10.0%(+54.8)#4 | 8.8%(+56.0)#300 |
| 5. | Juliette | 64.3% | 10.0%(+54.3)#5 | 8.8%(+55.5)#312 |
| 6. | Moody Afb | 60.3% | 10.0%(+50.3)#6 | 8.8%(+51.5)#378 |
| 7. | Hickox | 60.2% | 10.0%(+50.1)#7 | 8.8%(+51.4)#381 |
| 8. | Du Pont | 58.3% | 10.0%(+48.3)#8 | 8.8%(+49.6)#418 |
| 9. | Ideal | 53.7% | 10.0%(+43.6)#9 | 8.8%(+44.9)#537 |
| 10. | Enigma | 53.3% | 10.0%(+43.2)#10 | 8.8%(+44.5)#547 |
| 11. | Lakeview Estates | 52.6% | 10.0%(+42.6)#11 | 8.8%(+43.8)#567 |
| 12. | Ambrose | 50.0% | 10.0%(+40.0)#12 | 8.8%(+41.2)#647 |
| 13. | De Soto | 50.0% | 10.0%(+40.0)#13 | 8.8%(+41.2)#664 |
| 14. | Milan | 48.9% | 10.0%(+38.8)#14 | 8.8%(+40.1)#717 |
| 15. | Midville | 47.9% | 10.0%(+37.9)#15 | 8.8%(+39.1)#755 |
| 16. | Box Springs | 47.8% | 10.0%(+37.8)#16 | 8.8%(+39.0)#759 |
| 17. | Sparta | 45.6% | 10.0%(+35.5)#17 | 8.8%(+36.8)#845 |
| 18. | Nicholls | 45.4% | 10.0%(+35.4)#18 | 8.8%(+36.6)#860 |
| 19. | Pearson | 44.6% | 10.0%(+34.6)#19 | 8.8%(+35.8)#895 |
| 20. | Norwood | 44.4% | 10.0%(+34.4)#20 | 8.8%(+35.7)#898 |
| 21. | Rayle | 44.4% | 10.0%(+34.4)#21 | 8.8%(+35.7)#903 |
| 22. | Camilla | 43.8% | 10.0%(+33.8)#22 | 8.8%(+35.1)#935 |
| 23. | Chester | 43.0% | 10.0%(+33.0)#23 | 8.8%(+34.2)#992 |
| 24. | Dawson | 42.8% | 10.0%(+32.8)#24 | 8.8%(+34.1)#1,016 |
| 25. | Talbotton | 42.6% | 10.0%(+32.6)#25 | 8.8%(+33.8)#1,022 |
| 26. | Jonesboro | 41.7% | 10.0%(+31.7)#26 | 8.8%(+32.9)#1,076 |
| 27. | Lake Park | 41.7% | 10.0%(+31.7)#27 | 8.8%(+32.9)#1,078 |
| 28. | Lakeland | 41.7% | 10.0%(+31.6)#28 | 8.8%(+32.9)#1,087 |
| 29. | Colquitt | 41.6% | 10.0%(+31.6)#29 | 8.8%(+32.8)#1,089 |
| 30. | Attapulgus | 41.2% | 10.0%(+31.2)#30 | 8.8%(+32.4)#1,119 |
| 31. | Collins | 39.4% | 10.0%(+29.4)#31 | 8.8%(+30.6)#1,250 |
| 32. | Harrison | 39.4% | 10.0%(+29.4)#32 | 8.8%(+30.6)#1,251 |
| 33. | Cecil | 39.4% | 10.0%(+29.3)#33 | 8.8%(+30.6)#1,259 |
| 34. | Marshallville | 39.0% | 10.0%(+29.0)#34 | 8.8%(+30.2)#1,289 |
| 35. | Homerville | 38.5% | 10.0%(+28.5)#35 | 8.8%(+29.8)#1,320 |
| 36. | Porterdale | 37.8% | 10.0%(+27.8)#36 | 8.8%(+29.1)#1,362 |
| 37. | Lone Oak | 37.5% | 10.0%(+27.5)#37 | 8.8%(+28.7)#1,381 |
| 38. | Vienna | 37.4% | 10.0%(+27.3)#38 | 8.8%(+28.6)#1,401 |
| 39. | Pelham | 37.3% | 10.0%(+27.2)#39 | 8.8%(+28.5)#1,413 |
| 40. | Morven | 36.9% | 10.0%(+26.9)#40 | 8.8%(+28.2)#1,432 |
| 41. | Abbeville | 36.3% | 10.0%(+26.3)#41 | 8.8%(+27.5)#1,486 |
| 42. | Gordon | 36.1% | 10.0%(+26.0)#42 | 8.8%(+27.3)#1,502 |
| 43. | Fort Valley | 35.7% | 10.0%(+25.7)#43 | 8.8%(+26.9)#1,528 |
| 44. | Broxton | 35.4% | 10.0%(+25.4)#44 | 8.8%(+26.7)#1,562 |
| 45. | Quitman | 35.3% | 10.0%(+25.3)#45 | 8.8%(+26.5)#1,573 |
| 46. | Cedartown | 35.2% | 10.0%(+25.2)#46 | 8.8%(+26.4)#1,594 |
| 47. | Nunez | 35.0% | 10.0%(+25.0)#47 | 8.8%(+26.2)#1,610 |
| 48. | Lyons | 34.7% | 10.0%(+24.7)#48 | 8.8%(+25.9)#1,637 |
| 49. | Crawford | 34.6% | 10.0%(+24.6)#49 | 8.8%(+25.8)#1,642 |
| 50. | Garfield | 34.5% | 10.0%(+24.5)#50 | 8.8%(+25.7)#1,657 |
| 51. | Blairsville | 34.5% | 10.0%(+24.4)#51 | 8.8%(+25.7)#1,662 |
| 52. | Danville | 34.3% | 10.0%(+24.3)#52 | 8.8%(+25.5)#1,683 |
| 53. | Pinehurst | 34.1% | 10.0%(+24.1)#53 | 8.8%(+25.3)#1,701 |
| 54. | Edison | 34.0% | 10.0%(+24.0)#54 | 8.8%(+25.2)#1,713 |
| 55. | Butler | 34.0% | 10.0%(+23.9)#55 | 8.8%(+25.2)#1,714 |
| 56. | Roberta | 34.0% | 10.0%(+23.9)#56 | 8.8%(+25.2)#1,715 |
| 57. | Monroe | 33.9% | 10.0%(+23.9)#57 | 8.8%(+25.1)#1,728 |
| 58. | Rhine | 33.8% | 10.0%(+23.7)#58 | 8.8%(+25.0)#1,740 |
| 59. | Shellman | 33.5% | 10.0%(+23.5)#59 | 8.8%(+24.7)#1,758 |
| 60. | Graham | 33.3% | 10.0%(+23.3)#60 | 8.8%(+24.6)#1,770 |
| 61. | Lexington | 33.3% | 10.0%(+23.3)#61 | 8.8%(+24.6)#1,776 |
| 62. | Canon | 32.7% | 10.0%(+22.7)#62 | 8.8%(+24.0)#1,862 |
| 63. | Lithonia | 32.4% | 10.0%(+22.4)#63 | 8.8%(+23.6)#1,899 |
| 64. | Eulonia | 32.1% | 10.0%(+22.0)#64 | 8.8%(+23.3)#1,927 |
| 65. | Riceboro | 31.9% | 10.0%(+21.9)#65 | 8.8%(+23.1)#1,938 |
| 66. | Experiment | 31.9% | 10.0%(+21.9)#66 | 8.8%(+23.1)#1,942 |
| 67. | Keysville | 31.8% | 10.0%(+21.8)#67 | 8.8%(+23.0)#1,952 |
| 68. | Offerman | 31.8% | 10.0%(+21.8)#68 | 8.8%(+23.0)#1,959 |
| 69. | East Newnan | 31.7% | 10.0%(+21.7)#69 | 8.8%(+22.9)#1,971 |
| 70. | East Griffin | 31.7% | 10.0%(+21.7)#70 | 8.8%(+22.9)#1,973 |
| 71. | Waynesboro | 31.7% | 10.0%(+21.7)#71 | 8.8%(+22.9)#1,976 |
| 72. | Siloam | 31.2% | 10.0%(+21.2)#72 | 8.8%(+22.5)#2,032 |
| 73. | Stillmore | 31.1% | 10.0%(+21.0)#73 | 8.8%(+22.3)#2,063 |
| 74. | Lavonia | 30.8% | 10.0%(+20.8)#74 | 8.8%(+22.1)#2,092 |
| 75. | Milledgeville | 30.8% | 10.0%(+20.8)#75 | 8.8%(+22.0)#2,097 |
| 76. | Meigs | 30.8% | 10.0%(+20.7)#76 | 8.8%(+22.0)#2,105 |
| 77. | Folkston | 30.1% | 10.0%(+20.1)#77 | 8.8%(+21.3)#2,204 |
| 78. | Dooling | 30.0% | 10.0%(+20.0)#78 | 8.8%(+21.2)#2,239 |
| 79. | Sunnyside | 29.9% | 10.0%(+19.9)#79 | 8.8%(+21.2)#2,247 |
| 80. | Royston | 29.9% | 10.0%(+19.9)#80 | 8.8%(+21.2)#2,248 |
| 81. | Cleveland | 29.9% | 10.0%(+19.8)#81 | 8.8%(+21.1)#2,262 |
| 82. | Wrightsville | 29.8% | 10.0%(+19.8)#82 | 8.8%(+21.0)#2,269 |
| 83. | Matthews | 29.8% | 10.0%(+19.8)#83 | 8.8%(+21.0)#2,271 |
| 84. | Thomaston | 29.7% | 10.0%(+19.7)#84 | 8.8%(+21.0)#2,278 |
| 85. | Hazlehurst | 29.6% | 10.0%(+19.6)#85 | 8.8%(+20.8)#2,296 |
| 86. | Adel | 29.5% | 10.0%(+19.5)#86 | 8.8%(+20.7)#2,306 |
| 87. | Boston | 29.1% | 10.0%(+19.0)#87 | 8.8%(+20.3)#2,372 |
| 88. | Carlton | 29.1% | 10.0%(+19.0)#88 | 8.8%(+20.3)#2,373 |
| 89. | Manchester | 29.0% | 10.0%(+19.0)#89 | 8.8%(+20.2)#2,380 |
| 90. | Morgan | 28.9% | 10.0%(+18.9)#90 | 8.8%(+20.1)#2,396 |
| 91. | Woodbury | 28.6% | 10.0%(+18.5)#91 | 8.8%(+19.8)#2,448 |
| 92. | Ranger | 28.6% | 10.0%(+18.5)#92 | 8.8%(+19.8)#2,470 |
| 93. | Sharon | 28.6% | 10.0%(+18.5)#93 | 8.8%(+19.8)#2,473 |
| 94. | Gibson | 28.4% | 10.0%(+18.4)#94 | 8.8%(+19.6)#2,491 |
| 95. | Rochelle | 28.4% | 10.0%(+18.3)#95 | 8.8%(+19.6)#2,501 |
| 96. | Faceville | 28.0% | 10.0%(+18.0)#96 | 8.8%(+19.2)#2,567 |
| 97. | Dublin | 27.9% | 10.0%(+17.9)#97 | 8.8%(+19.1)#2,593 |
| 98. | Omega | 27.8% | 10.0%(+17.7)#98 | 8.8%(+19.0)#2,623 |
| 99. | Brunswick | 27.6% | 10.0%(+17.6)#99 | 8.8%(+18.9)#2,643 |
| 100. | Cochran | 27.6% | 10.0%(+17.5)#100 | 8.8%(+18.8)#2,661 |
Common Questions
What are the Top 10 Cities with the Highest Poverty Level Among Families in Georgia?
Top 10 Cities with the Highest Poverty Level Among Families in Georgia are:
#1
68.4%
#2
64.8%
#3
60.3%
#4
58.3%
#5
53.7%
#6
53.3%
#7
52.6%
#8
50.0%
#9
50.0%
#10
48.9%
What city has the Highest Poverty Level Among Families in Georgia?
Phillipsburg has the Highest Poverty Level Among Families in Georgia with 68.4%.
What is the Poverty Level Among Families in the State of Georgia?
Poverty Level Among Families in Georgia is 10.0%.
What is the Poverty Level Among Families in the United States?
Poverty Level Among Families in the United States is 8.8%.