Cities with the Highest Poverty Level Among Families in Connecticut
RELATED REPORTS & OPTIONS
Highest Family Poverty
Connecticut
Compare Cities
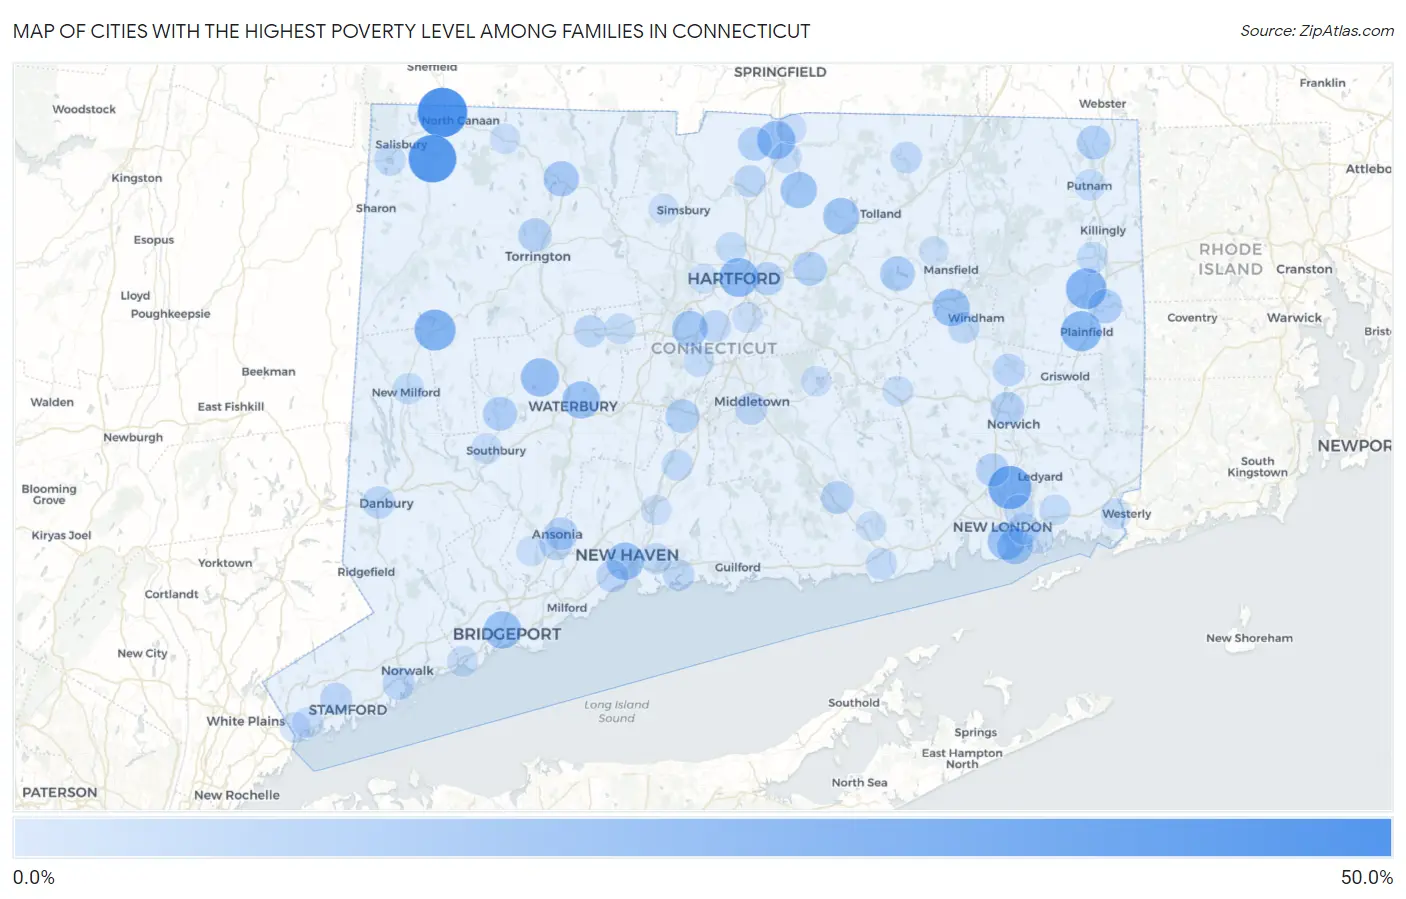
Map of Cities with the Highest Poverty Level Among Families in Connecticut
0.0%
50.0%
Cities with the Highest Poverty Level Among Families in Connecticut
| City | Family Poverty | vs State | vs National | |
| 1. | West Cornwall | 45.5% | 6.8%(+38.6)#1 | 8.8%(+36.7)#856 |
| 2. | Canaan | 45.2% | 6.8%(+38.3)#2 | 8.8%(+36.4)#870 |
| 3. | Falls Village | 41.1% | 6.8%(+34.2)#3 | 8.8%(+32.3)#1,138 |
| 4. | Pleasant Valley | 34.3% | 6.8%(+27.5)#4 | 8.8%(+25.5)#1,677 |
| 5. | Gales Ferry | 31.0% | 6.8%(+24.2)#5 | 8.8%(+22.2)#2,069 |
| 6. | Taylor Corners | 27.4% | 6.8%(+20.6)#6 | 8.8%(+18.6)#2,686 |
| 7. | New Preston | 26.5% | 6.8%(+19.7)#7 | 8.8%(+17.7)#2,864 |
| 8. | Wauregan | 25.7% | 6.8%(+18.8)#8 | 8.8%(+16.9)#3,072 |
| 9. | Plainfield Village | 24.6% | 6.8%(+17.7)#9 | 8.8%(+15.8)#3,346 |
| 10. | Topstone | 22.8% | 6.8%(+16.0)#10 | 8.8%(+14.0)#3,814 |
| 11. | Hartford | 22.1% | 6.8%(+15.2)#11 | 8.8%(+13.3)#4,063 |
| 12. | Cornwall Bridge | 20.8% | 6.8%(+13.9)#12 | 8.8%(+12.0)#4,536 |
| 13. | Watertown | 20.5% | 6.8%(+13.7)#13 | 8.8%(+11.7)#4,633 |
| 14. | Thompsonville | 20.0% | 6.8%(+13.2)#14 | 8.8%(+11.3)#4,804 |
| 15. | Dayville | 18.7% | 6.8%(+11.8)#15 | 8.8%(+9.88)#5,422 |
| 16. | New Haven | 18.5% | 6.8%(+11.7)#16 | 8.8%(+9.77)#5,473 |
| 17. | Bridgeport | 18.5% | 6.8%(+11.7)#17 | 8.8%(+9.73)#5,493 |
| 18. | Waterbury | 18.5% | 6.8%(+11.6)#18 | 8.8%(+9.68)#5,520 |
| 19. | Willimantic | 18.4% | 6.8%(+11.6)#19 | 8.8%(+9.66)#5,521 |
| 20. | New London | 18.4% | 6.8%(+11.5)#20 | 8.8%(+9.59)#5,565 |
| 21. | Rockville | 16.6% | 6.8%(+9.79)#21 | 8.8%(+7.85)#6,504 |
| 22. | Broad Brook | 16.3% | 6.8%(+9.48)#22 | 8.8%(+7.54)#6,661 |
| 23. | Groton | 15.7% | 6.8%(+8.86)#23 | 8.8%(+6.92)#6,997 |
| 24. | New Britain | 15.1% | 6.8%(+8.27)#24 | 8.8%(+6.34)#7,372 |
| 25. | Winsted | 14.3% | 6.8%(+7.49)#25 | 8.8%(+5.55)#7,905 |
| 26. | Danielson Borough | 13.8% | 6.8%(+7.00)#26 | 8.8%(+5.07)#8,305 |
| 27. | Coventry Lake | 13.0% | 6.8%(+6.16)#27 | 8.8%(+4.22)#8,967 |
| 28. | Moosup | 11.9% | 6.8%(+5.10)#28 | 8.8%(+3.17)#9,855 |
| 29. | Woodbury Center | 11.4% | 6.8%(+4.56)#29 | 8.8%(+2.62)#10,366 |
| 30. | Manchester | 11.3% | 6.8%(+4.49)#30 | 8.8%(+2.55)#10,441 |
| 31. | Meriden | 11.2% | 6.8%(+4.34)#31 | 8.8%(+2.41)#10,561 |
| 32. | Suffield Depot | 11.0% | 6.8%(+4.12)#32 | 8.8%(+2.18)#10,784 |
| 33. | North Grosvenor Dale | 10.9% | 6.8%(+4.07)#33 | 8.8%(+2.13)#10,825 |
| 34. | Norwich | 10.5% | 6.8%(+3.70)#34 | 8.8%(+1.76)#11,176 |
| 35. | Torrington | 10.4% | 6.8%(+3.55)#35 | 8.8%(+1.61)#11,365 |
| 36. | West Mountain | 9.9% | 6.8%(+3.08)#36 | 8.8%(+1.14)#11,859 |
| 37. | East Hartford | 9.8% | 6.8%(+3.00)#37 | 8.8%(+1.06)#11,950 |
| 38. | Oxoboxo River | 9.7% | 6.8%(+2.83)#38 | 8.8%(+0.891)#12,174 |
| 39. | Chester Center | 9.4% | 6.8%(+2.57)#39 | 8.8%(+0.630)#12,456 |
| 40. | Derby | 9.2% | 6.8%(+2.36)#40 | 8.8%(+0.426)#12,667 |
| 41. | Ansonia | 9.0% | 6.8%(+2.16)#41 | 8.8%(+0.225)#12,909 |
| 42. | Groton Long Point Borough | 9.0% | 6.8%(+2.14)#42 | 8.8%(+0.200)#12,939 |
| 43. | Baltic | 8.2% | 6.8%(+1.38)#43 | 8.8%(-0.551)#13,868 |
| 44. | Norwalk | 8.2% | 6.8%(+1.38)#44 | 8.8%(-0.552)#13,871 |
| 45. | Danbury | 8.1% | 6.8%(+1.29)#45 | 8.8%(-0.643)#13,991 |
| 46. | West Haven | 7.9% | 6.8%(+1.01)#46 | 8.8%(-0.924)#14,347 |
| 47. | Middletown | 7.9% | 6.8%(+1.01)#47 | 8.8%(-0.926)#14,349 |
| 48. | Noroton Heights | 7.8% | 6.8%(+0.959)#48 | 8.8%(-0.977)#14,424 |
| 49. | Windsor Locks | 7.5% | 6.8%(+0.688)#49 | 8.8%(-1.25)#14,768 |
| 50. | Stamford | 7.3% | 6.8%(+0.490)#50 | 8.8%(-1.45)#15,037 |
| 51. | Terryville | 7.3% | 6.8%(+0.458)#51 | 8.8%(-1.48)#15,087 |
| 52. | Newington | 7.1% | 6.8%(+0.231)#52 | 8.8%(-1.70)#15,413 |
| 53. | Long Hill | 6.8% | 6.8%(-0.006)#53 | 8.8%(-1.94)#15,706 |
| 54. | South Windham | 6.6% | 6.8%(-0.263)#54 | 8.8%(-2.20)#16,038 |
| 55. | Riverton | 6.6% | 6.8%(-0.289)#55 | 8.8%(-2.22)#16,070 |
| 56. | Branford Center | 6.5% | 6.8%(-0.297)#56 | 8.8%(-2.23)#16,089 |
| 57. | Stafford Springs | 6.5% | 6.8%(-0.383)#57 | 8.8%(-2.32)#16,207 |
| 58. | Staples | 6.4% | 6.8%(-0.404)#58 | 8.8%(-2.34)#16,245 |
| 59. | Old Saybrook Center | 6.2% | 6.8%(-0.623)#59 | 8.8%(-2.56)#16,607 |
| 60. | Wallingford Center | 6.2% | 6.8%(-0.625)#60 | 8.8%(-2.56)#16,610 |
| 61. | Lordship | 6.2% | 6.8%(-0.669)#61 | 8.8%(-2.61)#16,664 |
| 62. | Compo | 6.1% | 6.8%(-0.719)#62 | 8.8%(-2.65)#16,741 |
| 63. | Lakeville | 6.0% | 6.8%(-0.811)#63 | 8.8%(-2.75)#16,876 |
| 64. | New Milford | 6.0% | 6.8%(-0.838)#64 | 8.8%(-2.77)#16,923 |
| 65. | East Haven | 5.8% | 6.8%(-1.04)#65 | 8.8%(-2.97)#17,210 |
| 66. | Putnam | 5.7% | 6.8%(-1.10)#66 | 8.8%(-3.04)#17,318 |
| 67. | East Brooklyn | 5.7% | 6.8%(-1.13)#67 | 8.8%(-3.07)#17,347 |
| 68. | Ball Pond | 5.7% | 6.8%(-1.14)#68 | 8.8%(-3.07)#17,364 |
| 69. | Bristol | 5.7% | 6.8%(-1.20)#69 | 8.8%(-3.13)#17,469 |
| 70. | Kensington | 5.4% | 6.8%(-1.48)#70 | 8.8%(-3.41)#17,881 |
| 71. | Blue Hills | 5.2% | 6.8%(-1.63)#71 | 8.8%(-3.56)#18,134 |
| 72. | Old Mystic | 5.2% | 6.8%(-1.65)#72 | 8.8%(-3.59)#18,164 |
| 73. | Daniels Farm | 5.1% | 6.8%(-1.76)#73 | 8.8%(-3.69)#18,316 |
| 74. | Pawcatuck | 5.0% | 6.8%(-1.80)#74 | 8.8%(-3.74)#18,377 |
| 75. | Southport | 4.9% | 6.8%(-1.91)#75 | 8.8%(-3.85)#18,583 |
| 76. | Southwood Acres | 4.8% | 6.8%(-2.08)#76 | 8.8%(-4.02)#18,824 |
| 77. | Pemberwick | 4.7% | 6.8%(-2.11)#77 | 8.8%(-4.05)#18,881 |
| 78. | Colchester | 4.6% | 6.8%(-2.27)#78 | 8.8%(-4.21)#19,129 |
| 79. | Candlewood Orchards | 4.6% | 6.8%(-2.27)#79 | 8.8%(-4.21)#19,131 |
| 80. | Heritage Village | 4.5% | 6.8%(-2.34)#80 | 8.8%(-4.27)#19,240 |
| 81. | Coleytown | 4.4% | 6.8%(-2.41)#81 | 8.8%(-4.35)#19,350 |
| 82. | Greenwich | 4.3% | 6.8%(-2.52)#82 | 8.8%(-4.45)#19,517 |
| 83. | Wethersfield | 4.3% | 6.8%(-2.53)#83 | 8.8%(-4.47)#19,538 |
| 84. | Conning Towers Nautilus Park | 4.2% | 6.8%(-2.60)#84 | 8.8%(-4.54)#19,656 |
| 85. | Oronoque | 4.1% | 6.8%(-2.71)#85 | 8.8%(-4.65)#19,829 |
| 86. | Lake Pocotopaug | 4.1% | 6.8%(-2.78)#86 | 8.8%(-4.72)#19,932 |
| 87. | Sherwood Manor | 4.0% | 6.8%(-2.83)#87 | 8.8%(-4.76)#20,005 |
| 88. | North Haven | 4.0% | 6.8%(-2.86)#88 | 8.8%(-4.80)#20,064 |
| 89. | Stratford Downtown | 4.0% | 6.8%(-2.89)#89 | 8.8%(-4.83)#20,107 |
| 90. | Plattsville | 3.9% | 6.8%(-2.94)#90 | 8.8%(-4.88)#20,197 |
| 91. | Essex Village | 3.9% | 6.8%(-3.00)#91 | 8.8%(-4.93)#20,256 |
| 92. | Trumbull Center | 3.8% | 6.8%(-3.03)#92 | 8.8%(-4.96)#20,318 |
| 93. | Norfolk | 3.8% | 6.8%(-3.05)#93 | 8.8%(-4.98)#20,348 |
| 94. | Noroton | 3.7% | 6.8%(-3.15)#94 | 8.8%(-5.09)#20,531 |
| 95. | Northford | 3.5% | 6.8%(-3.31)#95 | 8.8%(-5.24)#20,795 |
| 96. | Storrs | 3.5% | 6.8%(-3.31)#96 | 8.8%(-5.25)#20,805 |
| 97. | Shelton | 3.5% | 6.8%(-3.32)#97 | 8.8%(-5.25)#20,807 |
| 98. | West Simsbury | 3.5% | 6.8%(-3.32)#98 | 8.8%(-5.25)#20,815 |
| 99. | Poquonock Bridge | 3.3% | 6.8%(-3.51)#99 | 8.8%(-5.45)#21,101 |
| 100. | West Hartford | 3.3% | 6.8%(-3.55)#100 | 8.8%(-5.49)#21,183 |
1
2Common Questions
What are the Top 10 Cities with the Highest Poverty Level Among Families in Connecticut?
Top 10 Cities with the Highest Poverty Level Among Families in Connecticut are:
#1
45.2%
#2
41.1%
#3
31.0%
#4
26.5%
#5
25.7%
#6
24.6%
#7
22.1%
#8
20.5%
#9
20.0%
#10
18.5%
What city has the Highest Poverty Level Among Families in Connecticut?
Canaan has the Highest Poverty Level Among Families in Connecticut with 45.2%.
What is the Poverty Level Among Families in the State of Connecticut?
Poverty Level Among Families in Connecticut is 6.8%.
What is the Poverty Level Among Families in the United States?
Poverty Level Among Families in the United States is 8.8%.