Cities with the Highest Poverty Level Among Families in New Hampshire
RELATED REPORTS & OPTIONS
Highest Family Poverty
New Hampshire
Compare Cities
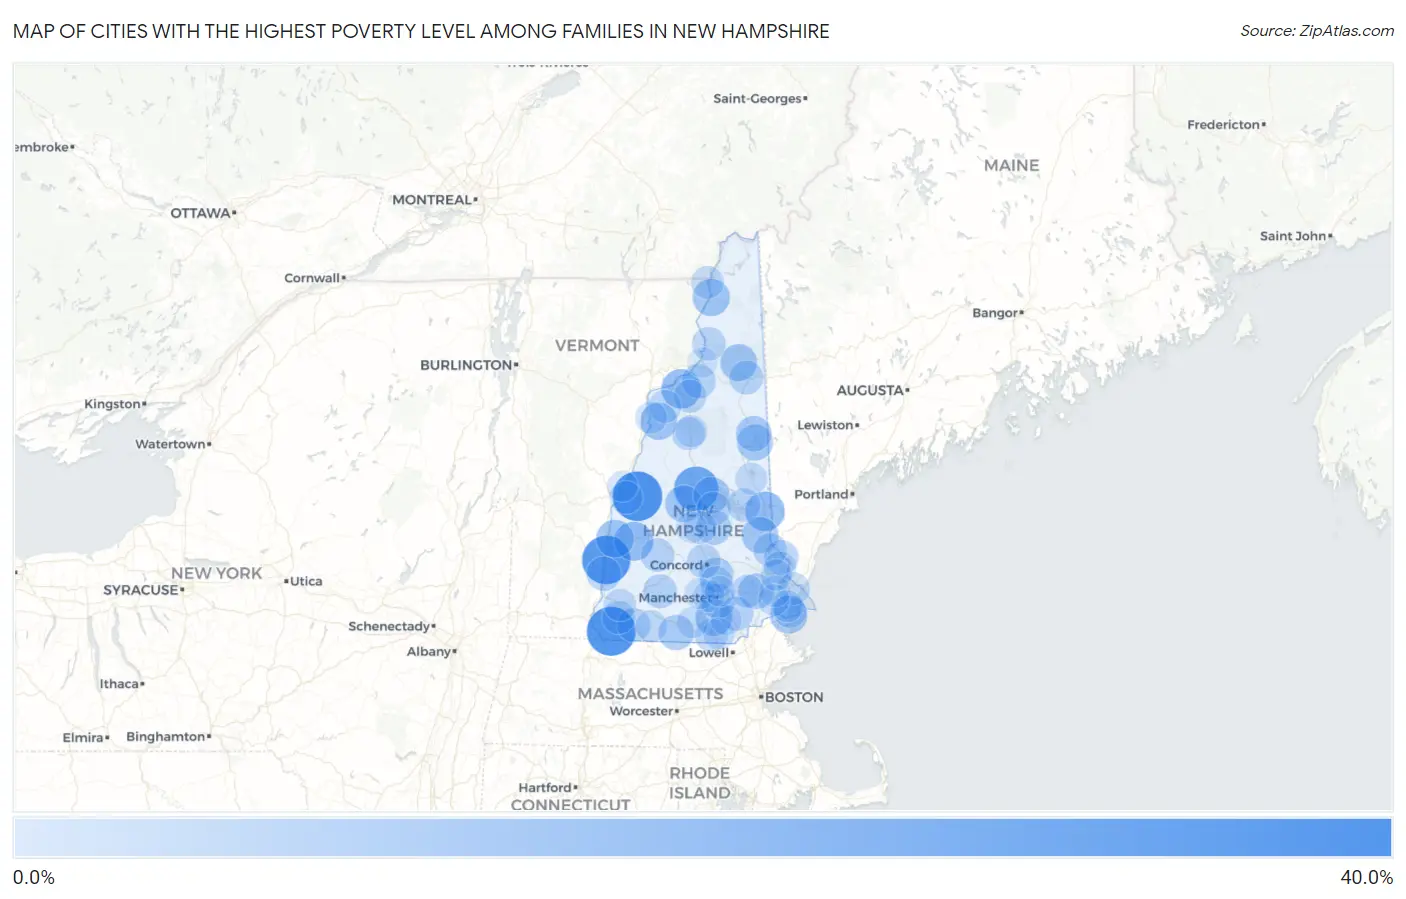
Map of Cities with the Highest Poverty Level Among Families in New Hampshire
0.0%
40.0%
Cities with the Highest Poverty Level Among Families in New Hampshire
| City | Family Poverty | vs State | vs National | |
| 1. | Enfield | 33.8% | 4.4%(+29.5)#1 | 8.8%(+25.1)#1,730 |
| 2. | Winchester | 32.7% | 4.4%(+28.3)#2 | 8.8%(+23.9)#1,867 |
| 3. | Charlestown | 31.7% | 4.4%(+27.3)#3 | 8.8%(+22.9)#1,970 |
| 4. | Ashland | 24.9% | 4.4%(+20.5)#4 | 8.8%(+16.1)#3,284 |
| 5. | Littleton | 16.2% | 4.4%(+11.8)#5 | 8.8%(+7.41)#6,726 |
| 6. | Sanbornville | 15.9% | 4.4%(+11.5)#6 | 8.8%(+7.15)#6,873 |
| 7. | Newport | 15.1% | 4.4%(+10.7)#7 | 8.8%(+6.34)#7,369 |
| 8. | Claremont | 12.9% | 4.4%(+8.49)#8 | 8.8%(+4.10)#9,072 |
| 9. | Seabrook Beach | 12.2% | 4.4%(+7.83)#9 | 8.8%(+3.43)#9,605 |
| 10. | Colebrook | 12.0% | 4.4%(+7.66)#10 | 8.8%(+3.27)#9,754 |
| 11. | Mountain Lakes | 11.8% | 4.4%(+7.46)#11 | 8.8%(+3.07)#9,935 |
| 12. | Bristol | 11.5% | 4.4%(+7.09)#12 | 8.8%(+2.70)#10,274 |
| 13. | Berlin | 11.3% | 4.4%(+6.93)#13 | 8.8%(+2.53)#10,466 |
| 14. | East Merrimack | 11.2% | 4.4%(+6.81)#14 | 8.8%(+2.41)#10,557 |
| 15. | Farmington | 10.9% | 4.4%(+6.55)#15 | 8.8%(+2.15)#10,814 |
| 16. | Meredith | 10.1% | 4.4%(+5.74)#16 | 8.8%(+1.35)#11,624 |
| 17. | Conway | 10.1% | 4.4%(+5.68)#17 | 8.8%(+1.28)#11,690 |
| 18. | Epping | 9.4% | 4.4%(+5.04)#18 | 8.8%(+0.643)#12,445 |
| 19. | North Conway | 9.1% | 4.4%(+4.68)#19 | 8.8%(+0.288)#12,844 |
| 20. | Greenville | 8.8% | 4.4%(+4.41)#20 | 8.8%(+0.018)#13,119 |
| 21. | Belmont | 8.3% | 4.4%(+3.92)#21 | 8.8%(-0.477)#13,777 |
| 22. | Manchester | 7.8% | 4.4%(+3.38)#22 | 8.8%(-1.02)#14,464 |
| 23. | Suncook | 7.6% | 4.4%(+3.21)#23 | 8.8%(-1.19)#14,698 |
| 24. | North Walpole | 7.3% | 4.4%(+2.91)#24 | 8.8%(-1.48)#15,097 |
| 25. | Somersworth | 7.3% | 4.4%(+2.87)#25 | 8.8%(-1.53)#15,160 |
| 26. | Derry | 6.7% | 4.4%(+2.31)#26 | 8.8%(-2.09)#15,881 |
| 27. | Whitefield | 6.7% | 4.4%(+2.30)#27 | 8.8%(-2.09)#15,885 |
| 28. | Antrim | 6.3% | 4.4%(+1.92)#28 | 8.8%(-2.47)#16,427 |
| 29. | Gorham | 6.3% | 4.4%(+1.92)#29 | 8.8%(-2.48)#16,435 |
| 30. | Concord | 6.2% | 4.4%(+1.83)#30 | 8.8%(-2.57)#16,616 |
| 31. | Laconia | 6.1% | 4.4%(+1.75)#31 | 8.8%(-2.64)#16,730 |
| 32. | Troy | 5.9% | 4.4%(+1.52)#32 | 8.8%(-2.87)#17,055 |
| 33. | Rochester | 5.8% | 4.4%(+1.37)#33 | 8.8%(-3.03)#17,291 |
| 34. | Bradford | 5.7% | 4.4%(+1.35)#34 | 8.8%(-3.04)#17,320 |
| 35. | Groveton | 5.7% | 4.4%(+1.31)#35 | 8.8%(-3.08)#17,380 |
| 36. | Wolfeboro | 5.6% | 4.4%(+1.23)#36 | 8.8%(-3.16)#17,502 |
| 37. | West Swanzey | 5.0% | 4.4%(+0.584)#37 | 8.8%(-3.81)#18,527 |
| 38. | Raymond | 4.9% | 4.4%(+0.550)#38 | 8.8%(-3.84)#18,580 |
| 39. | Hampton Beach | 4.8% | 4.4%(+0.461)#39 | 8.8%(-3.93)#18,717 |
| 40. | Nashua | 4.8% | 4.4%(+0.447)#40 | 8.8%(-3.95)#18,736 |
| 41. | Bethlehem | 4.7% | 4.4%(+0.319)#41 | 8.8%(-4.08)#18,911 |
| 42. | North Woodstock | 4.7% | 4.4%(+0.264)#42 | 8.8%(-4.13)#19,001 |
| 43. | Tilton Northfield | 4.6% | 4.4%(+0.219)#43 | 8.8%(-4.18)#19,080 |
| 44. | Lisbon | 4.5% | 4.4%(+0.158)#44 | 8.8%(-4.24)#19,173 |
| 45. | Lebanon | 4.5% | 4.4%(+0.098)#45 | 8.8%(-4.30)#19,276 |
| 46. | Hooksett | 4.3% | 4.4%(-0.106)#46 | 8.8%(-4.50)#19,592 |
| 47. | West Stewartstown | 4.1% | 4.4%(-0.263)#47 | 8.8%(-4.66)#19,847 |
| 48. | Keene | 3.8% | 4.4%(-0.555)#48 | 8.8%(-4.95)#20,303 |
| 49. | Portsmouth | 3.7% | 4.4%(-0.684)#49 | 8.8%(-5.08)#20,525 |
| 50. | Dover | 3.6% | 4.4%(-0.739)#50 | 8.8%(-5.13)#20,591 |
| 51. | Jaffrey | 3.2% | 4.4%(-1.17)#51 | 8.8%(-5.56)#21,316 |
| 52. | Lincoln | 3.2% | 4.4%(-1.20)#52 | 8.8%(-5.60)#21,367 |
| 53. | Center Ossipee | 3.1% | 4.4%(-1.30)#53 | 8.8%(-5.70)#21,529 |
| 54. | Woodsville | 2.9% | 4.4%(-1.53)#54 | 8.8%(-5.92)#21,909 |
| 55. | Pinardville | 2.7% | 4.4%(-1.67)#55 | 8.8%(-6.06)#22,171 |
| 56. | Hampton | 2.7% | 4.4%(-1.72)#56 | 8.8%(-6.12)#22,265 |
| 57. | Hudson | 2.5% | 4.4%(-1.91)#57 | 8.8%(-6.30)#22,586 |
| 58. | Milford | 2.3% | 4.4%(-2.12)#58 | 8.8%(-6.52)#22,936 |
| 59. | Newfields | 2.2% | 4.4%(-2.14)#59 | 8.8%(-6.53)#22,966 |
| 60. | Exeter | 2.1% | 4.4%(-2.31)#60 | 8.8%(-6.70)#23,230 |
| 61. | Durham | 2.1% | 4.4%(-2.34)#61 | 8.8%(-6.73)#23,259 |
| 62. | Hanover | 1.4% | 4.4%(-2.94)#62 | 8.8%(-7.34)#24,156 |
| 63. | Franklin | 1.4% | 4.4%(-2.97)#63 | 8.8%(-7.37)#24,198 |
| 64. | Goffstown | 1.3% | 4.4%(-3.08)#64 | 8.8%(-7.48)#24,341 |
| 65. | Londonderry | 1.0% | 4.4%(-3.35)#65 | 8.8%(-7.75)#24,661 |
| 66. | South Hooksett | 0.54% | 4.4%(-3.84)#66 | 8.8%(-8.24)#25,114 |
| 67. | Lancaster | 0.41% | 4.4%(-3.98)#67 | 8.8%(-8.37)#25,176 |
1
Common Questions
What are the Top 10 Cities with the Highest Poverty Level Among Families in New Hampshire?
Top 10 Cities with the Highest Poverty Level Among Families in New Hampshire are:
#1
33.8%
#2
32.7%
#3
31.7%
#4
24.9%
#5
16.2%
#6
15.9%
#7
15.1%
#8
12.9%
#9
12.2%
#10
12.0%
What city has the Highest Poverty Level Among Families in New Hampshire?
Enfield has the Highest Poverty Level Among Families in New Hampshire with 33.8%.
What is the Poverty Level Among Families in the State of New Hampshire?
Poverty Level Among Families in New Hampshire is 4.4%.
What is the Poverty Level Among Families in the United States?
Poverty Level Among Families in the United States is 8.8%.