Cities with the Highest Poverty Level Among Families in Kentucky
RELATED REPORTS & OPTIONS
Highest Family Poverty
Kentucky
Compare Cities
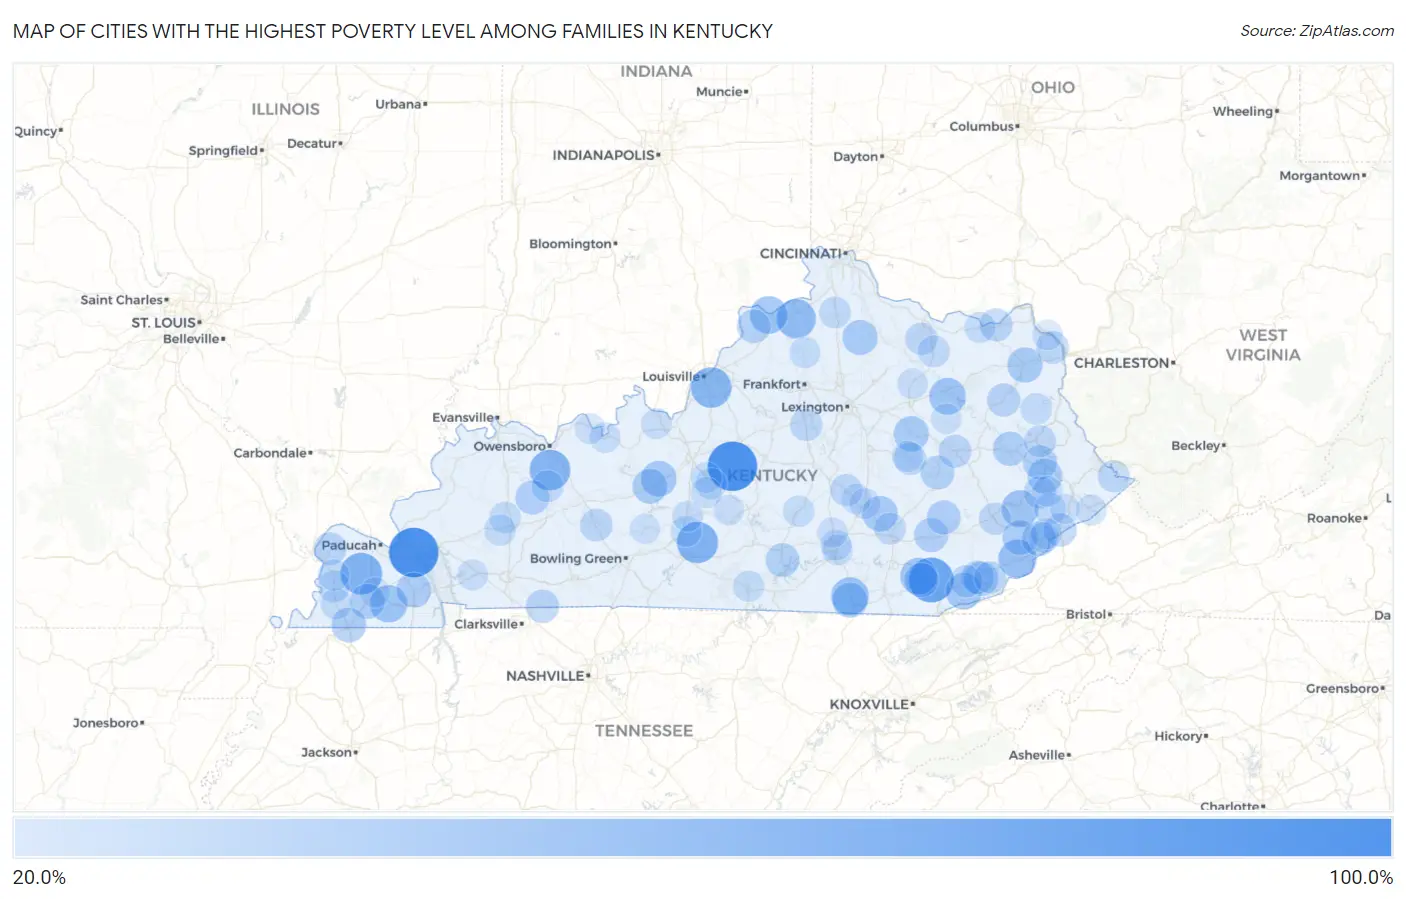
Map of Cities with the Highest Poverty Level Among Families in Kentucky
0.0%
100.0%
Cities with the Highest Poverty Level Among Families in Kentucky
| City | Family Poverty | vs State | vs National | |
| 1. | Gilbertsville | 100.0% | 11.7%(+88.3)#1 | 8.8%(+91.2)#16 |
| 2. | New Hope | 100.0% | 11.7%(+88.3)#2 | 8.8%(+91.2)#100 |
| 3. | Flat Lick | 80.8% | 11.7%(+69.1)#3 | 8.8%(+72.0)#165 |
| 4. | Lowes | 68.9% | 11.7%(+57.2)#4 | 8.8%(+60.1)#251 |
| 5. | Hiseville | 66.7% | 11.7%(+54.9)#5 | 8.8%(+57.9)#273 |
| 6. | Utica | 64.3% | 11.7%(+52.6)#6 | 8.8%(+55.5)#311 |
| 7. | Poplar Hills | 63.6% | 11.7%(+51.9)#7 | 8.8%(+54.9)#328 |
| 8. | Sanders | 58.7% | 11.7%(+46.9)#8 | 8.8%(+49.9)#410 |
| 9. | Cumberland | 54.6% | 11.7%(+42.9)#9 | 8.8%(+45.8)#509 |
| 10. | Whitley City | 52.7% | 11.7%(+41.0)#10 | 8.8%(+43.9)#562 |
| 11. | Prestonville | 52.2% | 11.7%(+40.4)#11 | 8.8%(+43.4)#581 |
| 12. | Farmington | 51.4% | 11.7%(+39.6)#12 | 8.8%(+42.6)#609 |
| 13. | Hindman | 50.3% | 11.7%(+38.5)#13 | 8.8%(+41.5)#637 |
| 14. | Barbourville | 50.0% | 11.7%(+38.3)#14 | 8.8%(+41.2)#639 |
| 15. | Salt Lick | 49.0% | 11.7%(+37.3)#15 | 8.8%(+40.2)#707 |
| 16. | Van Lear | 48.1% | 11.7%(+36.4)#16 | 8.8%(+39.4)#739 |
| 17. | Pathfork | 47.3% | 11.7%(+35.5)#17 | 8.8%(+38.5)#790 |
| 18. | Big Clifty | 45.0% | 11.7%(+33.3)#18 | 8.8%(+36.2)#879 |
| 19. | Livingston | 44.4% | 11.7%(+32.7)#19 | 8.8%(+35.7)#904 |
| 20. | Clay City | 43.5% | 11.7%(+31.8)#20 | 8.8%(+34.7)#959 |
| 21. | Grayson | 43.3% | 11.7%(+31.6)#21 | 8.8%(+34.5)#972 |
| 22. | Berry | 43.2% | 11.7%(+31.5)#22 | 8.8%(+34.4)#982 |
| 23. | Stearns | 42.9% | 11.7%(+31.2)#23 | 8.8%(+34.1)#998 |
| 24. | Pryorsburg | 42.3% | 11.7%(+30.6)#24 | 8.8%(+33.5)#1,037 |
| 25. | Blackey | 42.3% | 11.7%(+30.6)#25 | 8.8%(+33.5)#1,039 |
| 26. | Martin | 42.2% | 11.7%(+30.4)#26 | 8.8%(+33.4)#1,043 |
| 27. | Hardin | 42.1% | 11.7%(+30.4)#27 | 8.8%(+33.4)#1,045 |
| 28. | Clarkson | 41.9% | 11.7%(+30.1)#28 | 8.8%(+33.1)#1,063 |
| 29. | Fulton | 41.2% | 11.7%(+29.5)#29 | 8.8%(+32.4)#1,121 |
| 30. | Harlan | 40.6% | 11.7%(+28.8)#30 | 8.8%(+31.8)#1,167 |
| 31. | Salyersville | 39.9% | 11.7%(+28.2)#31 | 8.8%(+31.2)#1,221 |
| 32. | Whitesburg | 39.9% | 11.7%(+28.2)#32 | 8.8%(+31.1)#1,225 |
| 33. | Prestonsburg | 39.5% | 11.7%(+27.7)#33 | 8.8%(+30.7)#1,249 |
| 34. | Artemus | 39.3% | 11.7%(+27.5)#34 | 8.8%(+30.5)#1,266 |
| 35. | Manchester | 38.9% | 11.7%(+27.1)#35 | 8.8%(+30.1)#1,299 |
| 36. | Sacramento | 38.7% | 11.7%(+27.0)#36 | 8.8%(+30.0)#1,305 |
| 37. | Oneida | 38.6% | 11.7%(+26.9)#37 | 8.8%(+29.9)#1,312 |
| 38. | Beattyville | 38.0% | 11.7%(+26.3)#38 | 8.8%(+29.2)#1,350 |
| 39. | Jamestown | 37.4% | 11.7%(+25.7)#39 | 8.8%(+28.7)#1,395 |
| 40. | Bedford | 37.0% | 11.7%(+25.3)#40 | 8.8%(+28.2)#1,428 |
| 41. | Loyall | 36.1% | 11.7%(+24.4)#41 | 8.8%(+27.3)#1,497 |
| 42. | Sandy Hook | 36.0% | 11.7%(+24.2)#42 | 8.8%(+27.2)#1,508 |
| 43. | Jenkins | 35.7% | 11.7%(+24.0)#43 | 8.8%(+26.9)#1,531 |
| 44. | Guthrie | 35.4% | 11.7%(+23.7)#44 | 8.8%(+26.6)#1,563 |
| 45. | Campton | 34.5% | 11.7%(+22.8)#45 | 8.8%(+25.7)#1,656 |
| 46. | Barlow | 34.1% | 11.7%(+22.4)#46 | 8.8%(+25.3)#1,699 |
| 47. | Garrison | 34.0% | 11.7%(+22.3)#47 | 8.8%(+25.2)#1,708 |
| 48. | Morgantown | 33.5% | 11.7%(+21.7)#48 | 8.8%(+24.7)#1,760 |
| 49. | Ironville | 33.2% | 11.7%(+21.4)#49 | 8.8%(+24.4)#1,837 |
| 50. | Ravenna | 32.6% | 11.7%(+20.8)#50 | 8.8%(+23.8)#1,878 |
| 51. | Wayland | 32.4% | 11.7%(+20.7)#51 | 8.8%(+23.6)#1,897 |
| 52. | Salvisa | 31.9% | 11.7%(+20.2)#52 | 8.8%(+23.2)#1,936 |
| 53. | Mays Lick | 31.8% | 11.7%(+20.1)#53 | 8.8%(+23.0)#1,954 |
| 54. | Hazard | 31.7% | 11.7%(+20.0)#54 | 8.8%(+22.9)#1,979 |
| 55. | Coldiron | 31.5% | 11.7%(+19.8)#55 | 8.8%(+22.7)#1,998 |
| 56. | Ages | 31.4% | 11.7%(+19.7)#56 | 8.8%(+22.6)#2,018 |
| 57. | Crab Orchard | 31.1% | 11.7%(+19.3)#57 | 8.8%(+22.3)#2,061 |
| 58. | Paintsville | 31.0% | 11.7%(+19.3)#58 | 8.8%(+22.3)#2,065 |
| 59. | Freeburn | 31.0% | 11.7%(+19.3)#59 | 8.8%(+22.3)#2,068 |
| 60. | Arlington | 30.9% | 11.7%(+19.1)#60 | 8.8%(+22.1)#2,089 |
| 61. | Livermore | 30.8% | 11.7%(+19.1)#61 | 8.8%(+22.1)#2,095 |
| 62. | Flemingsburg | 30.8% | 11.7%(+19.1)#62 | 8.8%(+22.0)#2,099 |
| 63. | East Bernstadt | 30.4% | 11.7%(+18.6)#63 | 8.8%(+21.6)#2,164 |
| 64. | Wheelwright | 30.2% | 11.7%(+18.5)#64 | 8.8%(+21.5)#2,185 |
| 65. | Dry Ridge | 29.9% | 11.7%(+18.2)#65 | 8.8%(+21.1)#2,259 |
| 66. | Blaine | 29.4% | 11.7%(+17.7)#66 | 8.8%(+20.6)#2,326 |
| 67. | Clinton | 29.0% | 11.7%(+17.2)#67 | 8.8%(+20.2)#2,385 |
| 68. | Bardwell | 28.9% | 11.7%(+17.2)#68 | 8.8%(+20.1)#2,400 |
| 69. | Earlington | 28.6% | 11.7%(+16.9)#69 | 8.8%(+19.8)#2,446 |
| 70. | St Charles | 28.6% | 11.7%(+16.8)#70 | 8.8%(+19.8)#2,456 |
| 71. | Liberty | 28.3% | 11.7%(+16.6)#71 | 8.8%(+19.5)#2,510 |
| 72. | Horse Cave | 28.2% | 11.7%(+16.4)#72 | 8.8%(+19.4)#2,536 |
| 73. | Burkesville | 28.1% | 11.7%(+16.4)#73 | 8.8%(+19.3)#2,550 |
| 74. | Irvine | 28.0% | 11.7%(+16.2)#74 | 8.8%(+19.2)#2,574 |
| 75. | Buffalo | 27.9% | 11.7%(+16.2)#75 | 8.8%(+19.2)#2,578 |
| 76. | Vanceburg | 27.3% | 11.7%(+15.6)#76 | 8.8%(+18.5)#2,700 |
| 77. | Hodgenville | 27.3% | 11.7%(+15.6)#77 | 8.8%(+18.5)#2,704 |
| 78. | Monterey | 27.3% | 11.7%(+15.5)#78 | 8.8%(+18.5)#2,720 |
| 79. | Magnolia | 27.2% | 11.7%(+15.5)#79 | 8.8%(+18.4)#2,732 |
| 80. | Millstone | 27.1% | 11.7%(+15.3)#80 | 8.8%(+18.3)#2,754 |
| 81. | Munfordville | 26.7% | 11.7%(+15.0)#81 | 8.8%(+17.9)#2,824 |
| 82. | Cadiz | 26.7% | 11.7%(+15.0)#82 | 8.8%(+17.9)#2,829 |
| 83. | Elkhorn City | 26.6% | 11.7%(+14.9)#83 | 8.8%(+17.8)#2,847 |
| 84. | Ekron | 26.5% | 11.7%(+14.8)#84 | 8.8%(+17.7)#2,867 |
| 85. | Mount Vernon | 26.4% | 11.7%(+14.7)#85 | 8.8%(+17.6)#2,890 |
| 86. | Sharpsburg | 26.4% | 11.7%(+14.6)#86 | 8.8%(+17.6)#2,906 |
| 87. | Ferguson | 26.2% | 11.7%(+14.5)#87 | 8.8%(+17.4)#2,944 |
| 88. | Somerset | 26.1% | 11.7%(+14.3)#88 | 8.8%(+17.3)#2,976 |
| 89. | Cloverport | 26.0% | 11.7%(+14.3)#89 | 8.8%(+17.2)#2,986 |
| 90. | Mayking | 25.8% | 11.7%(+14.1)#90 | 8.8%(+17.0)#3,049 |
| 91. | Mcdowell | 25.7% | 11.7%(+14.0)#91 | 8.8%(+17.0)#3,051 |
| 92. | Summersville | 25.6% | 11.7%(+13.8)#92 | 8.8%(+16.8)#3,096 |
| 93. | Raceland | 25.4% | 11.7%(+13.6)#93 | 8.8%(+16.6)#3,145 |
| 94. | Hawesville | 25.4% | 11.7%(+13.6)#94 | 8.8%(+16.6)#3,146 |
| 95. | Science Hill | 25.3% | 11.7%(+13.6)#95 | 8.8%(+16.5)#3,162 |
| 96. | Frenchburg | 25.0% | 11.7%(+13.3)#96 | 8.8%(+16.2)#3,207 |
| 97. | Brownsville | 24.5% | 11.7%(+12.8)#97 | 8.8%(+15.7)#3,368 |
| 98. | Brodhead | 24.4% | 11.7%(+12.7)#98 | 8.8%(+15.6)#3,383 |
| 99. | Mayfield | 24.3% | 11.7%(+12.6)#99 | 8.8%(+15.5)#3,418 |
| 100. | Virgie | 24.0% | 11.7%(+12.3)#100 | 8.8%(+15.2)#3,486 |
Common Questions
What are the Top 10 Cities with the Highest Poverty Level Among Families in Kentucky?
Top 10 Cities with the Highest Poverty Level Among Families in Kentucky are:
#1
100.0%
#2
100.0%
#3
80.8%
#4
68.9%
#5
66.7%
#6
64.3%
#7
63.6%
#8
58.7%
#9
54.6%
#10
52.7%
What city has the Highest Poverty Level Among Families in Kentucky?
Gilbertsville has the Highest Poverty Level Among Families in Kentucky with 100.0%.
What is the Poverty Level Among Families in the State of Kentucky?
Poverty Level Among Families in Kentucky is 11.7%.
What is the Poverty Level Among Families in the United States?
Poverty Level Among Families in the United States is 8.8%.