Cities with the Highest Poverty Level Among Families in Massachusetts
RELATED REPORTS & OPTIONS
Highest Family Poverty
Massachusetts
Compare Cities
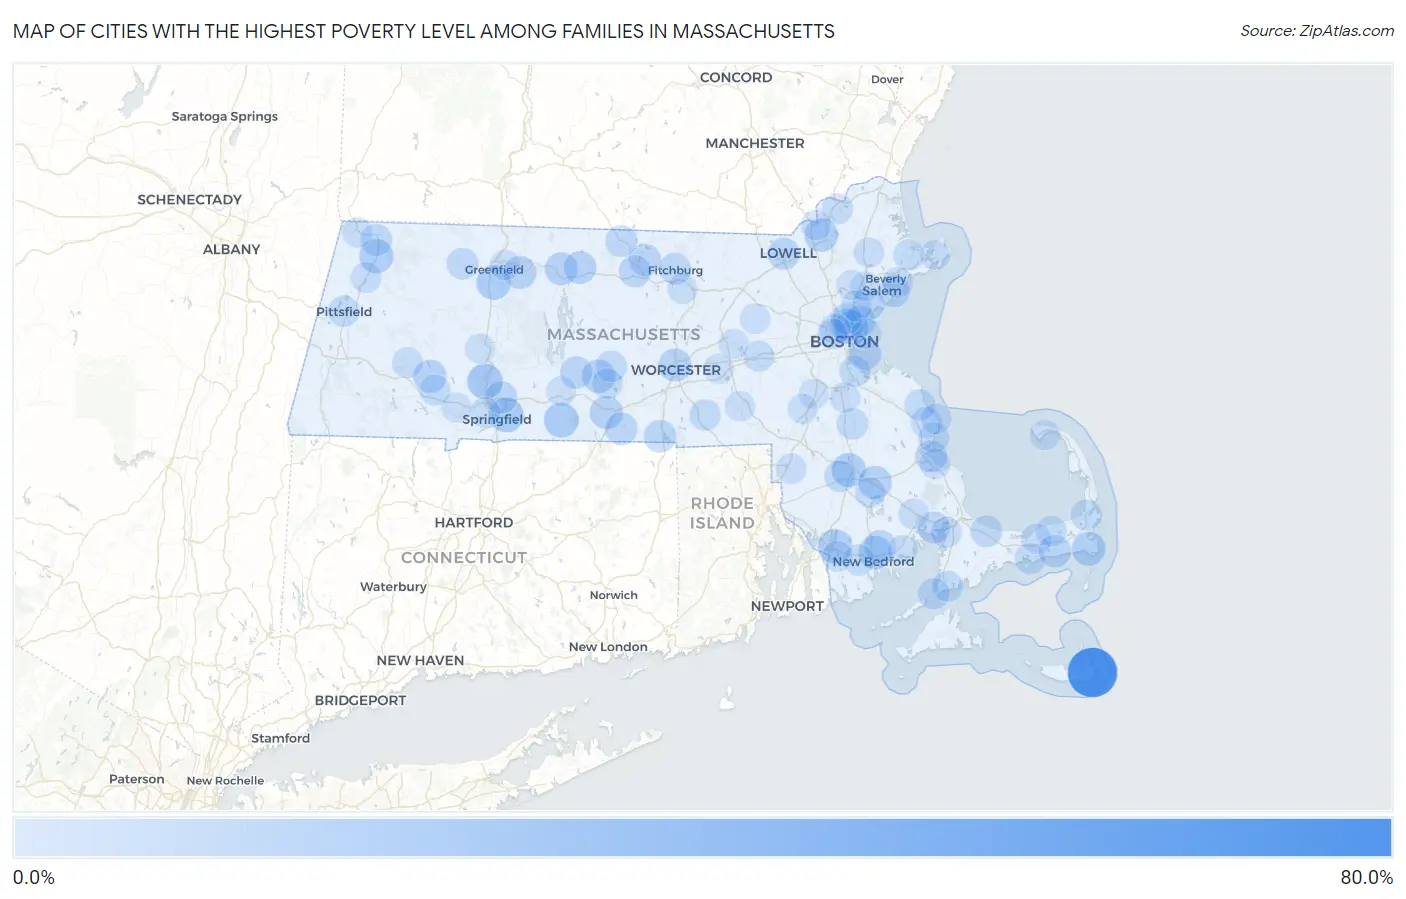
Map of Cities with the Highest Poverty Level Among Families in Massachusetts
0.0%
80.0%
Cities with the Highest Poverty Level Among Families in Massachusetts
| City | Family Poverty | vs State | vs National | |
| 1. | Siasconset | 66.7% | 6.5%(+60.1)#1 | 8.8%(+57.9)#272 |
| 2. | Holyoke | 21.3% | 6.5%(+14.8)#2 | 8.8%(+12.5)#4,320 |
| 3. | Springfield | 19.5% | 6.5%(+12.9)#3 | 8.8%(+10.7)#5,075 |
| 4. | Monson Center | 19.3% | 6.5%(+12.8)#4 | 8.8%(+10.6)#5,120 |
| 5. | Deerfield | 18.7% | 6.5%(+12.2)#5 | 8.8%(+9.92)#5,408 |
| 6. | Adams | 17.7% | 6.5%(+11.2)#6 | 8.8%(+8.92)#5,908 |
| 7. | Fall River | 17.6% | 6.5%(+11.1)#7 | 8.8%(+8.83)#5,957 |
| 8. | Chelsea | 17.3% | 6.5%(+10.8)#8 | 8.8%(+8.54)#6,116 |
| 9. | Raynham Center | 17.3% | 6.5%(+10.8)#9 | 8.8%(+8.51)#6,126 |
| 10. | West Chatham | 16.8% | 6.5%(+10.3)#10 | 8.8%(+8.00)#6,381 |
| 11. | Lawrence | 16.2% | 6.5%(+9.65)#11 | 8.8%(+7.39)#6,737 |
| 12. | New Bedford | 15.7% | 6.5%(+9.16)#12 | 8.8%(+6.90)#7,012 |
| 13. | West Brookfield | 15.4% | 6.5%(+8.89)#13 | 8.8%(+6.63)#7,181 |
| 14. | Middleborough Center | 15.4% | 6.5%(+8.86)#14 | 8.8%(+6.60)#7,185 |
| 15. | Fiskdale | 14.3% | 6.5%(+7.78)#15 | 8.8%(+5.52)#7,916 |
| 16. | Huntington | 14.2% | 6.5%(+7.70)#16 | 8.8%(+5.44)#8,036 |
| 17. | Orange | 14.0% | 6.5%(+7.49)#17 | 8.8%(+5.23)#8,187 |
| 18. | Worcester | 14.0% | 6.5%(+7.45)#18 | 8.8%(+5.19)#8,212 |
| 19. | Millers Falls | 13.4% | 6.5%(+6.87)#19 | 8.8%(+4.61)#8,635 |
| 20. | Everett | 13.4% | 6.5%(+6.84)#20 | 8.8%(+4.58)#8,661 |
| 21. | Athol | 13.1% | 6.5%(+6.54)#21 | 8.8%(+4.28)#8,905 |
| 22. | Southbridge Town | 12.7% | 6.5%(+6.14)#22 | 8.8%(+3.88)#9,230 |
| 23. | Webster | 12.7% | 6.5%(+6.13)#23 | 8.8%(+3.87)#9,236 |
| 24. | Dennis Port | 12.6% | 6.5%(+6.04)#24 | 8.8%(+3.78)#9,298 |
| 25. | Ware | 12.3% | 6.5%(+5.77)#25 | 8.8%(+3.51)#9,540 |
| 26. | Boston | 12.2% | 6.5%(+5.69)#26 | 8.8%(+3.43)#9,609 |
| 27. | South Ashburnham | 11.7% | 6.5%(+5.18)#27 | 8.8%(+2.92)#10,076 |
| 28. | North Plymouth | 11.7% | 6.5%(+5.15)#28 | 8.8%(+2.89)#10,097 |
| 29. | Gardner | 11.7% | 6.5%(+5.14)#29 | 8.8%(+2.88)#10,109 |
| 30. | Acushnet Center | 11.6% | 6.5%(+5.07)#30 | 8.8%(+2.81)#10,163 |
| 31. | Chicopee | 11.5% | 6.5%(+5.00)#31 | 8.8%(+2.74)#10,241 |
| 32. | Onset | 11.3% | 6.5%(+4.76)#32 | 8.8%(+2.50)#10,495 |
| 33. | Lowell | 11.1% | 6.5%(+4.60)#33 | 8.8%(+2.34)#10,604 |
| 34. | Salem | 11.1% | 6.5%(+4.59)#34 | 8.8%(+2.33)#10,673 |
| 35. | Lynn | 10.9% | 6.5%(+4.42)#35 | 8.8%(+2.16)#10,801 |
| 36. | North Adams | 10.8% | 6.5%(+4.23)#36 | 8.8%(+1.97)#10,977 |
| 37. | East Sandwich | 10.7% | 6.5%(+4.16)#37 | 8.8%(+1.90)#11,043 |
| 38. | Winchendon | 10.4% | 6.5%(+3.91)#38 | 8.8%(+1.65)#11,320 |
| 39. | Fitchburg | 10.3% | 6.5%(+3.78)#39 | 8.8%(+1.52)#11,452 |
| 40. | Oak Bluffs | 10.0% | 6.5%(+3.48)#40 | 8.8%(+1.22)#11,737 |
| 41. | Shelburne Falls | 9.9% | 6.5%(+3.41)#41 | 8.8%(+1.15)#11,852 |
| 42. | Revere | 9.8% | 6.5%(+3.29)#42 | 8.8%(+1.03)#11,990 |
| 43. | Brockton | 9.7% | 6.5%(+3.17)#43 | 8.8%(+0.905)#12,141 |
| 44. | Greenfield | 9.7% | 6.5%(+3.13)#44 | 8.8%(+0.871)#12,197 |
| 45. | Woods Hole | 9.5% | 6.5%(+3.00)#45 | 8.8%(+0.742)#12,313 |
| 46. | North Brookfield | 9.5% | 6.5%(+2.94)#46 | 8.8%(+0.678)#12,404 |
| 47. | Taunton | 9.3% | 6.5%(+2.82)#47 | 8.8%(+0.560)#12,522 |
| 48. | Pittsfield | 9.1% | 6.5%(+2.54)#48 | 8.8%(+0.276)#12,858 |
| 49. | Whitinsville | 8.9% | 6.5%(+2.37)#49 | 8.8%(+0.105)#13,036 |
| 50. | Quincy | 8.9% | 6.5%(+2.35)#50 | 8.8%(+0.093)#13,042 |
| 51. | Marshfield | 8.7% | 6.5%(+2.15)#51 | 8.8%(-0.107)#13,283 |
| 52. | Marshfield Hills | 8.7% | 6.5%(+2.15)#52 | 8.8%(-0.115)#13,292 |
| 53. | Falmouth | 8.6% | 6.5%(+2.05)#53 | 8.8%(-0.207)#13,388 |
| 54. | Essex | 8.5% | 6.5%(+2.00)#54 | 8.8%(-0.262)#13,453 |
| 55. | Smith Mills | 8.4% | 6.5%(+1.90)#55 | 8.8%(-0.360)#13,569 |
| 56. | Orleans | 8.4% | 6.5%(+1.83)#56 | 8.8%(-0.427)#13,658 |
| 57. | Malden | 8.3% | 6.5%(+1.82)#57 | 8.8%(-0.436)#13,676 |
| 58. | West Yarmouth | 8.3% | 6.5%(+1.74)#58 | 8.8%(-0.517)#13,822 |
| 59. | Russell | 8.2% | 6.5%(+1.64)#59 | 8.8%(-0.618)#13,963 |
| 60. | Framingham | 7.9% | 6.5%(+1.42)#60 | 8.8%(-0.839)#14,229 |
| 61. | East Dennis | 7.9% | 6.5%(+1.34)#61 | 8.8%(-0.924)#14,346 |
| 62. | Saugus | 7.9% | 6.5%(+1.33)#62 | 8.8%(-0.926)#14,350 |
| 63. | Haverhill | 7.7% | 6.5%(+1.20)#63 | 8.8%(-1.06)#14,524 |
| 64. | Beverly | 7.6% | 6.5%(+1.09)#64 | 8.8%(-1.17)#14,677 |
| 65. | Duxbury | 7.5% | 6.5%(+0.944)#65 | 8.8%(-1.32)#14,858 |
| 66. | Brookfield | 7.4% | 6.5%(+0.865)#66 | 8.8%(-1.40)#14,966 |
| 67. | Bourne | 7.4% | 6.5%(+0.834)#67 | 8.8%(-1.43)#15,005 |
| 68. | Chester | 7.3% | 6.5%(+0.808)#68 | 8.8%(-1.45)#15,050 |
| 69. | West Springfield Town | 7.3% | 6.5%(+0.765)#69 | 8.8%(-1.50)#15,118 |
| 70. | West Wareham | 7.3% | 6.5%(+0.749)#70 | 8.8%(-1.51)#15,142 |
| 71. | Cheshire | 7.1% | 6.5%(+0.621)#71 | 8.8%(-1.64)#15,286 |
| 72. | Ocean Bluff Brant Rock | 7.1% | 6.5%(+0.552)#72 | 8.8%(-1.71)#15,416 |
| 73. | Plymouth | 6.7% | 6.5%(+0.214)#73 | 8.8%(-2.05)#15,837 |
| 74. | Attleboro | 6.7% | 6.5%(+0.193)#74 | 8.8%(-2.07)#15,861 |
| 75. | North Westport | 6.7% | 6.5%(+0.145)#75 | 8.8%(-2.12)#15,905 |
| 76. | Winthrop Town | 6.6% | 6.5%(+0.104)#76 | 8.8%(-2.16)#15,988 |
| 77. | Somerville | 6.6% | 6.5%(+0.044)#77 | 8.8%(-2.22)#16,057 |
| 78. | Maynard | 6.5% | 6.5%(-0.045)#78 | 8.8%(-2.31)#16,192 |
| 79. | Randolph Town | 6.5% | 6.5%(-0.062)#79 | 8.8%(-2.32)#16,212 |
| 80. | Cambridge | 6.3% | 6.5%(-0.212)#80 | 8.8%(-2.47)#16,424 |
| 81. | Turners Falls | 6.3% | 6.5%(-0.252)#81 | 8.8%(-2.51)#16,484 |
| 82. | North Lakeville | 6.2% | 6.5%(-0.278)#82 | 8.8%(-2.54)#16,579 |
| 83. | Methuen Town | 6.2% | 6.5%(-0.335)#83 | 8.8%(-2.60)#16,648 |
| 84. | Topsfield | 6.2% | 6.5%(-0.356)#84 | 8.8%(-2.62)#16,685 |
| 85. | Milford | 6.2% | 6.5%(-0.371)#85 | 8.8%(-2.63)#16,707 |
| 86. | Williamstown | 6.1% | 6.5%(-0.375)#86 | 8.8%(-2.64)#16,715 |
| 87. | Provincetown | 6.1% | 6.5%(-0.386)#87 | 8.8%(-2.65)#16,733 |
| 88. | Leominster | 6.0% | 6.5%(-0.503)#88 | 8.8%(-2.76)#16,904 |
| 89. | Yarmouth Port | 5.9% | 6.5%(-0.636)#89 | 8.8%(-2.90)#17,073 |
| 90. | Gloucester | 5.9% | 6.5%(-0.665)#90 | 8.8%(-2.93)#17,141 |
| 91. | Norwood | 5.7% | 6.5%(-0.850)#91 | 8.8%(-3.11)#17,425 |
| 92. | Marlborough | 5.7% | 6.5%(-0.862)#92 | 8.8%(-3.12)#17,454 |
| 93. | Lynnfield | 5.6% | 6.5%(-0.966)#93 | 8.8%(-3.23)#17,580 |
| 94. | Westborough | 5.5% | 6.5%(-0.985)#94 | 8.8%(-3.24)#17,638 |
| 95. | Westfield | 5.5% | 6.5%(-1.04)#95 | 8.8%(-3.30)#17,692 |
| 96. | Peabody | 5.4% | 6.5%(-1.15)#96 | 8.8%(-3.41)#17,887 |
| 97. | Mattapoisett Center | 5.3% | 6.5%(-1.27)#97 | 8.8%(-3.53)#18,078 |
| 98. | Walpole | 5.2% | 6.5%(-1.28)#98 | 8.8%(-3.54)#18,103 |
| 99. | Northampton | 5.2% | 6.5%(-1.29)#99 | 8.8%(-3.55)#18,113 |
| 100. | Palmer Town | 5.2% | 6.5%(-1.30)#100 | 8.8%(-3.56)#18,128 |
Common Questions
What are the Top 10 Cities with the Highest Poverty Level Among Families in Massachusetts?
Top 10 Cities with the Highest Poverty Level Among Families in Massachusetts are:
#1
66.7%
#2
21.3%
#3
19.5%
#4
19.3%
#5
18.7%
#6
17.7%
#7
17.6%
#8
17.3%
#9
17.3%
#10
16.8%
What city has the Highest Poverty Level Among Families in Massachusetts?
Siasconset has the Highest Poverty Level Among Families in Massachusetts with 66.7%.
What is the Poverty Level Among Families in the State of Massachusetts?
Poverty Level Among Families in Massachusetts is 6.5%.
What is the Poverty Level Among Families in the United States?
Poverty Level Among Families in the United States is 8.8%.