Cities with the Highest Poverty Level Among Families in Virginia
RELATED REPORTS & OPTIONS
Highest Family Poverty
Virginia
Compare Cities
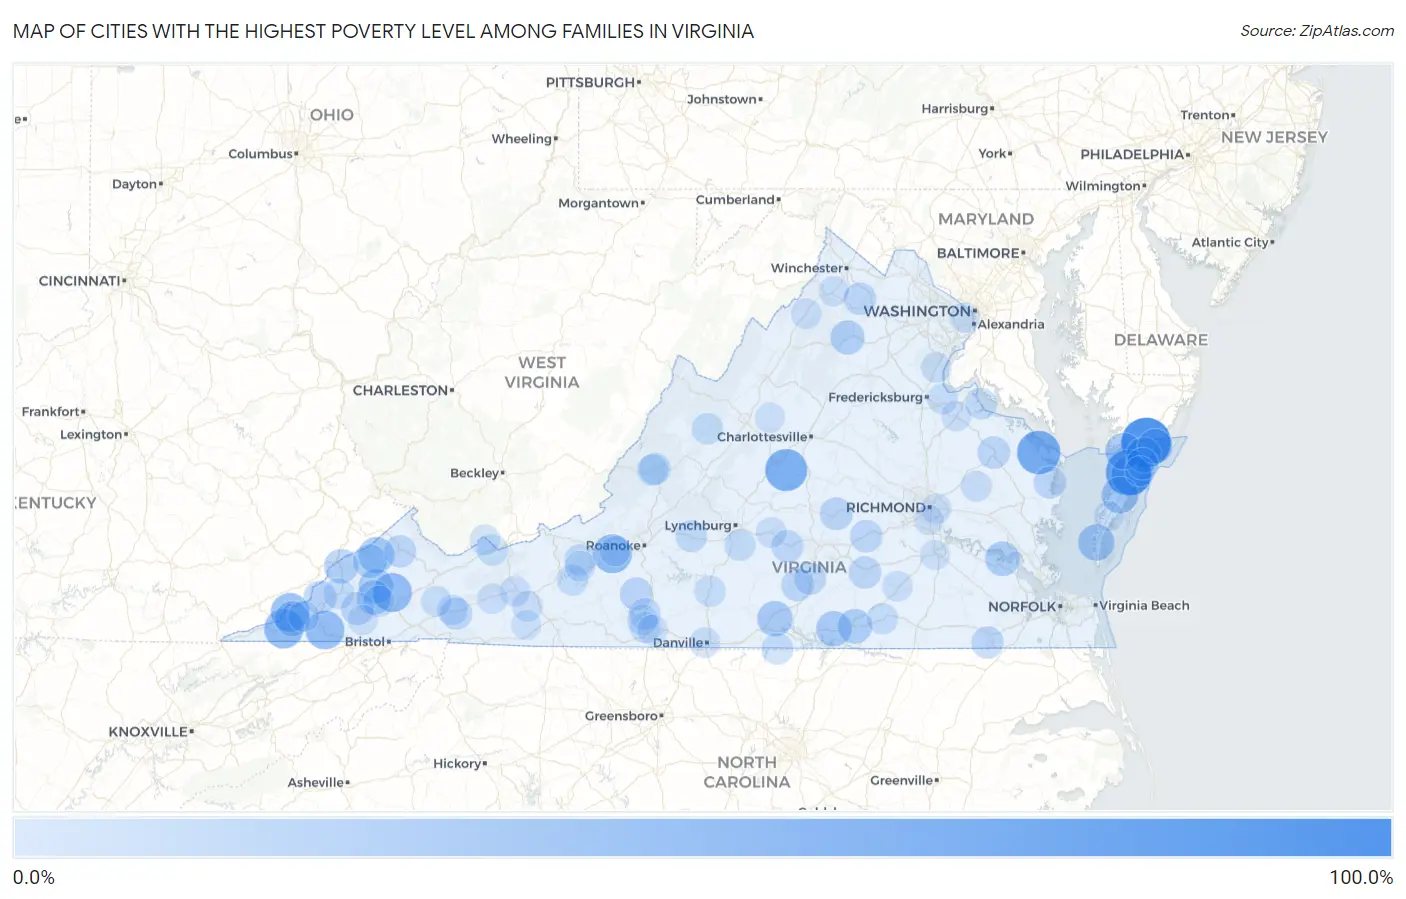
Map of Cities with the Highest Poverty Level Among Families in Virginia
0.0%
100.0%
Cities with the Highest Poverty Level Among Families in Virginia
| City | Family Poverty | vs State | vs National | |
| 1. | New Church | 91.7% | 6.8%(+84.9)#1 | 8.8%(+82.9)#129 |
| 2. | Barboursville | 87.1% | 6.8%(+80.3)#2 | 8.8%(+78.3)#142 |
| 3. | Lee Mont | 77.4% | 6.8%(+70.6)#3 | 8.8%(+68.6)#182 |
| 4. | Heathsville | 67.6% | 6.8%(+60.8)#4 | 8.8%(+58.8)#259 |
| 5. | Schuyler | 62.7% | 6.8%(+55.9)#5 | 8.8%(+53.9)#345 |
| 6. | Chase Crossing | 56.3% | 6.8%(+49.5)#6 | 8.8%(+47.5)#463 |
| 7. | Jonesville | 52.0% | 6.8%(+45.2)#7 | 8.8%(+43.2)#590 |
| 8. | Elliston | 51.7% | 6.8%(+44.9)#8 | 8.8%(+42.9)#599 |
| 9. | Cleveland | 50.9% | 6.8%(+44.1)#9 | 8.8%(+42.1)#624 |
| 10. | Clinchport | 50.0% | 6.8%(+43.2)#10 | 8.8%(+41.2)#665 |
| 11. | St Charles | 50.0% | 6.8%(+43.2)#11 | 8.8%(+41.2)#666 |
| 12. | Stevens Creek | 45.0% | 6.8%(+38.2)#12 | 8.8%(+36.2)#881 |
| 13. | Millboro | 44.4% | 6.8%(+37.6)#13 | 8.8%(+35.7)#907 |
| 14. | Keller | 43.1% | 6.8%(+36.3)#14 | 8.8%(+34.3)#989 |
| 15. | Saxis | 42.5% | 6.8%(+35.7)#15 | 8.8%(+33.7)#1,030 |
| 16. | Cheriton | 41.5% | 6.8%(+34.7)#16 | 8.8%(+32.7)#1,099 |
| 17. | Falls Mills | 40.5% | 6.8%(+33.7)#17 | 8.8%(+31.7)#1,174 |
| 18. | Cliftondale Park | 40.4% | 6.8%(+33.6)#18 | 8.8%(+31.6)#1,180 |
| 19. | Haysi | 39.7% | 6.8%(+32.9)#19 | 8.8%(+30.9)#1,233 |
| 20. | Moneta | 38.4% | 6.8%(+31.6)#20 | 8.8%(+29.6)#1,330 |
| 21. | Pennington Gap | 37.9% | 6.8%(+31.1)#21 | 8.8%(+29.1)#1,358 |
| 22. | Scottsburg | 37.8% | 6.8%(+31.0)#22 | 8.8%(+29.1)#1,364 |
| 23. | Baskerville | 37.7% | 6.8%(+30.9)#23 | 8.8%(+28.9)#1,369 |
| 24. | Temperanceville | 37.0% | 6.8%(+30.2)#24 | 8.8%(+28.2)#1,429 |
| 25. | Osaka | 36.4% | 6.8%(+29.6)#25 | 8.8%(+27.6)#1,477 |
| 26. | Horntown | 35.8% | 6.8%(+29.0)#26 | 8.8%(+27.0)#1,522 |
| 27. | Eagle Rock | 35.7% | 6.8%(+28.9)#27 | 8.8%(+26.9)#1,536 |
| 28. | Dante | 35.6% | 6.8%(+28.8)#28 | 8.8%(+26.8)#1,550 |
| 29. | Scotland | 35.3% | 6.8%(+28.5)#29 | 8.8%(+26.5)#1,583 |
| 30. | La Crosse | 35.0% | 6.8%(+28.2)#30 | 8.8%(+26.2)#1,612 |
| 31. | St Paul | 34.8% | 6.8%(+28.0)#31 | 8.8%(+26.1)#1,621 |
| 32. | Pound | 34.7% | 6.8%(+27.9)#32 | 8.8%(+25.9)#1,635 |
| 33. | Washington | 33.3% | 6.8%(+26.5)#33 | 8.8%(+24.6)#1,819 |
| 34. | Clinchco | 32.5% | 6.8%(+25.7)#34 | 8.8%(+23.7)#1,892 |
| 35. | Allison Gap | 32.1% | 6.8%(+25.3)#35 | 8.8%(+23.3)#1,922 |
| 36. | Appalachia | 30.0% | 6.8%(+23.2)#36 | 8.8%(+21.2)#2,245 |
| 37. | Big Rock | 29.1% | 6.8%(+22.3)#37 | 8.8%(+20.3)#2,370 |
| 38. | Cumberland | 28.7% | 6.8%(+21.9)#38 | 8.8%(+19.9)#2,432 |
| 39. | Dungannon | 28.3% | 6.8%(+21.5)#39 | 8.8%(+19.6)#2,505 |
| 40. | Ferrum | 28.2% | 6.8%(+21.4)#40 | 8.8%(+19.4)#2,524 |
| 41. | Amelia Court House | 27.6% | 6.8%(+20.8)#41 | 8.8%(+18.8)#2,646 |
| 42. | Blackstone | 27.4% | 6.8%(+20.6)#42 | 8.8%(+18.7)#2,680 |
| 43. | Tappahannock | 27.3% | 6.8%(+20.6)#43 | 8.8%(+18.6)#2,697 |
| 44. | Drakes Branch | 27.3% | 6.8%(+20.5)#44 | 8.8%(+18.6)#2,698 |
| 45. | Shenandoah Farms | 27.2% | 6.8%(+20.4)#45 | 8.8%(+18.4)#2,731 |
| 46. | Vansant | 26.7% | 6.8%(+19.9)#46 | 8.8%(+17.9)#2,834 |
| 47. | Southampton Meadows | 26.6% | 6.8%(+19.8)#47 | 8.8%(+17.8)#2,852 |
| 48. | Kilmarnock | 26.5% | 6.8%(+19.7)#48 | 8.8%(+17.7)#2,875 |
| 49. | Pamplin City | 26.3% | 6.8%(+19.5)#49 | 8.8%(+17.5)#2,923 |
| 50. | Keysville | 25.8% | 6.8%(+19.0)#50 | 8.8%(+17.0)#3,047 |
| 51. | Adwolf | 25.7% | 6.8%(+18.9)#51 | 8.8%(+16.9)#3,058 |
| 52. | Selma | 24.8% | 6.8%(+18.0)#52 | 8.8%(+16.0)#3,297 |
| 53. | Mappsville | 24.7% | 6.8%(+17.9)#53 | 8.8%(+15.9)#3,311 |
| 54. | Bedford | 24.6% | 6.8%(+17.8)#54 | 8.8%(+15.8)#3,334 |
| 55. | Virgilina | 24.1% | 6.8%(+17.3)#55 | 8.8%(+15.4)#3,462 |
| 56. | Oak Level | 24.0% | 6.8%(+17.2)#56 | 8.8%(+15.2)#3,492 |
| 57. | Belview | 23.9% | 6.8%(+17.1)#57 | 8.8%(+15.1)#3,517 |
| 58. | Colonial Beach | 23.7% | 6.8%(+17.0)#58 | 8.8%(+15.0)#3,565 |
| 59. | Rustburg | 23.6% | 6.8%(+16.9)#59 | 8.8%(+14.9)#3,593 |
| 60. | Low Moor | 23.4% | 6.8%(+16.6)#60 | 8.8%(+14.6)#3,650 |
| 61. | Craigsville | 23.2% | 6.8%(+16.4)#61 | 8.8%(+14.4)#3,712 |
| 62. | Castlewood | 23.1% | 6.8%(+16.3)#62 | 8.8%(+14.3)#3,754 |
| 63. | Snowville | 22.9% | 6.8%(+16.1)#63 | 8.8%(+14.1)#3,801 |
| 64. | Gretna | 22.8% | 6.8%(+16.0)#64 | 8.8%(+14.0)#3,818 |
| 65. | Lawrenceville | 22.7% | 6.8%(+15.9)#65 | 8.8%(+13.9)#3,850 |
| 66. | Fieldale | 22.4% | 6.8%(+15.6)#66 | 8.8%(+13.6)#3,948 |
| 67. | Bluefield | 22.3% | 6.8%(+15.5)#67 | 8.8%(+13.5)#3,971 |
| 68. | Norton | 22.3% | 6.8%(+15.5)#68 | 8.8%(+13.5)#3,980 |
| 69. | Dryden | 22.2% | 6.8%(+15.4)#69 | 8.8%(+13.4)#3,987 |
| 70. | Stanleytown | 21.7% | 6.8%(+14.9)#70 | 8.8%(+12.9)#4,200 |
| 71. | Pocahontas | 21.6% | 6.8%(+14.8)#71 | 8.8%(+12.8)#4,224 |
| 72. | Passapatanzy | 21.5% | 6.8%(+14.7)#72 | 8.8%(+12.7)#4,267 |
| 73. | Appomattox | 21.3% | 6.8%(+14.5)#73 | 8.8%(+12.5)#4,342 |
| 74. | King William | 21.2% | 6.8%(+14.4)#74 | 8.8%(+12.4)#4,361 |
| 75. | Seven Mile Ford | 21.2% | 6.8%(+14.4)#75 | 8.8%(+12.4)#4,377 |
| 76. | Ivanhoe | 21.0% | 6.8%(+14.2)#76 | 8.8%(+12.2)#4,439 |
| 77. | Saltville | 20.9% | 6.8%(+14.1)#77 | 8.8%(+12.1)#4,470 |
| 78. | Boswell S Corner | 20.9% | 6.8%(+14.1)#78 | 8.8%(+12.1)#4,477 |
| 79. | Danville | 20.6% | 6.8%(+13.8)#79 | 8.8%(+11.8)#4,593 |
| 80. | Plum Creek | 20.5% | 6.8%(+13.7)#80 | 8.8%(+11.7)#4,623 |
| 81. | Martinsville | 20.4% | 6.8%(+13.6)#81 | 8.8%(+11.6)#4,665 |
| 82. | Wytheville | 20.4% | 6.8%(+13.6)#82 | 8.8%(+11.6)#4,674 |
| 83. | Woodstock | 20.4% | 6.8%(+13.6)#83 | 8.8%(+11.6)#4,679 |
| 84. | Montrose | 20.3% | 6.8%(+13.5)#84 | 8.8%(+11.5)#4,732 |
| 85. | Middletown | 20.2% | 6.8%(+13.4)#85 | 8.8%(+11.4)#4,749 |
| 86. | Mckenney | 20.2% | 6.8%(+13.4)#86 | 8.8%(+11.4)#4,766 |
| 87. | Rural Retreat | 20.1% | 6.8%(+13.3)#87 | 8.8%(+11.3)#4,790 |
| 88. | Bailey S Crossroads | 19.9% | 6.8%(+13.1)#88 | 8.8%(+11.1)#4,914 |
| 89. | Port Royal | 19.5% | 6.8%(+12.7)#89 | 8.8%(+10.7)#5,055 |
| 90. | Lafayette | 19.5% | 6.8%(+12.7)#90 | 8.8%(+10.7)#5,061 |
| 91. | Nickelsville | 19.4% | 6.8%(+12.6)#91 | 8.8%(+10.6)#5,112 |
| 92. | Petersburg | 19.1% | 6.8%(+12.3)#92 | 8.8%(+10.4)#5,194 |
| 93. | Fries | 19.1% | 6.8%(+12.3)#93 | 8.8%(+10.3)#5,211 |
| 94. | Nassawadox | 19.0% | 6.8%(+12.2)#94 | 8.8%(+10.2)#5,262 |
| 95. | Crimora | 18.8% | 6.8%(+12.0)#95 | 8.8%(+10.1)#5,331 |
| 96. | Bensley | 18.8% | 6.8%(+12.0)#96 | 8.8%(+10.0)#5,344 |
| 97. | Gargatha | 18.8% | 6.8%(+12.0)#97 | 8.8%(+10.0)#5,354 |
| 98. | Big Stone Gap East | 18.8% | 6.8%(+12.0)#98 | 8.8%(+10.0)#5,355 |
| 99. | Glen Wilton | 18.8% | 6.8%(+12.0)#99 | 8.8%(+9.97)#5,374 |
| 100. | Boissevain | 18.7% | 6.8%(+11.9)#100 | 8.8%(+9.88)#5,425 |
Common Questions
What are the Top 10 Cities with the Highest Poverty Level Among Families in Virginia?
Top 10 Cities with the Highest Poverty Level Among Families in Virginia are:
#1
91.7%
#2
77.4%
#3
67.6%
#4
62.7%
#5
56.3%
#6
52.0%
#7
51.7%
#8
50.9%
#9
50.0%
#10
50.0%
What city has the Highest Poverty Level Among Families in Virginia?
New Church has the Highest Poverty Level Among Families in Virginia with 91.7%.
What is the Poverty Level Among Families in the State of Virginia?
Poverty Level Among Families in Virginia is 6.8%.
What is the Poverty Level Among Families in the United States?
Poverty Level Among Families in the United States is 8.8%.