Cities with the Highest Poverty Level Among Families in Pennsylvania
RELATED REPORTS & OPTIONS
Highest Family Poverty
Pennsylvania
Compare Cities
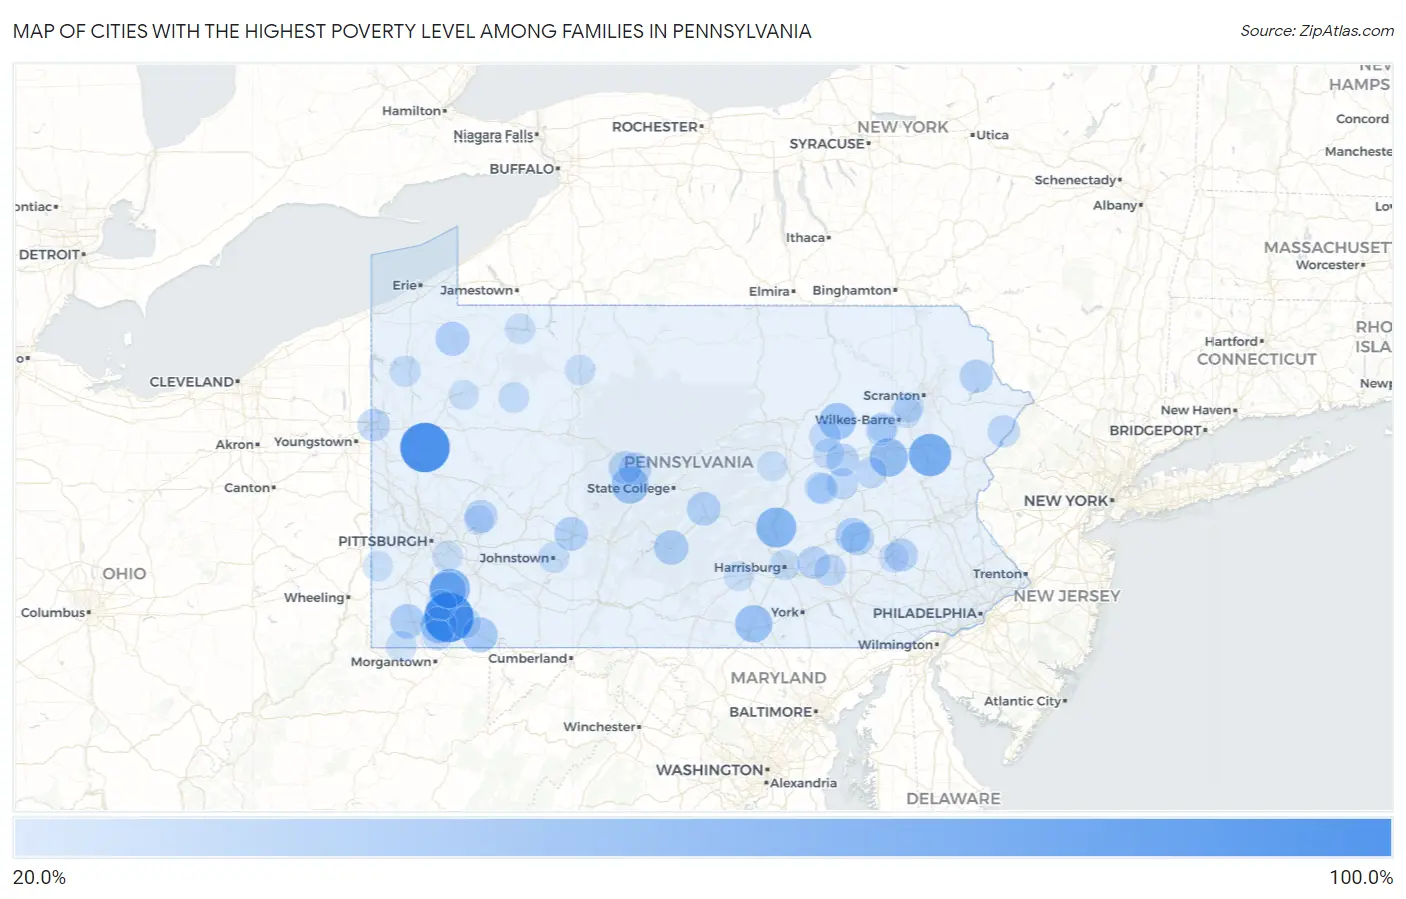
Map of Cities with the Highest Poverty Level Among Families in Pennsylvania
0.0%
100.0%
Cities with the Highest Poverty Level Among Families in Pennsylvania
| City | Family Poverty | vs State | vs National | |
| 1. | Slippery Rock University | 100.0% | 8.0%(+92.0)#1 | 8.8%(+91.2)#2 |
| 2. | Buffington | 100.0% | 8.0%(+92.0)#2 | 8.8%(+91.2)#43 |
| 3. | Aaronsburg Cdp Washington County | 80.0% | 8.0%(+72.0)#3 | 8.8%(+71.2)#168 |
| 4. | Albrightsville | 71.9% | 8.0%(+63.9)#4 | 8.8%(+63.1)#228 |
| 5. | Lenkerville | 62.8% | 8.0%(+54.8)#5 | 8.8%(+54.0)#341 |
| 6. | Arnold City | 62.1% | 8.0%(+54.1)#6 | 8.8%(+53.3)#352 |
| 7. | St. Clair | 60.0% | 8.0%(+52.0)#7 | 8.8%(+51.2)#382 |
| 8. | East Altoona | 55.8% | 8.0%(+47.8)#8 | 8.8%(+47.0)#473 |
| 9. | Pardeesville | 55.6% | 8.0%(+47.6)#9 | 8.8%(+46.8)#478 |
| 10. | Carson Valley | 52.9% | 8.0%(+44.9)#10 | 8.8%(+44.2)#556 |
| 11. | Washingtonville Borough | 52.2% | 8.0%(+44.2)#11 | 8.8%(+43.4)#580 |
| 12. | Hunterstown | 51.9% | 8.0%(+43.9)#12 | 8.8%(+43.1)#595 |
| 13. | Sandy Ridge | 51.2% | 8.0%(+43.2)#13 | 8.8%(+42.4)#614 |
| 14. | Naomi | 50.0% | 8.0%(+42.0)#14 | 8.8%(+41.2)#661 |
| 15. | Waller | 50.0% | 8.0%(+42.0)#15 | 8.8%(+41.2)#663 |
| 16. | Beavertown | 50.0% | 8.0%(+42.0)#16 | 8.8%(+41.2)#680 |
| 17. | Nemacolin | 47.3% | 8.0%(+39.4)#17 | 8.8%(+38.6)#786 |
| 18. | Farmington | 43.9% | 8.0%(+35.9)#18 | 8.8%(+35.1)#931 |
| 19. | Bethel | 41.2% | 8.0%(+33.2)#19 | 8.8%(+32.4)#1,124 |
| 20. | West Waynesburg | 41.0% | 8.0%(+33.0)#20 | 8.8%(+32.2)#1,143 |
| 21. | Cedar Crest | 40.9% | 8.0%(+32.9)#21 | 8.8%(+32.1)#1,147 |
| 22. | Riceville | 40.0% | 8.0%(+32.0)#22 | 8.8%(+31.2)#1,212 |
| 23. | Rainsburg Borough | 39.3% | 8.0%(+31.3)#23 | 8.8%(+30.5)#1,265 |
| 24. | Revloc | 38.7% | 8.0%(+30.7)#24 | 8.8%(+29.9)#1,306 |
| 25. | Lumber City | 38.6% | 8.0%(+30.6)#25 | 8.8%(+29.8)#1,319 |
| 26. | Briar Creek Borough | 38.3% | 8.0%(+30.3)#26 | 8.8%(+29.5)#1,334 |
| 27. | White Mills | 36.9% | 8.0%(+28.9)#27 | 8.8%(+28.2)#1,431 |
| 28. | Rehrersburg | 36.9% | 8.0%(+28.9)#28 | 8.8%(+28.1)#1,434 |
| 29. | Rankin Borough | 36.4% | 8.0%(+28.4)#29 | 8.8%(+27.6)#1,471 |
| 30. | West Decatur | 36.1% | 8.0%(+28.1)#30 | 8.8%(+27.3)#1,499 |
| 31. | Wall Borough | 36.0% | 8.0%(+28.0)#31 | 8.8%(+27.2)#1,506 |
| 32. | Stony Creek Mills | 35.9% | 8.0%(+27.9)#32 | 8.8%(+27.1)#1,513 |
| 33. | Mainville | 35.3% | 8.0%(+27.3)#33 | 8.8%(+26.5)#1,581 |
| 34. | Brownsville Borough | 34.8% | 8.0%(+26.8)#34 | 8.8%(+26.0)#1,625 |
| 35. | North Vandergrift | 34.8% | 8.0%(+26.8)#35 | 8.8%(+26.0)#1,627 |
| 36. | Ashley Borough | 34.7% | 8.0%(+26.7)#36 | 8.8%(+26.0)#1,634 |
| 37. | Smithton Borough | 34.6% | 8.0%(+26.6)#37 | 8.8%(+25.8)#1,644 |
| 38. | Hawk Run | 34.4% | 8.0%(+26.4)#38 | 8.8%(+25.6)#1,669 |
| 39. | Farrell | 33.9% | 8.0%(+25.9)#39 | 8.8%(+25.1)#1,724 |
| 40. | Palmdale | 33.8% | 8.0%(+25.8)#40 | 8.8%(+25.0)#1,736 |
| 41. | Spring Drive Mobile Home Park | 33.3% | 8.0%(+25.3)#41 | 8.8%(+24.6)#1,788 |
| 42. | Mckees Rocks Borough | 32.8% | 8.0%(+24.8)#42 | 8.8%(+24.0)#1,853 |
| 43. | Pocono Ranch Lands | 32.7% | 8.0%(+24.7)#43 | 8.8%(+24.0)#1,863 |
| 44. | Hazen | 32.6% | 8.0%(+24.6)#44 | 8.8%(+23.8)#1,875 |
| 45. | East Uniontown | 31.5% | 8.0%(+23.5)#45 | 8.8%(+22.7)#2,005 |
| 46. | Mckee | 31.3% | 8.0%(+23.3)#46 | 8.8%(+22.5)#2,026 |
| 47. | Timber Hills | 31.2% | 8.0%(+23.2)#47 | 8.8%(+22.4)#2,047 |
| 48. | Iola | 31.1% | 8.0%(+23.1)#48 | 8.8%(+22.3)#2,055 |
| 49. | Sheppton | 30.0% | 8.0%(+22.0)#49 | 8.8%(+21.2)#2,221 |
| 50. | Wilburton Number Two | 30.0% | 8.0%(+22.0)#50 | 8.8%(+21.2)#2,237 |
| 51. | Grampian Borough | 29.9% | 8.0%(+21.9)#51 | 8.8%(+21.1)#2,253 |
| 52. | Darby Borough | 29.6% | 8.0%(+21.6)#52 | 8.8%(+20.8)#2,292 |
| 53. | Geneva | 29.4% | 8.0%(+21.4)#53 | 8.8%(+20.6)#2,322 |
| 54. | Mapletown | 29.4% | 8.0%(+21.4)#54 | 8.8%(+20.6)#2,324 |
| 55. | Tharptown Uniontown | 29.3% | 8.0%(+21.3)#55 | 8.8%(+20.5)#2,336 |
| 56. | Wanamie | 29.3% | 8.0%(+21.3)#56 | 8.8%(+20.5)#2,340 |
| 57. | Mount Union Borough | 29.2% | 8.0%(+21.2)#57 | 8.8%(+20.4)#2,346 |
| 58. | Brave | 29.1% | 8.0%(+21.1)#58 | 8.8%(+20.3)#2,369 |
| 59. | Shamokin | 28.8% | 8.0%(+20.8)#59 | 8.8%(+20.0)#2,412 |
| 60. | Buckhorn | 28.6% | 8.0%(+20.6)#60 | 8.8%(+19.8)#2,453 |
| 61. | Johnstown | 28.5% | 8.0%(+20.5)#61 | 8.8%(+19.7)#2,487 |
| 62. | Woodbury Borough | 28.3% | 8.0%(+20.3)#62 | 8.8%(+19.5)#2,515 |
| 63. | Inkerman | 28.3% | 8.0%(+20.3)#63 | 8.8%(+19.5)#2,521 |
| 64. | Lewistown Borough | 28.1% | 8.0%(+20.1)#64 | 8.8%(+19.3)#2,548 |
| 65. | Braddock Borough | 27.9% | 8.0%(+19.9)#65 | 8.8%(+19.1)#2,582 |
| 66. | Crown | 27.9% | 8.0%(+19.9)#66 | 8.8%(+19.1)#2,595 |
| 67. | North York Borough | 27.9% | 8.0%(+19.9)#67 | 8.8%(+19.1)#2,597 |
| 68. | Chester Hill Borough | 27.5% | 8.0%(+19.5)#68 | 8.8%(+18.7)#2,670 |
| 69. | Wattsburg Borough | 27.5% | 8.0%(+19.5)#69 | 8.8%(+18.7)#2,672 |
| 70. | Harrisburg | 27.4% | 8.0%(+19.4)#70 | 8.8%(+18.6)#2,690 |
| 71. | Rimersburg Borough | 27.3% | 8.0%(+19.3)#71 | 8.8%(+18.5)#2,701 |
| 72. | Cove Forge | 27.3% | 8.0%(+19.3)#72 | 8.8%(+18.5)#2,717 |
| 73. | Mckeesport | 27.3% | 8.0%(+19.3)#73 | 8.8%(+18.5)#2,730 |
| 74. | New Columbus Borough | 27.2% | 8.0%(+19.2)#74 | 8.8%(+18.4)#2,736 |
| 75. | Starbrick | 26.9% | 8.0%(+18.9)#75 | 8.8%(+18.1)#2,791 |
| 76. | Wilcox | 26.7% | 8.0%(+18.7)#76 | 8.8%(+17.9)#2,832 |
| 77. | Fairchance Borough | 26.5% | 8.0%(+18.5)#77 | 8.8%(+17.7)#2,873 |
| 78. | Macungie Borough | 26.5% | 8.0%(+18.5)#78 | 8.8%(+17.7)#2,883 |
| 79. | East Pittsburgh Borough | 26.4% | 8.0%(+18.4)#79 | 8.8%(+17.6)#2,899 |
| 80. | Franklin Borough | 26.3% | 8.0%(+18.3)#80 | 8.8%(+17.5)#2,937 |
| 81. | Vandergrift Borough | 26.1% | 8.0%(+18.1)#81 | 8.8%(+17.3)#2,958 |
| 82. | Vicksburg | 26.0% | 8.0%(+18.0)#82 | 8.8%(+17.2)#2,990 |
| 83. | Pittston | 26.0% | 8.0%(+18.0)#83 | 8.8%(+17.2)#2,991 |
| 84. | Avella | 26.0% | 8.0%(+18.0)#84 | 8.8%(+17.2)#2,997 |
| 85. | Mahanoy City Borough | 25.8% | 8.0%(+17.8)#85 | 8.8%(+17.0)#3,041 |
| 86. | Slatington Borough | 25.8% | 8.0%(+17.8)#86 | 8.8%(+17.0)#3,048 |
| 87. | Woodland Heights | 25.5% | 8.0%(+17.5)#87 | 8.8%(+16.8)#3,100 |
| 88. | Blawnox Borough | 25.4% | 8.0%(+17.5)#88 | 8.8%(+16.7)#3,128 |
| 89. | Sheatown | 25.2% | 8.0%(+17.2)#89 | 8.8%(+16.5)#3,166 |
| 90. | Freedom Borough | 25.2% | 8.0%(+17.2)#90 | 8.8%(+16.4)#3,168 |
| 91. | Sharon Hill Borough | 25.2% | 8.0%(+17.2)#91 | 8.8%(+16.4)#3,169 |
| 92. | Cambridge Springs Borough | 25.2% | 8.0%(+17.2)#92 | 8.8%(+16.4)#3,181 |
| 93. | Reading | 25.1% | 8.0%(+17.1)#93 | 8.8%(+16.3)#3,184 |
| 94. | Hiller | 25.1% | 8.0%(+17.1)#94 | 8.8%(+16.3)#3,188 |
| 95. | Oklahoma | 25.1% | 8.0%(+17.1)#95 | 8.8%(+16.3)#3,190 |
| 96. | Plainfield | 25.0% | 8.0%(+17.0)#96 | 8.8%(+16.2)#3,222 |
| 97. | Mcconnellsburg Borough | 24.4% | 8.0%(+16.4)#97 | 8.8%(+15.6)#3,381 |
| 98. | Halifax Borough | 24.4% | 8.0%(+16.4)#98 | 8.8%(+15.6)#3,401 |
| 99. | Potters Mills | 24.3% | 8.0%(+16.3)#99 | 8.8%(+15.5)#3,413 |
| 100. | Westover Borough | 24.2% | 8.0%(+16.2)#100 | 8.8%(+15.4)#3,439 |
Common Questions
What are the Top 10 Cities with the Highest Poverty Level Among Families in Pennsylvania?
Top 10 Cities with the Highest Poverty Level Among Families in Pennsylvania are:
#1
100.0%
#2
100.0%
#3
71.9%
#4
62.8%
#5
62.1%
#6
55.6%
#7
51.9%
#8
51.2%
#9
50.0%
#10
50.0%
What city has the Highest Poverty Level Among Families in Pennsylvania?
Slippery Rock University has the Highest Poverty Level Among Families in Pennsylvania with 100.0%.
What is the Poverty Level Among Families in the State of Pennsylvania?
Poverty Level Among Families in Pennsylvania is 8.0%.
What is the Poverty Level Among Families in the United States?
Poverty Level Among Families in the United States is 8.8%.