Cities with the Highest Poverty Level Among Families in Mississippi
RELATED REPORTS & OPTIONS
Highest Family Poverty
Mississippi
Compare Cities
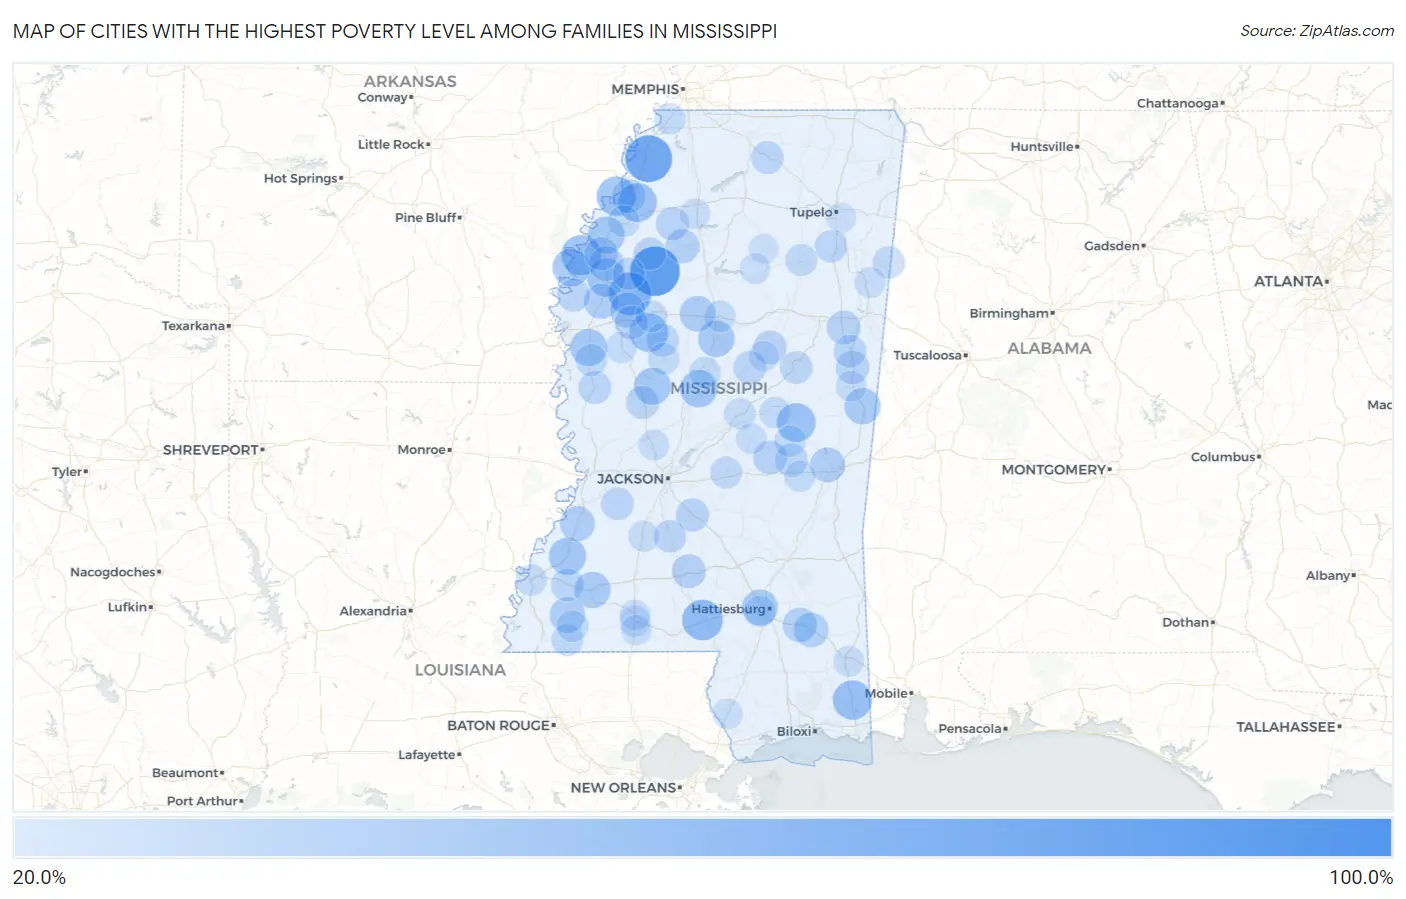
Map of Cities with the Highest Poverty Level Among Families in Mississippi
0.0%
100.0%
Cities with the Highest Poverty Level Among Families in Mississippi
| City | Family Poverty | vs State | vs National | |
| 1. | Symonds | 100.0% | 14.4%(+85.6)#1 | 8.8%(+91.2)#107 |
| 2. | Glendora | 87.5% | 14.4%(+73.1)#2 | 8.8%(+78.7)#140 |
| 3. | Glen Allan | 85.0% | 14.4%(+70.6)#3 | 8.8%(+76.2)#146 |
| 4. | Bethlehem | 82.9% | 14.4%(+68.5)#4 | 8.8%(+74.1)#154 |
| 5. | White Oak | 78.8% | 14.4%(+64.4)#5 | 8.8%(+70.0)#175 |
| 6. | Harperville | 71.0% | 14.4%(+56.6)#6 | 8.8%(+62.2)#237 |
| 7. | Doddsville | 66.7% | 14.4%(+52.3)#7 | 8.8%(+57.9)#269 |
| 8. | De Soto | 61.1% | 14.4%(+46.7)#8 | 8.8%(+52.3)#368 |
| 9. | Foxworth | 59.1% | 14.4%(+44.6)#9 | 8.8%(+50.3)#403 |
| 10. | Gunnison | 57.4% | 14.4%(+43.0)#10 | 8.8%(+48.6)#433 |
| 11. | Wade | 54.6% | 14.4%(+40.2)#11 | 8.8%(+45.8)#508 |
| 12. | Friars Point | 54.4% | 14.4%(+40.0)#12 | 8.8%(+45.6)#518 |
| 13. | Tucker | 53.6% | 14.4%(+39.2)#13 | 8.8%(+44.8)#538 |
| 14. | Morgan City | 53.3% | 14.4%(+38.9)#14 | 8.8%(+44.6)#541 |
| 15. | Jonestown | 53.3% | 14.4%(+38.9)#15 | 8.8%(+44.5)#546 |
| 16. | Renova | 51.4% | 14.4%(+37.0)#16 | 8.8%(+42.6)#608 |
| 17. | Winterville | 50.0% | 14.4%(+35.6)#17 | 8.8%(+41.2)#656 |
| 18. | Rosedale | 49.8% | 14.4%(+35.4)#18 | 8.8%(+41.0)#685 |
| 19. | Goodman | 49.1% | 14.4%(+34.7)#19 | 8.8%(+40.3)#706 |
| 20. | Fayette | 48.7% | 14.4%(+34.3)#20 | 8.8%(+39.9)#721 |
| 21. | Eden | 47.5% | 14.4%(+33.1)#21 | 8.8%(+38.7)#778 |
| 22. | Arcola | 47.5% | 14.4%(+33.1)#22 | 8.8%(+38.7)#779 |
| 23. | Alligator | 47.4% | 14.4%(+33.0)#23 | 8.8%(+38.6)#782 |
| 24. | Vaiden | 45.9% | 14.4%(+31.5)#24 | 8.8%(+37.1)#833 |
| 25. | Bude | 45.3% | 14.4%(+30.9)#25 | 8.8%(+36.6)#862 |
| 26. | Bond | 45.3% | 14.4%(+30.9)#26 | 8.8%(+36.6)#863 |
| 27. | Scooba | 45.2% | 14.4%(+30.8)#27 | 8.8%(+36.4)#867 |
| 28. | Arnold Line | 44.8% | 14.4%(+30.4)#28 | 8.8%(+36.0)#886 |
| 29. | North Carrollton | 43.6% | 14.4%(+29.2)#29 | 8.8%(+34.8)#952 |
| 30. | Crosby | 42.9% | 14.4%(+28.5)#30 | 8.8%(+34.1)#1,001 |
| 31. | Shaw | 41.7% | 14.4%(+27.3)#31 | 8.8%(+33.0)#1,074 |
| 32. | Sunflower | 41.6% | 14.4%(+27.2)#32 | 8.8%(+32.8)#1,092 |
| 33. | Port Gibson | 41.5% | 14.4%(+27.1)#33 | 8.8%(+32.7)#1,094 |
| 34. | Nellieburg | 41.4% | 14.4%(+27.0)#34 | 8.8%(+32.6)#1,107 |
| 35. | Mound Bayou | 41.2% | 14.4%(+26.8)#35 | 8.8%(+32.4)#1,120 |
| 36. | Bovina | 40.9% | 14.4%(+26.5)#36 | 8.8%(+32.1)#1,145 |
| 37. | Beaumont | 40.4% | 14.4%(+26.0)#37 | 8.8%(+31.6)#1,178 |
| 38. | New Augusta | 40.3% | 14.4%(+25.9)#38 | 8.8%(+31.5)#1,185 |
| 39. | Charleston | 38.7% | 14.4%(+24.3)#39 | 8.8%(+29.9)#1,311 |
| 40. | Silver Creek | 38.6% | 14.4%(+24.2)#40 | 8.8%(+29.9)#1,313 |
| 41. | Artesia | 38.2% | 14.4%(+23.8)#41 | 8.8%(+29.5)#1,337 |
| 42. | Coahoma | 38.1% | 14.4%(+23.7)#42 | 8.8%(+29.3)#1,344 |
| 43. | Conehatta | 37.9% | 14.4%(+23.5)#43 | 8.8%(+29.1)#1,359 |
| 44. | Paris | 37.5% | 14.4%(+23.1)#44 | 8.8%(+28.7)#1,378 |
| 45. | Weir | 37.0% | 14.4%(+22.6)#45 | 8.8%(+28.2)#1,426 |
| 46. | Macon | 36.6% | 14.4%(+22.2)#46 | 8.8%(+27.8)#1,460 |
| 47. | Shelby | 36.5% | 14.4%(+22.1)#47 | 8.8%(+27.7)#1,463 |
| 48. | Moorhead | 36.3% | 14.4%(+21.9)#48 | 8.8%(+27.5)#1,490 |
| 49. | Crowder | 36.1% | 14.4%(+21.7)#49 | 8.8%(+27.3)#1,498 |
| 50. | Braxton | 36.0% | 14.4%(+21.6)#50 | 8.8%(+27.2)#1,507 |
| 51. | Yazoo City | 35.7% | 14.4%(+21.3)#51 | 8.8%(+26.9)#1,530 |
| 52. | Benoit | 35.5% | 14.4%(+21.1)#52 | 8.8%(+26.8)#1,553 |
| 53. | Ethel | 35.4% | 14.4%(+21.0)#53 | 8.8%(+26.7)#1,561 |
| 54. | Cruger | 35.4% | 14.4%(+21.0)#54 | 8.8%(+26.6)#1,565 |
| 55. | Decatur | 35.2% | 14.4%(+20.8)#55 | 8.8%(+26.4)#1,589 |
| 56. | Utica | 35.1% | 14.4%(+20.7)#56 | 8.8%(+26.3)#1,599 |
| 57. | Anguilla | 35.1% | 14.4%(+20.7)#57 | 8.8%(+26.3)#1,600 |
| 58. | Roxie | 35.0% | 14.4%(+20.6)#58 | 8.8%(+26.3)#1,603 |
| 59. | Potts Camp | 34.8% | 14.4%(+20.4)#59 | 8.8%(+26.0)#1,623 |
| 60. | Brooksville | 34.8% | 14.4%(+20.4)#60 | 8.8%(+26.0)#1,626 |
| 61. | Louisville | 34.3% | 14.4%(+19.9)#61 | 8.8%(+25.5)#1,682 |
| 62. | Georgetown | 34.0% | 14.4%(+19.6)#62 | 8.8%(+25.2)#1,710 |
| 63. | Okolona | 33.7% | 14.4%(+19.3)#63 | 8.8%(+24.9)#1,748 |
| 64. | Webb | 33.7% | 14.4%(+19.3)#64 | 8.8%(+24.9)#1,749 |
| 65. | Drew | 33.4% | 14.4%(+19.0)#65 | 8.8%(+24.6)#1,762 |
| 66. | Gattman | 33.3% | 14.4%(+18.9)#66 | 8.8%(+24.6)#1,795 |
| 67. | Morton | 32.8% | 14.4%(+18.4)#67 | 8.8%(+24.0)#1,854 |
| 68. | Houston | 32.8% | 14.4%(+18.4)#68 | 8.8%(+24.0)#1,860 |
| 69. | Centreville | 32.8% | 14.4%(+18.4)#69 | 8.8%(+24.0)#1,861 |
| 70. | Hollandale | 32.7% | 14.4%(+18.3)#70 | 8.8%(+23.9)#1,866 |
| 71. | Itta Bena | 31.9% | 14.4%(+17.5)#71 | 8.8%(+23.1)#1,943 |
| 72. | Tchula | 31.8% | 14.4%(+17.4)#72 | 8.8%(+23.0)#1,960 |
| 73. | Clarksdale | 31.5% | 14.4%(+17.1)#73 | 8.8%(+22.8)#1,997 |
| 74. | Union | 31.4% | 14.4%(+17.0)#74 | 8.8%(+22.6)#2,015 |
| 75. | Durant | 31.2% | 14.4%(+16.8)#75 | 8.8%(+22.4)#2,046 |
| 76. | Gloster | 31.1% | 14.4%(+16.7)#76 | 8.8%(+22.3)#2,056 |
| 77. | West Hattiesburg | 30.9% | 14.4%(+16.5)#77 | 8.8%(+22.1)#2,081 |
| 78. | Redwater | 30.9% | 14.4%(+16.5)#78 | 8.8%(+22.1)#2,090 |
| 79. | Winona | 30.8% | 14.4%(+16.4)#79 | 8.8%(+22.0)#2,102 |
| 80. | Pearl River | 30.5% | 14.4%(+16.0)#80 | 8.8%(+21.7)#2,153 |
| 81. | Natchez | 30.4% | 14.4%(+16.0)#81 | 8.8%(+21.6)#2,159 |
| 82. | Isola | 30.4% | 14.4%(+16.0)#82 | 8.8%(+21.6)#2,162 |
| 83. | Walls | 30.1% | 14.4%(+15.7)#83 | 8.8%(+21.3)#2,212 |
| 84. | Hickory | 30.0% | 14.4%(+15.6)#84 | 8.8%(+21.2)#2,222 |
| 85. | Hamilton | 29.6% | 14.4%(+15.2)#85 | 8.8%(+20.8)#2,286 |
| 86. | Hazlehurst | 29.6% | 14.4%(+15.2)#86 | 8.8%(+20.8)#2,301 |
| 87. | Lucedale | 29.2% | 14.4%(+14.8)#87 | 8.8%(+20.4)#2,348 |
| 88. | Mccomb | 29.1% | 14.4%(+14.7)#88 | 8.8%(+20.3)#2,368 |
| 89. | Walnut Grove | 29.0% | 14.4%(+14.6)#89 | 8.8%(+20.3)#2,377 |
| 90. | Shuqualak | 28.8% | 14.4%(+14.4)#90 | 8.8%(+20.0)#2,425 |
| 91. | Flora | 28.6% | 14.4%(+14.2)#91 | 8.8%(+19.9)#2,440 |
| 92. | Summit | 28.2% | 14.4%(+13.8)#92 | 8.8%(+19.5)#2,523 |
| 93. | Big Creek | 28.2% | 14.4%(+13.8)#93 | 8.8%(+19.4)#2,530 |
| 94. | Courtland | 28.1% | 14.4%(+13.7)#94 | 8.8%(+19.4)#2,539 |
| 95. | Magnolia | 28.1% | 14.4%(+13.7)#95 | 8.8%(+19.4)#2,542 |
| 96. | Mccool | 27.8% | 14.4%(+13.4)#96 | 8.8%(+19.0)#2,621 |
| 97. | Picayune | 27.6% | 14.4%(+13.2)#97 | 8.8%(+18.8)#2,654 |
| 98. | Agricola | 27.2% | 14.4%(+12.7)#98 | 8.8%(+18.4)#2,738 |
| 99. | Plantersville | 27.0% | 14.4%(+12.6)#99 | 8.8%(+18.2)#2,773 |
| 100. | Bruce | 26.8% | 14.4%(+12.4)#100 | 8.8%(+18.0)#2,812 |
Common Questions
What are the Top 10 Cities with the Highest Poverty Level Among Families in Mississippi?
Top 10 Cities with the Highest Poverty Level Among Families in Mississippi are:
#1
87.5%
#2
78.8%
#3
66.7%
#4
59.1%
#5
57.4%
#6
54.6%
#7
54.4%
#8
53.6%
#9
53.3%
#10
53.3%
What city has the Highest Poverty Level Among Families in Mississippi?
Glendora has the Highest Poverty Level Among Families in Mississippi with 87.5%.
What is the Poverty Level Among Families in the State of Mississippi?
Poverty Level Among Families in Mississippi is 14.4%.
What is the Poverty Level Among Families in the United States?
Poverty Level Among Families in the United States is 8.8%.