Cities with the Highest Poverty Level Among Families in Indiana
RELATED REPORTS & OPTIONS
Highest Family Poverty
Indiana
Compare Cities
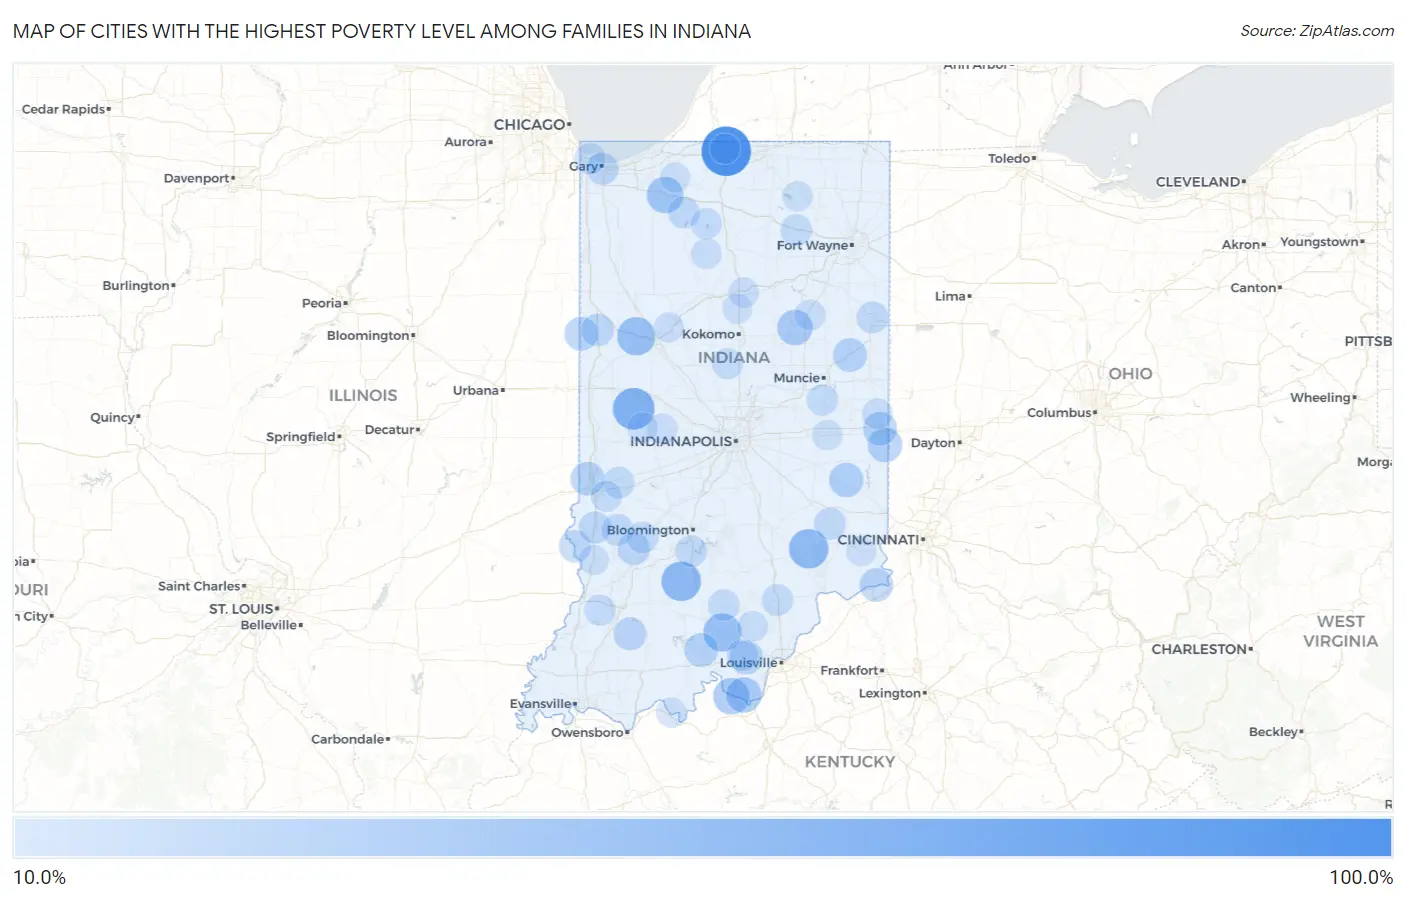
Map of Cities with the Highest Poverty Level Among Families in Indiana
0.0%
100.0%
Cities with the Highest Poverty Level Among Families in Indiana
| City | Family Poverty | vs State | vs National | |
| 1. | Notre Dame | 100.0% | 8.5%(+91.5)#1 | 8.8%(+91.2)#1 |
| 2. | Millville | 100.0% | 8.5%(+91.5)#2 | 8.8%(+91.2)#24 |
| 3. | Centerton | 100.0% | 8.5%(+91.5)#3 | 8.8%(+91.2)#25 |
| 4. | Pence | 100.0% | 8.5%(+91.5)#4 | 8.8%(+91.2)#30 |
| 5. | Grayford | 100.0% | 8.5%(+91.5)#5 | 8.8%(+91.2)#41 |
| 6. | Linn Grove | 100.0% | 8.5%(+91.5)#6 | 8.8%(+91.2)#44 |
| 7. | Otisco | 100.0% | 8.5%(+91.5)#7 | 8.8%(+91.2)#48 |
| 8. | Penntown | 100.0% | 8.5%(+91.5)#8 | 8.8%(+91.2)#65 |
| 9. | Lake View | 100.0% | 8.5%(+91.5)#9 | 8.8%(+91.2)#66 |
| 10. | Burney | 100.0% | 8.5%(+91.5)#10 | 8.8%(+91.2)#104 |
| 11. | Lewis | 93.0% | 8.5%(+84.5)#11 | 8.8%(+84.2)#128 |
| 12. | Hartz Lake | 69.7% | 8.5%(+61.2)#12 | 8.8%(+60.9)#244 |
| 13. | Azalia | 67.4% | 8.5%(+58.9)#13 | 8.8%(+58.6)#261 |
| 14. | Alamo | 66.7% | 8.5%(+58.2)#14 | 8.8%(+57.9)#275 |
| 15. | Eugene | 63.6% | 8.5%(+55.2)#15 | 8.8%(+54.9)#329 |
| 16. | Williams | 58.3% | 8.5%(+49.9)#16 | 8.8%(+49.6)#419 |
| 17. | Adams | 57.4% | 8.5%(+49.0)#17 | 8.8%(+48.7)#432 |
| 18. | Butlerville | 57.4% | 8.5%(+48.9)#18 | 8.8%(+48.6)#435 |
| 19. | Hobbs | 55.2% | 8.5%(+46.7)#19 | 8.8%(+46.4)#498 |
| 20. | Montmorenci | 52.3% | 8.5%(+43.8)#20 | 8.8%(+43.5)#577 |
| 21. | Hardinsburg | 51.9% | 8.5%(+43.4)#21 | 8.8%(+43.1)#593 |
| 22. | Prairie Creek | 47.5% | 8.5%(+39.1)#22 | 8.8%(+38.8)#773 |
| 23. | Lake Cicott | 47.1% | 8.5%(+38.6)#23 | 8.8%(+38.3)#796 |
| 24. | Arthur | 46.9% | 8.5%(+38.4)#24 | 8.8%(+38.1)#801 |
| 25. | Hanna | 45.0% | 8.5%(+36.6)#25 | 8.8%(+36.3)#877 |
| 26. | Mauckport | 44.4% | 8.5%(+36.0)#26 | 8.8%(+35.7)#910 |
| 27. | Young America | 43.1% | 8.5%(+34.6)#27 | 8.8%(+34.3)#988 |
| 28. | Deer Creek | 41.5% | 8.5%(+33.0)#28 | 8.8%(+32.7)#1,101 |
| 29. | Cates | 41.2% | 8.5%(+32.7)#29 | 8.8%(+32.4)#1,127 |
| 30. | Laconia | 41.2% | 8.5%(+32.7)#30 | 8.8%(+32.4)#1,130 |
| 31. | Marion | 41.1% | 8.5%(+32.6)#31 | 8.8%(+32.3)#1,137 |
| 32. | Boston | 37.7% | 8.5%(+29.2)#32 | 8.8%(+28.9)#1,370 |
| 33. | Servia | 37.5% | 8.5%(+29.0)#33 | 8.8%(+28.7)#1,376 |
| 34. | Brimfield | 37.3% | 8.5%(+28.9)#34 | 8.8%(+28.6)#1,402 |
| 35. | Laurel | 36.9% | 8.5%(+28.4)#35 | 8.8%(+28.1)#1,435 |
| 36. | Spring Grove | 35.2% | 8.5%(+26.8)#36 | 8.8%(+26.5)#1,587 |
| 37. | Redkey | 34.9% | 8.5%(+26.4)#37 | 8.8%(+26.1)#1,618 |
| 38. | English | 34.5% | 8.5%(+26.0)#38 | 8.8%(+25.7)#1,652 |
| 39. | St Mary Of The Woods | 34.4% | 8.5%(+25.9)#39 | 8.8%(+25.6)#1,668 |
| 40. | Ambia | 34.0% | 8.5%(+25.6)#40 | 8.8%(+25.3)#1,706 |
| 41. | Crandall | 33.9% | 8.5%(+25.4)#41 | 8.8%(+25.1)#1,720 |
| 42. | Florence | 33.3% | 8.5%(+24.9)#42 | 8.8%(+24.6)#1,809 |
| 43. | Billtown | 32.6% | 8.5%(+24.1)#43 | 8.8%(+23.8)#1,873 |
| 44. | Nyona Lake | 32.4% | 8.5%(+24.0)#44 | 8.8%(+23.7)#1,896 |
| 45. | Cross Plains | 32.3% | 8.5%(+23.8)#45 | 8.8%(+23.5)#1,908 |
| 46. | St. Omer | 32.1% | 8.5%(+23.7)#46 | 8.8%(+23.4)#1,918 |
| 47. | Amity | 31.9% | 8.5%(+23.4)#47 | 8.8%(+23.1)#1,945 |
| 48. | Coal | 30.8% | 8.5%(+22.3)#48 | 8.8%(+22.0)#2,111 |
| 49. | Otwell | 30.7% | 8.5%(+22.2)#49 | 8.8%(+21.9)#2,127 |
| 50. | Boswell | 29.9% | 8.5%(+21.5)#50 | 8.8%(+21.2)#2,250 |
| 51. | Switz City | 29.0% | 8.5%(+20.5)#51 | 8.8%(+20.2)#2,381 |
| 52. | Burnett | 28.8% | 8.5%(+20.3)#52 | 8.8%(+20.0)#2,420 |
| 53. | Merom | 28.3% | 8.5%(+19.8)#53 | 8.8%(+19.5)#2,518 |
| 54. | Shelburn | 28.3% | 8.5%(+19.8)#54 | 8.8%(+19.5)#2,520 |
| 55. | Gary | 27.9% | 8.5%(+19.4)#55 | 8.8%(+19.1)#2,583 |
| 56. | Blairsville | 27.9% | 8.5%(+19.4)#56 | 8.8%(+19.1)#2,586 |
| 57. | Williamsburg | 27.8% | 8.5%(+19.4)#57 | 8.8%(+19.1)#2,602 |
| 58. | Prairieton | 27.7% | 8.5%(+19.2)#58 | 8.8%(+18.9)#2,635 |
| 59. | Geneva | 27.3% | 8.5%(+18.8)#59 | 8.8%(+18.5)#2,714 |
| 60. | Napoleon | 27.1% | 8.5%(+18.6)#60 | 8.8%(+18.3)#2,743 |
| 61. | Knox | 27.1% | 8.5%(+18.6)#61 | 8.8%(+18.3)#2,752 |
| 62. | Alford | 27.0% | 8.5%(+18.5)#62 | 8.8%(+18.2)#2,759 |
| 63. | Jasonville | 26.8% | 8.5%(+18.3)#63 | 8.8%(+18.0)#2,810 |
| 64. | Harrodsburg | 26.1% | 8.5%(+17.6)#64 | 8.8%(+17.3)#2,977 |
| 65. | Larwill | 26.0% | 8.5%(+17.5)#65 | 8.8%(+17.2)#3,000 |
| 66. | Staunton | 26.0% | 8.5%(+17.5)#66 | 8.8%(+17.2)#3,003 |
| 67. | Worthington | 25.8% | 8.5%(+17.3)#67 | 8.8%(+17.0)#3,038 |
| 68. | Campbellsburg | 25.6% | 8.5%(+17.1)#68 | 8.8%(+16.8)#3,095 |
| 69. | New Salisbury | 25.5% | 8.5%(+17.0)#69 | 8.8%(+16.7)#3,111 |
| 70. | Springport | 25.0% | 8.5%(+16.5)#70 | 8.8%(+16.2)#3,232 |
| 71. | Willow Branch | 25.0% | 8.5%(+16.5)#71 | 8.8%(+16.2)#3,243 |
| 72. | Scottsburg | 24.9% | 8.5%(+16.4)#72 | 8.8%(+16.1)#3,281 |
| 73. | Bippus | 24.4% | 8.5%(+16.0)#73 | 8.8%(+15.7)#3,378 |
| 74. | East Chicago | 24.4% | 8.5%(+15.9)#74 | 8.8%(+15.6)#3,404 |
| 75. | Culver | 24.3% | 8.5%(+15.8)#75 | 8.8%(+15.5)#3,421 |
| 76. | Grantsburg | 23.8% | 8.5%(+15.3)#76 | 8.8%(+15.0)#3,547 |
| 77. | Monroe City | 23.7% | 8.5%(+15.2)#77 | 8.8%(+14.9)#3,580 |
| 78. | Kempton | 23.7% | 8.5%(+15.2)#78 | 8.8%(+14.9)#3,590 |
| 79. | Riley | 23.5% | 8.5%(+15.1)#79 | 8.8%(+14.7)#3,614 |
| 80. | Pittsburg | 23.5% | 8.5%(+15.1)#80 | 8.8%(+14.7)#3,618 |
| 81. | Van Buren | 22.8% | 8.5%(+14.4)#81 | 8.8%(+14.1)#3,802 |
| 82. | New Pekin | 22.5% | 8.5%(+14.0)#82 | 8.8%(+13.7)#3,916 |
| 83. | Fountain City | 22.4% | 8.5%(+13.9)#83 | 8.8%(+13.6)#3,953 |
| 84. | Kewanna | 22.1% | 8.5%(+13.7)#84 | 8.8%(+13.4)#4,033 |
| 85. | Roachdale | 21.9% | 8.5%(+13.4)#85 | 8.8%(+13.1)#4,135 |
| 86. | Lewisville | 21.8% | 8.5%(+13.3)#86 | 8.8%(+13.0)#4,157 |
| 87. | Peru | 21.2% | 8.5%(+12.7)#87 | 8.8%(+12.4)#4,374 |
| 88. | Thayer | 21.2% | 8.5%(+12.7)#88 | 8.8%(+12.4)#4,380 |
| 89. | Cannelton | 21.0% | 8.5%(+12.5)#89 | 8.8%(+12.2)#4,437 |
| 90. | Wolflake | 21.0% | 8.5%(+12.5)#90 | 8.8%(+12.2)#4,449 |
| 91. | Roseland | 21.0% | 8.5%(+12.5)#91 | 8.8%(+12.2)#4,461 |
| 92. | Americus | 21.0% | 8.5%(+12.5)#92 | 8.8%(+12.2)#4,463 |
| 93. | Cromwell | 21.0% | 8.5%(+12.5)#93 | 8.8%(+12.2)#4,464 |
| 94. | Russellville | 20.9% | 8.5%(+12.4)#94 | 8.8%(+12.1)#4,482 |
| 95. | Carlisle | 20.8% | 8.5%(+12.3)#95 | 8.8%(+12.0)#4,534 |
| 96. | Kingsbury | 20.5% | 8.5%(+12.1)#96 | 8.8%(+11.8)#4,616 |
| 97. | Dillsboro | 20.5% | 8.5%(+12.0)#97 | 8.8%(+11.7)#4,622 |
| 98. | Webster | 20.3% | 8.5%(+11.8)#98 | 8.8%(+11.5)#4,710 |
| 99. | Grissom Afb | 20.0% | 8.5%(+11.6)#99 | 8.8%(+11.3)#4,802 |
| 100. | Leiters Ford | 20.0% | 8.5%(+11.5)#100 | 8.8%(+11.2)#4,832 |
Common Questions
What are the Top 10 Cities with the Highest Poverty Level Among Families in Indiana?
Top 10 Cities with the Highest Poverty Level Among Families in Indiana are:
#1
100.0%
#2
66.7%
#3
58.3%
#4
57.4%
#5
52.3%
#6
51.9%
#7
45.0%
#8
44.4%
#9
41.2%
#10
41.1%
What city has the Highest Poverty Level Among Families in Indiana?
Notre Dame has the Highest Poverty Level Among Families in Indiana with 100.0%.
What is the Poverty Level Among Families in the State of Indiana?
Poverty Level Among Families in Indiana is 8.5%.
What is the Poverty Level Among Families in the United States?
Poverty Level Among Families in the United States is 8.8%.