Cities with the Highest Poverty Level Among Families in Vermont
RELATED REPORTS & OPTIONS
Highest Family Poverty
Vermont
Compare Cities
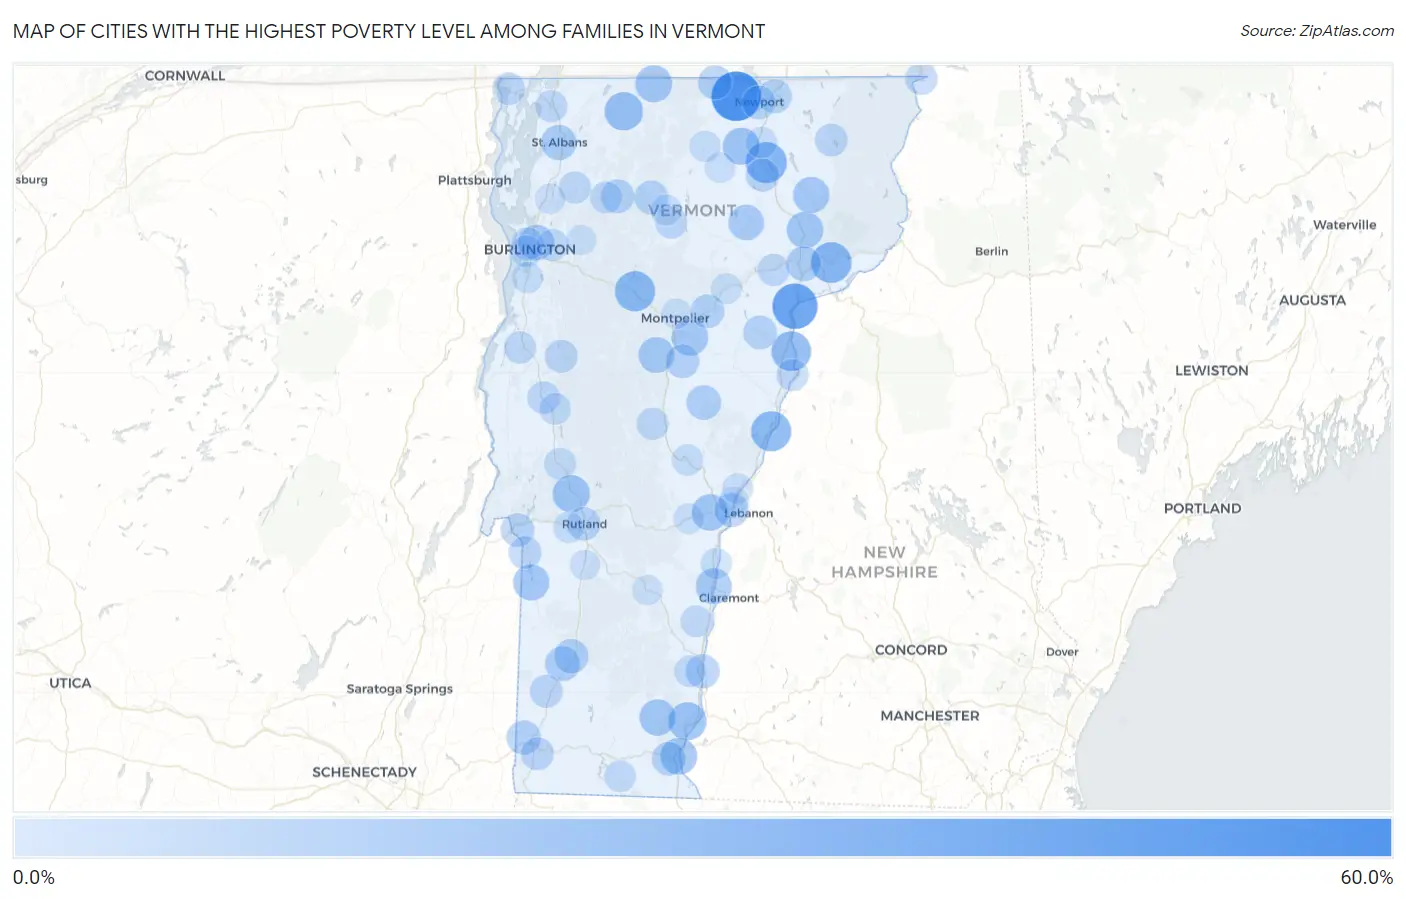
Map of Cities with the Highest Poverty Level Among Families in Vermont
0.0%
60.0%
Cities with the Highest Poverty Level Among Families in Vermont
| City | Family Poverty | vs State | vs National | |
| 1. | Newport Center | 56.0% | 5.9%(+50.1)#1 | 8.8%(+47.2)#472 |
| 2. | Barnet | 43.3% | 5.9%(+37.5)#2 | 8.8%(+34.6)#971 |
| 3. | Barton | 31.6% | 5.9%(+25.8)#3 | 8.8%(+22.9)#1,983 |
| 4. | Concord | 30.5% | 5.9%(+24.6)#4 | 8.8%(+21.7)#2,143 |
| 5. | West Pawlet | 30.0% | 5.9%(+24.1)#5 | 8.8%(+21.2)#2,226 |
| 6. | Lunenburg | 29.4% | 5.9%(+23.6)#6 | 8.8%(+20.6)#2,318 |
| 7. | Waterbury | 29.1% | 5.9%(+23.3)#7 | 8.8%(+20.3)#2,366 |
| 8. | Fairlee | 28.6% | 5.9%(+22.7)#8 | 8.8%(+19.8)#2,461 |
| 9. | Wells River | 27.7% | 5.9%(+21.8)#9 | 8.8%(+18.9)#2,631 |
| 10. | Gilman | 25.0% | 5.9%(+19.1)#10 | 8.8%(+16.2)#3,227 |
| 11. | Enosburg Falls | 24.1% | 5.9%(+18.3)#11 | 8.8%(+15.3)#3,467 |
| 12. | Algiers | 23.4% | 5.9%(+17.5)#12 | 8.8%(+14.6)#3,652 |
| 13. | Putney | 22.6% | 5.9%(+16.7)#13 | 8.8%(+13.8)#3,891 |
| 14. | Pittsford | 20.7% | 5.9%(+14.8)#14 | 8.8%(+11.9)#4,574 |
| 15. | Irasburg | 20.0% | 5.9%(+14.1)#15 | 8.8%(+11.2)#4,847 |
| 16. | Richford | 19.7% | 5.9%(+13.8)#16 | 8.8%(+10.9)#4,986 |
| 17. | Brattleboro | 19.1% | 5.9%(+13.3)#17 | 8.8%(+10.3)#5,208 |
| 18. | Lyndonville | 18.9% | 5.9%(+13.0)#18 | 8.8%(+10.1)#5,304 |
| 19. | Quechee | 18.6% | 5.9%(+12.7)#19 | 8.8%(+9.79)#5,459 |
| 20. | Newfane | 18.2% | 5.9%(+12.3)#20 | 8.8%(+9.40)#5,678 |
| 21. | Barre | 18.1% | 5.9%(+12.2)#21 | 8.8%(+9.29)#5,733 |
| 22. | West Burke | 17.9% | 5.9%(+12.1)#22 | 8.8%(+9.17)#5,797 |
| 23. | Wells | 17.2% | 5.9%(+11.3)#23 | 8.8%(+8.42)#6,173 |
| 24. | Ascutney | 17.0% | 5.9%(+11.1)#24 | 8.8%(+8.18)#6,291 |
| 25. | Northfield | 16.8% | 5.9%(+11.0)#25 | 8.8%(+8.05)#6,361 |
| 26. | Greensboro Bend | 16.1% | 5.9%(+10.3)#26 | 8.8%(+7.35)#6,756 |
| 27. | Winooski | 16.1% | 5.9%(+10.3)#27 | 8.8%(+7.34)#6,766 |
| 28. | Hartford | 16.0% | 5.9%(+10.1)#28 | 8.8%(+7.22)#6,825 |
| 29. | St Albans | 15.1% | 5.9%(+9.26)#29 | 8.8%(+6.34)#7,371 |
| 30. | Manchester | 13.8% | 5.9%(+7.91)#30 | 8.8%(+4.99)#8,365 |
| 31. | Sheffield | 13.6% | 5.9%(+7.78)#31 | 8.8%(+4.85)#8,476 |
| 32. | St Johnsbury | 13.6% | 5.9%(+7.77)#32 | 8.8%(+4.84)#8,492 |
| 33. | Chelsea | 13.4% | 5.9%(+7.53)#33 | 8.8%(+4.61)#8,632 |
| 34. | Manchester Center | 13.2% | 5.9%(+7.39)#34 | 8.8%(+4.46)#8,760 |
| 35. | North Bennington | 12.3% | 5.9%(+6.46)#35 | 8.8%(+3.53)#9,510 |
| 36. | Bolton Valley | 12.1% | 5.9%(+6.26)#36 | 8.8%(+3.34)#9,692 |
| 37. | White River Junction | 11.9% | 5.9%(+6.02)#37 | 8.8%(+3.09)#9,913 |
| 38. | Bellows Falls | 11.9% | 5.9%(+6.00)#38 | 8.8%(+3.08)#9,927 |
| 39. | North Troy | 11.7% | 5.9%(+5.81)#39 | 8.8%(+2.88)#10,101 |
| 40. | Johnson | 11.5% | 5.9%(+5.64)#40 | 8.8%(+2.71)#10,263 |
| 41. | Jeffersonville | 11.5% | 5.9%(+5.62)#41 | 8.8%(+2.69)#10,278 |
| 42. | Williamstown | 11.1% | 5.9%(+5.28)#42 | 8.8%(+2.36)#10,589 |
| 43. | Plainfield | 11.1% | 5.9%(+5.25)#43 | 8.8%(+2.33)#10,623 |
| 44. | West Brattleboro | 11.0% | 5.9%(+5.18)#44 | 8.8%(+2.26)#10,712 |
| 45. | Derby Center | 11.0% | 5.9%(+5.15)#45 | 8.8%(+2.22)#10,744 |
| 46. | Newport | 11.0% | 5.9%(+5.11)#46 | 8.8%(+2.19)#10,778 |
| 47. | Groton | 10.9% | 5.9%(+5.03)#47 | 8.8%(+2.10)#10,857 |
| 48. | Fair Haven | 10.2% | 5.9%(+4.33)#48 | 8.8%(+1.41)#11,565 |
| 49. | Rutland | 10.2% | 5.9%(+4.31)#49 | 8.8%(+1.38)#11,590 |
| 50. | Glover | 9.8% | 5.9%(+3.90)#50 | 8.8%(+0.974)#12,051 |
| 51. | Danby | 8.9% | 5.9%(+3.03)#51 | 8.8%(+0.107)#13,031 |
| 52. | Bristol | 8.7% | 5.9%(+2.84)#52 | 8.8%(-0.086)#13,244 |
| 53. | Bennington | 8.5% | 5.9%(+2.67)#53 | 8.8%(-0.257)#13,443 |
| 54. | Island Pond | 8.4% | 5.9%(+2.52)#54 | 8.8%(-0.405)#13,629 |
| 55. | Arlington | 8.4% | 5.9%(+2.50)#55 | 8.8%(-0.424)#13,655 |
| 56. | Harmonyville | 8.3% | 5.9%(+2.47)#56 | 8.8%(-0.448)#13,718 |
| 57. | Poultney | 8.1% | 5.9%(+2.26)#57 | 8.8%(-0.662)#14,019 |
| 58. | Alburgh | 7.9% | 5.9%(+2.06)#58 | 8.8%(-0.861)#14,266 |
| 59. | Burlington | 7.9% | 5.9%(+2.06)#59 | 8.8%(-0.862)#14,267 |
| 60. | Middlebury | 7.9% | 5.9%(+2.05)#60 | 8.8%(-0.874)#14,277 |
| 61. | Pawlet | 7.8% | 5.9%(+1.98)#61 | 8.8%(-0.939)#14,369 |
| 62. | Castleton Four Corners | 7.4% | 5.9%(+1.57)#62 | 8.8%(-1.35)#14,889 |
| 63. | Beecher Falls | 7.3% | 5.9%(+1.46)#63 | 8.8%(-1.46)#15,074 |
| 64. | Vergennes | 7.1% | 5.9%(+1.22)#64 | 8.8%(-1.70)#15,411 |
| 65. | Randolph | 7.0% | 5.9%(+1.18)#65 | 8.8%(-1.74)#15,463 |
| 66. | Fairfax | 6.9% | 5.9%(+1.05)#66 | 8.8%(-1.87)#15,620 |
| 67. | Newbury | 6.6% | 5.9%(+0.753)#67 | 8.8%(-2.17)#16,011 |
| 68. | Swanton | 6.5% | 5.9%(+0.621)#68 | 8.8%(-2.30)#16,190 |
| 69. | Danville | 6.4% | 5.9%(+0.563)#69 | 8.8%(-2.36)#16,269 |
| 70. | Morrisville | 6.4% | 5.9%(+0.499)#70 | 8.8%(-2.42)#16,367 |
| 71. | Cambridge | 6.2% | 5.9%(+0.391)#71 | 8.8%(-2.53)#16,555 |
| 72. | Essex Junction | 6.2% | 5.9%(+0.312)#72 | 8.8%(-2.61)#16,678 |
| 73. | Stamford | 6.1% | 5.9%(+0.263)#73 | 8.8%(-2.66)#16,749 |
| 74. | Brandon | 5.6% | 5.9%(-0.210)#74 | 8.8%(-3.13)#17,470 |
| 75. | Springfield | 5.5% | 5.9%(-0.333)#75 | 8.8%(-3.26)#17,652 |
| 76. | Saxtons River | 5.5% | 5.9%(-0.359)#76 | 8.8%(-3.28)#17,676 |
| 77. | Jacksonville | 5.4% | 5.9%(-0.502)#77 | 8.8%(-3.42)#17,900 |
| 78. | South Burlington | 5.3% | 5.9%(-0.521)#78 | 8.8%(-3.44)#17,920 |
| 79. | East Middlebury | 5.3% | 5.9%(-0.526)#79 | 8.8%(-3.45)#17,930 |
| 80. | Orleans | 5.3% | 5.9%(-0.553)#80 | 8.8%(-3.48)#17,960 |
| 81. | Lincoln | 4.8% | 5.9%(-1.02)#81 | 8.8%(-3.94)#18,730 |
| 82. | South Royalton | 4.7% | 5.9%(-1.21)#82 | 8.8%(-4.13)#19,003 |
| 83. | West Woodstock | 4.4% | 5.9%(-1.47)#83 | 8.8%(-4.40)#19,419 |
| 84. | West Rutland | 4.3% | 5.9%(-1.54)#84 | 8.8%(-4.47)#19,535 |
| 85. | Shelburne | 4.0% | 5.9%(-1.89)#85 | 8.8%(-4.81)#20,084 |
| 86. | Windsor | 3.9% | 5.9%(-1.94)#86 | 8.8%(-4.86)#20,161 |
| 87. | Lowell | 3.9% | 5.9%(-1.94)#87 | 8.8%(-4.86)#20,173 |
| 88. | Hyde Park | 3.7% | 5.9%(-2.16)#88 | 8.8%(-5.08)#20,502 |
| 89. | Albany | 3.4% | 5.9%(-2.41)#89 | 8.8%(-5.33)#20,930 |
| 90. | Norwich | 3.3% | 5.9%(-2.54)#90 | 8.8%(-5.46)#21,153 |
| 91. | Marshfield | 3.3% | 5.9%(-2.60)#91 | 8.8%(-5.52)#21,243 |
| 92. | Woodstock | 2.8% | 5.9%(-3.04)#92 | 8.8%(-5.96)#21,985 |
| 93. | Underhill Flats | 2.5% | 5.9%(-3.33)#93 | 8.8%(-6.26)#22,497 |
| 94. | Milton | 2.5% | 5.9%(-3.40)#94 | 8.8%(-6.32)#22,615 |
| 95. | St. George | 2.3% | 5.9%(-3.55)#95 | 8.8%(-6.47)#22,867 |
| 96. | Montpelier | 2.1% | 5.9%(-3.74)#96 | 8.8%(-6.66)#23,167 |
| 97. | Ludlow | 1.9% | 5.9%(-3.94)#97 | 8.8%(-6.86)#23,440 |
| 98. | Jericho | 1.8% | 5.9%(-4.09)#98 | 8.8%(-7.01)#23,677 |
| 99. | Wallingford | 1.7% | 5.9%(-4.13)#99 | 8.8%(-7.06)#23,748 |
| 100. | Wilder | 1.2% | 5.9%(-4.64)#100 | 8.8%(-7.56)#24,433 |
1
2Common Questions
What are the Top 10 Cities with the Highest Poverty Level Among Families in Vermont?
Top 10 Cities with the Highest Poverty Level Among Families in Vermont are:
#1
56.0%
#2
43.3%
#3
31.6%
#4
30.5%
#5
29.1%
#6
28.6%
#7
27.7%
#8
24.1%
#9
22.6%
#10
20.7%
What city has the Highest Poverty Level Among Families in Vermont?
Newport Center has the Highest Poverty Level Among Families in Vermont with 56.0%.
What is the Poverty Level Among Families in the State of Vermont?
Poverty Level Among Families in Vermont is 5.9%.
What is the Poverty Level Among Families in the United States?
Poverty Level Among Families in the United States is 8.8%.