Cities with the Highest Poverty Level Among Families in Utah
RELATED REPORTS & OPTIONS
Highest Family Poverty
Utah
Compare Cities
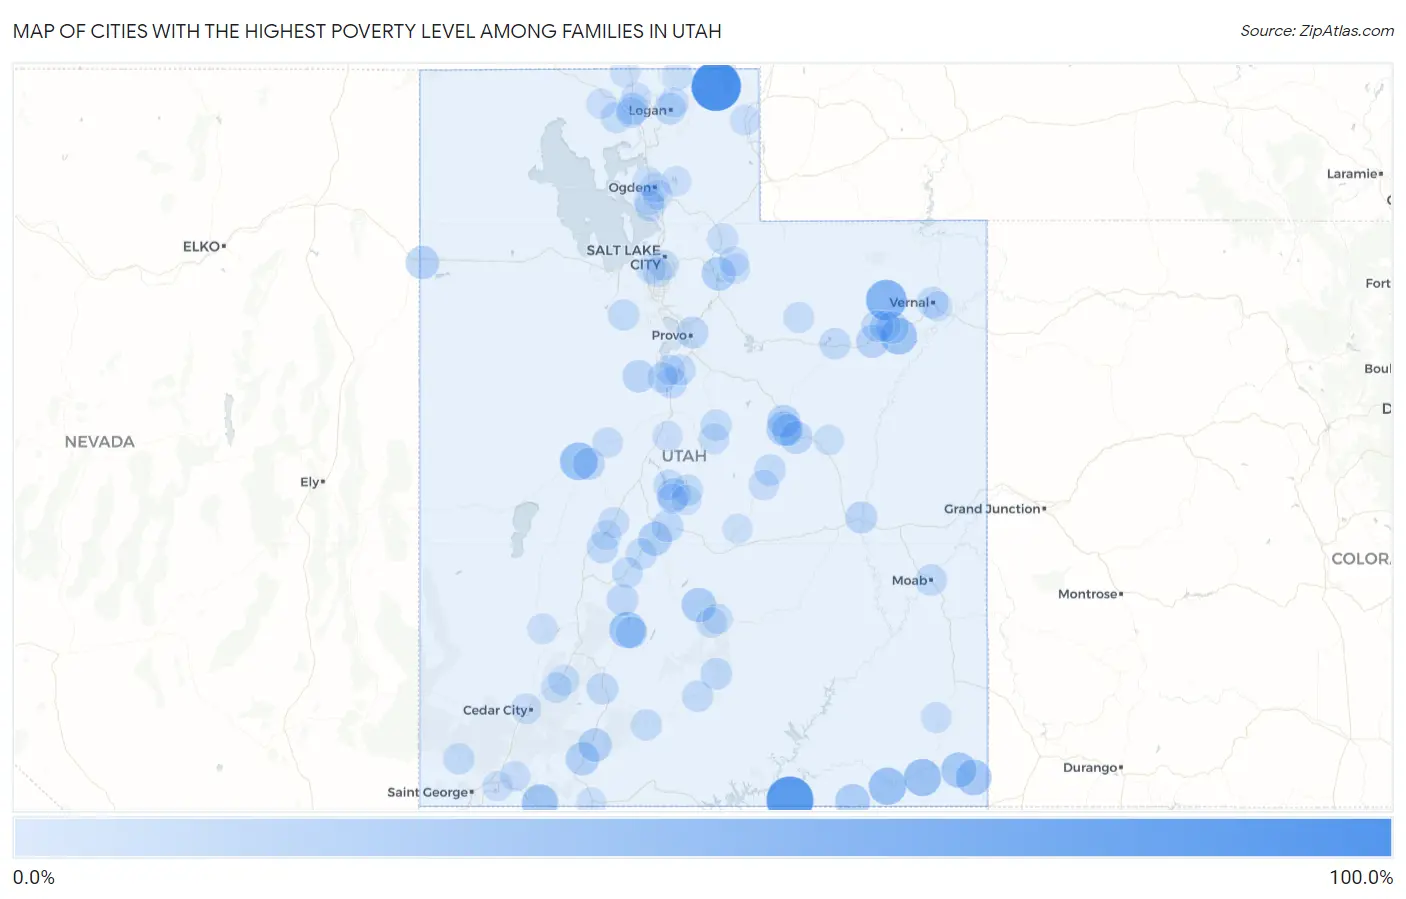
Map of Cities with the Highest Poverty Level Among Families in Utah
0.0%
100.0%
Cities with the Highest Poverty Level Among Families in Utah
| City | Family Poverty | vs State | vs National | |
| 1. | Garden | 100.0% | 5.7%(+94.3)#1 | 8.8%(+91.2)#42 |
| 2. | Navajo Mountain | 87.6% | 5.7%(+81.9)#2 | 8.8%(+78.8)#139 |
| 3. | Whiterocks | 56.1% | 5.7%(+50.4)#3 | 8.8%(+47.3)#469 |
| 4. | Sutherland | 41.5% | 5.7%(+35.9)#4 | 8.8%(+32.7)#1,095 |
| 5. | Halchita | 41.2% | 5.7%(+35.5)#5 | 8.8%(+32.4)#1,125 |
| 6. | Tselakai Dezza | 40.0% | 5.7%(+34.3)#6 | 8.8%(+31.2)#1,207 |
| 7. | Randlett | 36.8% | 5.7%(+31.2)#7 | 8.8%(+28.1)#1,444 |
| 8. | Junction | 35.7% | 5.7%(+30.1)#8 | 8.8%(+26.9)#1,532 |
| 9. | Hildale | 35.5% | 5.7%(+29.9)#9 | 8.8%(+26.8)#1,552 |
| 10. | Aneth | 32.1% | 5.7%(+26.4)#10 | 8.8%(+23.3)#1,921 |
| 11. | Montezuma Creek | 30.5% | 5.7%(+24.9)#11 | 8.8%(+21.7)#2,142 |
| 12. | Oljato Monument Valley | 27.8% | 5.7%(+22.1)#12 | 8.8%(+19.0)#2,612 |
| 13. | West Wood | 27.4% | 5.7%(+21.7)#13 | 8.8%(+18.6)#2,689 |
| 14. | Lyman | 27.1% | 5.7%(+21.5)#14 | 8.8%(+18.4)#2,740 |
| 15. | Hideout | 24.7% | 5.7%(+19.0)#15 | 8.8%(+15.9)#3,321 |
| 16. | Sigurd | 23.8% | 5.7%(+18.1)#16 | 8.8%(+15.0)#3,558 |
| 17. | Glendale | 22.6% | 5.7%(+16.9)#17 | 8.8%(+13.8)#3,890 |
| 18. | Alton | 22.4% | 5.7%(+16.8)#18 | 8.8%(+13.7)#3,925 |
| 19. | Wendover | 22.1% | 5.7%(+16.5)#19 | 8.8%(+13.4)#4,034 |
| 20. | Gunnison | 22.0% | 5.7%(+16.3)#20 | 8.8%(+13.2)#4,093 |
| 21. | Spring Glen | 20.4% | 5.7%(+14.7)#21 | 8.8%(+11.6)#4,694 |
| 22. | Myton | 20.3% | 5.7%(+14.6)#22 | 8.8%(+11.5)#4,716 |
| 23. | Wellington | 18.8% | 5.7%(+13.2)#23 | 8.8%(+10.0)#5,342 |
| 24. | Fort Duchesne | 18.4% | 5.7%(+12.8)#24 | 8.8%(+9.64)#5,537 |
| 25. | Eureka | 18.3% | 5.7%(+12.6)#25 | 8.8%(+9.49)#5,626 |
| 26. | Delta | 17.0% | 5.7%(+11.3)#26 | 8.8%(+8.21)#6,282 |
| 27. | Green River | 16.2% | 5.7%(+10.6)#27 | 8.8%(+7.46)#6,696 |
| 28. | Provo | 15.7% | 5.7%(+10.0)#28 | 8.8%(+6.92)#6,998 |
| 29. | Roosevelt | 15.7% | 5.7%(+10.0)#29 | 8.8%(+6.92)#7,002 |
| 30. | Price | 15.5% | 5.7%(+9.87)#30 | 8.8%(+6.74)#7,109 |
| 31. | Garland | 15.5% | 5.7%(+9.86)#31 | 8.8%(+6.73)#7,116 |
| 32. | Kingston | 15.5% | 5.7%(+9.84)#32 | 8.8%(+6.71)#7,126 |
| 33. | Salina | 15.5% | 5.7%(+9.81)#33 | 8.8%(+6.68)#7,149 |
| 34. | Logan | 15.0% | 5.7%(+9.32)#34 | 8.8%(+6.19)#7,486 |
| 35. | Kanosh | 14.9% | 5.7%(+9.22)#35 | 8.8%(+6.09)#7,556 |
| 36. | Boulder | 14.6% | 5.7%(+8.95)#36 | 8.8%(+5.83)#7,719 |
| 37. | Panguitch | 14.4% | 5.7%(+8.79)#37 | 8.8%(+5.66)#7,840 |
| 38. | Marysvale | 14.4% | 5.7%(+8.77)#38 | 8.8%(+5.64)#7,850 |
| 39. | Rocky Ridge | 14.0% | 5.7%(+8.38)#39 | 8.8%(+5.25)#8,166 |
| 40. | Huntington | 13.7% | 5.7%(+8.00)#40 | 8.8%(+4.87)#8,450 |
| 41. | Duchesne | 13.6% | 5.7%(+7.98)#41 | 8.8%(+4.85)#8,461 |
| 42. | Escalante | 13.6% | 5.7%(+7.96)#42 | 8.8%(+4.83)#8,497 |
| 43. | Moab | 13.4% | 5.7%(+7.71)#43 | 8.8%(+4.58)#8,657 |
| 44. | Ophir | 13.3% | 5.7%(+7.68)#44 | 8.8%(+4.55)#8,712 |
| 45. | Vernal | 13.2% | 5.7%(+7.58)#45 | 8.8%(+4.45)#8,762 |
| 46. | Veyo | 12.9% | 5.7%(+7.23)#46 | 8.8%(+4.10)#9,076 |
| 47. | Thatcher | 12.6% | 5.7%(+6.90)#47 | 8.8%(+3.77)#9,302 |
| 48. | Richfield | 12.5% | 5.7%(+6.85)#48 | 8.8%(+3.72)#9,324 |
| 49. | Sterling | 12.5% | 5.7%(+6.85)#49 | 8.8%(+3.72)#9,341 |
| 50. | Cannonville | 12.5% | 5.7%(+6.85)#50 | 8.8%(+3.72)#9,347 |
| 51. | Spring Lake | 12.3% | 5.7%(+6.64)#51 | 8.8%(+3.51)#9,537 |
| 52. | Fairview | 12.1% | 5.7%(+6.44)#52 | 8.8%(+3.32)#9,707 |
| 53. | Ballard | 12.0% | 5.7%(+6.38)#53 | 8.8%(+3.25)#9,770 |
| 54. | Joseph | 11.8% | 5.7%(+6.11)#54 | 8.8%(+2.98)#9,996 |
| 55. | Fayette | 11.3% | 5.7%(+5.61)#55 | 8.8%(+2.49)#10,502 |
| 56. | Fillmore | 11.2% | 5.7%(+5.51)#56 | 8.8%(+2.38)#10,576 |
| 57. | Paragonah | 11.0% | 5.7%(+5.34)#57 | 8.8%(+2.21)#10,753 |
| 58. | Hoytsville | 10.9% | 5.7%(+5.26)#58 | 8.8%(+2.14)#10,822 |
| 59. | Mount Pleasant | 10.9% | 5.7%(+5.26)#59 | 8.8%(+2.13)#10,827 |
| 60. | Tabiona | 10.9% | 5.7%(+5.22)#60 | 8.8%(+2.09)#10,883 |
| 61. | Clearfield | 10.6% | 5.7%(+4.98)#61 | 8.8%(+1.86)#11,082 |
| 62. | Blanding | 9.9% | 5.7%(+4.29)#62 | 8.8%(+1.17)#11,839 |
| 63. | Tremonton | 9.9% | 5.7%(+4.24)#63 | 8.8%(+1.11)#11,888 |
| 64. | Brighton | 9.9% | 5.7%(+4.24)#64 | 8.8%(+1.11)#11,899 |
| 65. | Parowan | 9.8% | 5.7%(+4.11)#65 | 8.8%(+0.986)#12,035 |
| 66. | Teasdale | 9.7% | 5.7%(+4.07)#66 | 8.8%(+0.941)#12,102 |
| 67. | Lynndyl | 9.7% | 5.7%(+4.02)#67 | 8.8%(+0.896)#12,166 |
| 68. | South Salt Lake | 9.7% | 5.7%(+4.02)#68 | 8.8%(+0.890)#12,176 |
| 69. | Randolph | 9.5% | 5.7%(+3.84)#69 | 8.8%(+0.712)#12,364 |
| 70. | Minersville | 9.3% | 5.7%(+3.64)#70 | 8.8%(+0.510)#12,576 |
| 71. | Cove | 9.3% | 5.7%(+3.61)#71 | 8.8%(+0.478)#12,609 |
| 72. | Goshen | 9.3% | 5.7%(+3.60)#72 | 8.8%(+0.469)#12,623 |
| 73. | Cedar City | 9.2% | 5.7%(+3.52)#73 | 8.8%(+0.391)#12,699 |
| 74. | Castle Dale | 9.2% | 5.7%(+3.52)#74 | 8.8%(+0.387)#12,705 |
| 75. | Sunset | 9.0% | 5.7%(+3.38)#75 | 8.8%(+0.254)#12,876 |
| 76. | Levan | 8.8% | 5.7%(+3.11)#76 | 8.8%(-0.019)#13,164 |
| 77. | Howell | 8.7% | 5.7%(+3.10)#77 | 8.8%(-0.032)#13,179 |
| 78. | North Logan | 8.7% | 5.7%(+3.06)#78 | 8.8%(-0.065)#13,222 |
| 79. | Torrey | 8.7% | 5.7%(+3.04)#79 | 8.8%(-0.086)#13,256 |
| 80. | Hurricane | 8.6% | 5.7%(+2.97)#80 | 8.8%(-0.156)#13,331 |
| 81. | Centerfield | 8.5% | 5.7%(+2.82)#81 | 8.8%(-0.313)#13,516 |
| 82. | Genola | 8.3% | 5.7%(+2.64)#82 | 8.8%(-0.493)#13,796 |
| 83. | Virgin | 8.2% | 5.7%(+2.58)#83 | 8.8%(-0.546)#13,862 |
| 84. | East Carbon | 8.2% | 5.7%(+2.56)#84 | 8.8%(-0.569)#13,886 |
| 85. | Naples | 8.2% | 5.7%(+2.54)#85 | 8.8%(-0.587)#13,919 |
| 86. | Riverside | 8.2% | 5.7%(+2.50)#86 | 8.8%(-0.626)#13,973 |
| 87. | Meadow | 8.1% | 5.7%(+2.45)#87 | 8.8%(-0.674)#14,034 |
| 88. | Mayfield | 8.0% | 5.7%(+2.38)#88 | 8.8%(-0.746)#14,124 |
| 89. | Marion | 7.9% | 5.7%(+2.28)#89 | 8.8%(-0.845)#14,246 |
| 90. | Ogden | 7.9% | 5.7%(+2.26)#90 | 8.8%(-0.872)#14,273 |
| 91. | White | 7.8% | 5.7%(+2.12)#91 | 8.8%(-1.01)#14,459 |
| 92. | West Valley City | 7.7% | 5.7%(+2.03)#92 | 8.8%(-1.10)#14,607 |
| 93. | Marriott Slaterville | 7.6% | 5.7%(+1.99)#93 | 8.8%(-1.14)#14,648 |
| 94. | Oakley | 7.6% | 5.7%(+1.98)#94 | 8.8%(-1.15)#14,656 |
| 95. | South Ogden | 7.6% | 5.7%(+1.97)#95 | 8.8%(-1.16)#14,663 |
| 96. | Huntsville | 7.6% | 5.7%(+1.95)#96 | 8.8%(-1.18)#14,690 |
| 97. | Portage | 7.5% | 5.7%(+1.89)#97 | 8.8%(-1.23)#14,750 |
| 98. | Taylorsville | 7.5% | 5.7%(+1.81)#98 | 8.8%(-1.32)#14,853 |
| 99. | Emery | 7.5% | 5.7%(+1.81)#99 | 8.8%(-1.32)#14,865 |
| 100. | Kanab | 7.4% | 5.7%(+1.70)#100 | 8.8%(-1.43)#15,006 |
Common Questions
What are the Top 10 Cities with the Highest Poverty Level Among Families in Utah?
Top 10 Cities with the Highest Poverty Level Among Families in Utah are:
#1
100.0%
#2
87.6%
#3
56.1%
#4
41.5%
#5
41.2%
#6
40.0%
#7
36.8%
#8
35.7%
#9
35.5%
#10
32.1%
What city has the Highest Poverty Level Among Families in Utah?
Garden has the Highest Poverty Level Among Families in Utah with 100.0%.
What is the Poverty Level Among Families in the State of Utah?
Poverty Level Among Families in Utah is 5.7%.
What is the Poverty Level Among Families in the United States?
Poverty Level Among Families in the United States is 8.8%.