Cities with the Highest Poverty Level Among Families in Texas
RELATED REPORTS & OPTIONS
Highest Family Poverty
Texas
Compare Cities
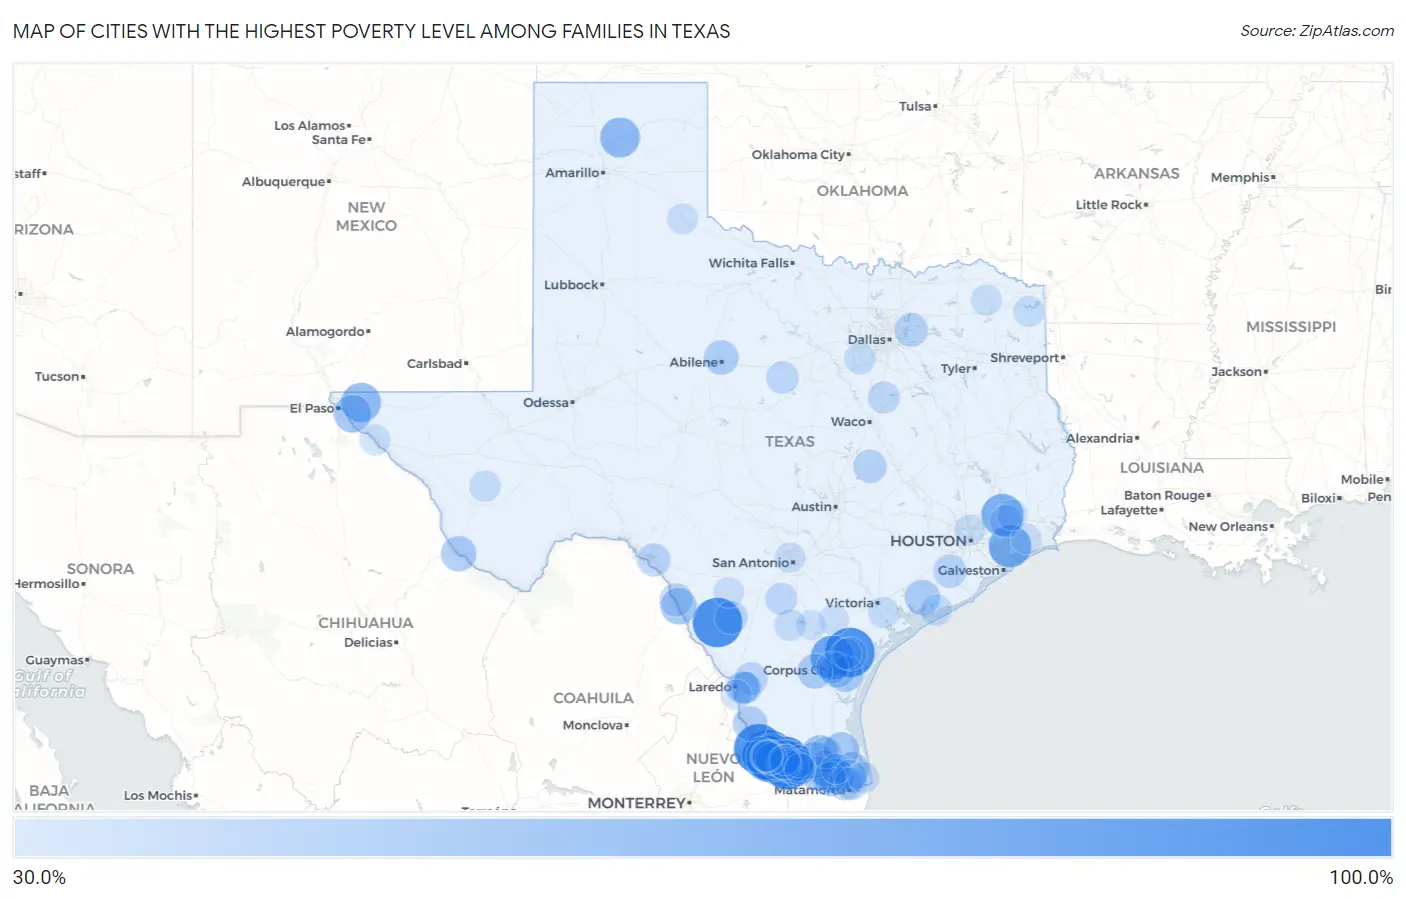
Map of Cities with the Highest Poverty Level Among Families in Texas
0.0%
100.0%
Cities with the Highest Poverty Level Among Families in Texas
| City | Family Poverty | vs State | vs National | |
| 1. | Carrizo Hill | 100.0% | 10.7%(+89.3)#1 | 8.8%(+91.2)#3 |
| 2. | Hilltop Cdp Starr County | 100.0% | 10.7%(+89.3)#2 | 8.8%(+91.2)#13 |
| 3. | La Esperanza | 100.0% | 10.7%(+89.3)#3 | 8.8%(+91.2)#15 |
| 4. | North Escobares | 100.0% | 10.7%(+89.3)#4 | 8.8%(+91.2)#21 |
| 5. | El Castillo | 100.0% | 10.7%(+89.3)#5 | 8.8%(+91.2)#37 |
| 6. | El Quiote | 100.0% | 10.7%(+89.3)#6 | 8.8%(+91.2)#45 |
| 7. | Quesada | 100.0% | 10.7%(+89.3)#7 | 8.8%(+91.2)#72 |
| 8. | Rancho Chico | 100.0% | 10.7%(+89.3)#8 | 8.8%(+91.2)#80 |
| 9. | La Loma De Falcon | 100.0% | 10.7%(+89.3)#9 | 8.8%(+91.2)#83 |
| 10. | Lopeno | 100.0% | 10.7%(+89.3)#10 | 8.8%(+91.2)#84 |
| 11. | Normandy | 100.0% | 10.7%(+89.3)#11 | 8.8%(+91.2)#88 |
| 12. | Acala | 100.0% | 10.7%(+89.3)#12 | 8.8%(+91.2)#103 |
| 13. | Los Alvarez | 95.1% | 10.7%(+84.5)#13 | 8.8%(+86.3)#123 |
| 14. | Campo Verde | 84.4% | 10.7%(+73.7)#14 | 8.8%(+75.6)#147 |
| 15. | Sandy Hollow Escondidas | 81.1% | 10.7%(+70.5)#15 | 8.8%(+72.4)#164 |
| 16. | El Socio | 76.2% | 10.7%(+65.5)#16 | 8.8%(+67.4)#191 |
| 17. | Oak Island | 75.8% | 10.7%(+65.1)#17 | 8.8%(+67.0)#195 |
| 18. | Dayton Lakes | 75.0% | 10.7%(+64.3)#18 | 8.8%(+66.2)#205 |
| 19. | Sanford | 66.7% | 10.7%(+56.0)#19 | 8.8%(+57.9)#274 |
| 20. | Salida Del Sol Estates | 66.3% | 10.7%(+55.6)#20 | 8.8%(+57.5)#285 |
| 21. | Garza Salinas Ii | 65.9% | 10.7%(+55.3)#21 | 8.8%(+57.2)#287 |
| 22. | Butterfield | 65.6% | 10.7%(+54.9)#22 | 8.8%(+56.8)#294 |
| 23. | Mcleod | 64.6% | 10.7%(+53.9)#23 | 8.8%(+55.8)#307 |
| 24. | Bledsoe | 64.0% | 10.7%(+53.3)#24 | 8.8%(+55.2)#322 |
| 25. | Salineno North | 61.1% | 10.7%(+50.4)#25 | 8.8%(+52.3)#369 |
| 26. | Sparks | 59.4% | 10.7%(+48.7)#26 | 8.8%(+50.6)#397 |
| 27. | Bluetown | 58.2% | 10.7%(+47.5)#27 | 8.8%(+49.4)#422 |
| 28. | Hargill | 57.6% | 10.7%(+47.0)#28 | 8.8%(+48.8)#427 |
| 29. | Indian Hills | 57.0% | 10.7%(+46.3)#29 | 8.8%(+48.2)#447 |
| 30. | Doolittle | 56.2% | 10.7%(+45.5)#30 | 8.8%(+47.4)#466 |
| 31. | Alto Bonito Heights | 55.6% | 10.7%(+44.9)#31 | 8.8%(+46.8)#480 |
| 32. | Fabrica | 55.3% | 10.7%(+44.6)#32 | 8.8%(+46.5)#494 |
| 33. | Fronton | 55.0% | 10.7%(+44.3)#33 | 8.8%(+46.2)#502 |
| 34. | Tierra Grande | 54.5% | 10.7%(+43.9)#34 | 8.8%(+45.8)#513 |
| 35. | La Tina Ranch | 53.9% | 10.7%(+43.3)#35 | 8.8%(+45.1)#528 |
| 36. | Sunset Cdp Starr County | 53.3% | 10.7%(+42.7)#36 | 8.8%(+44.6)#544 |
| 37. | San Perlita | 53.1% | 10.7%(+42.4)#37 | 8.8%(+44.3)#550 |
| 38. | Rangerville | 52.9% | 10.7%(+42.3)#38 | 8.8%(+44.2)#555 |
| 39. | Presidio | 52.6% | 10.7%(+41.9)#39 | 8.8%(+43.8)#568 |
| 40. | Tierra Verde | 52.0% | 10.7%(+41.3)#40 | 8.8%(+43.2)#589 |
| 41. | Blessing | 51.9% | 10.7%(+41.3)#41 | 8.8%(+43.1)#592 |
| 42. | Rancho Alegre | 51.0% | 10.7%(+40.3)#42 | 8.8%(+42.2)#618 |
| 43. | Abram | 51.0% | 10.7%(+40.3)#43 | 8.8%(+42.2)#619 |
| 44. | Scissors | 50.8% | 10.7%(+40.1)#44 | 8.8%(+42.0)#627 |
| 45. | Medina | 50.4% | 10.7%(+39.7)#45 | 8.8%(+41.6)#631 |
| 46. | Alanreed | 50.0% | 10.7%(+39.3)#46 | 8.8%(+41.2)#676 |
| 47. | Impact | 50.0% | 10.7%(+39.3)#47 | 8.8%(+41.2)#682 |
| 48. | Barrera | 49.4% | 10.7%(+38.8)#48 | 8.8%(+40.6)#697 |
| 49. | Mobile City | 47.2% | 10.7%(+36.5)#49 | 8.8%(+38.4)#792 |
| 50. | San Juan | 46.2% | 10.7%(+35.5)#50 | 8.8%(+37.4)#827 |
| 51. | Buckholts | 45.6% | 10.7%(+34.9)#51 | 8.8%(+36.8)#843 |
| 52. | La Paloma Addition | 45.5% | 10.7%(+34.8)#52 | 8.8%(+36.7)#850 |
| 53. | Damon | 45.5% | 10.7%(+34.8)#53 | 8.8%(+36.7)#852 |
| 54. | Radar Base | 45.5% | 10.7%(+34.8)#54 | 8.8%(+36.7)#854 |
| 55. | San Pedro | 45.1% | 10.7%(+34.4)#55 | 8.8%(+36.3)#875 |
| 56. | Lake View | 44.9% | 10.7%(+34.2)#56 | 8.8%(+36.1)#883 |
| 57. | Big Wells | 44.7% | 10.7%(+34.0)#57 | 8.8%(+35.9)#890 |
| 58. | Havana | 44.4% | 10.7%(+33.8)#58 | 8.8%(+35.7)#899 |
| 59. | San Carlos I | 44.4% | 10.7%(+33.8)#59 | 8.8%(+35.7)#900 |
| 60. | Indian Lake | 44.4% | 10.7%(+33.7)#60 | 8.8%(+35.6)#913 |
| 61. | Ranchitos Las Lomas | 44.3% | 10.7%(+33.6)#61 | 8.8%(+35.5)#918 |
| 62. | Ames | 43.7% | 10.7%(+33.1)#62 | 8.8%(+34.9)#940 |
| 63. | Valle Vista | 43.7% | 10.7%(+33.0)#63 | 8.8%(+34.9)#943 |
| 64. | Cameron Park | 43.2% | 10.7%(+32.6)#64 | 8.8%(+34.4)#977 |
| 65. | Gorman | 43.1% | 10.7%(+32.4)#65 | 8.8%(+34.3)#987 |
| 66. | Ranchitos East | 41.9% | 10.7%(+31.3)#66 | 8.8%(+33.2)#1,056 |
| 67. | Malone | 41.8% | 10.7%(+31.1)#67 | 8.8%(+33.0)#1,071 |
| 68. | Citrus City | 41.7% | 10.7%(+31.1)#68 | 8.8%(+33.0)#1,073 |
| 69. | Banquete | 41.6% | 10.7%(+30.9)#69 | 8.8%(+32.8)#1,090 |
| 70. | Charlotte | 41.2% | 10.7%(+30.5)#70 | 8.8%(+32.4)#1,123 |
| 71. | Doffing | 40.8% | 10.7%(+30.1)#71 | 8.8%(+32.0)#1,152 |
| 72. | East Alto Bonito | 40.2% | 10.7%(+29.5)#72 | 8.8%(+31.4)#1,191 |
| 73. | Matagorda | 40.0% | 10.7%(+29.3)#73 | 8.8%(+31.2)#1,198 |
| 74. | La Escondida | 40.0% | 10.7%(+29.3)#74 | 8.8%(+31.2)#1,200 |
| 75. | Lasara | 39.9% | 10.7%(+29.2)#75 | 8.8%(+31.1)#1,224 |
| 76. | Pueblo Nuevo | 39.8% | 10.7%(+29.2)#76 | 8.8%(+31.1)#1,229 |
| 77. | Escobares | 39.6% | 10.7%(+28.9)#77 | 8.8%(+30.8)#1,239 |
| 78. | Tilden | 39.5% | 10.7%(+28.8)#78 | 8.8%(+30.7)#1,246 |
| 79. | Fort Davis | 39.3% | 10.7%(+28.7)#79 | 8.8%(+30.6)#1,260 |
| 80. | Santa Maria | 39.3% | 10.7%(+28.6)#80 | 8.8%(+30.5)#1,262 |
| 81. | Cross Timber | 39.3% | 10.7%(+28.6)#81 | 8.8%(+30.5)#1,263 |
| 82. | Laguna Heights | 38.9% | 10.7%(+28.2)#82 | 8.8%(+30.1)#1,297 |
| 83. | Bloomington | 38.9% | 10.7%(+28.2)#83 | 8.8%(+30.1)#1,301 |
| 84. | Douglassville | 38.5% | 10.7%(+27.8)#84 | 8.8%(+29.7)#1,323 |
| 85. | Fort Hancock | 38.0% | 10.7%(+27.3)#85 | 8.8%(+29.2)#1,354 |
| 86. | Stowell | 37.7% | 10.7%(+27.0)#86 | 8.8%(+28.9)#1,368 |
| 87. | Talco | 37.6% | 10.7%(+26.9)#87 | 8.8%(+28.8)#1,373 |
| 88. | Batesville | 37.6% | 10.7%(+26.9)#88 | 8.8%(+28.8)#1,374 |
| 89. | Estelline | 37.5% | 10.7%(+26.8)#89 | 8.8%(+28.7)#1,388 |
| 90. | Palmview South | 37.3% | 10.7%(+26.6)#90 | 8.8%(+28.5)#1,410 |
| 91. | Hull | 37.3% | 10.7%(+26.6)#91 | 8.8%(+28.5)#1,412 |
| 92. | Aldine | 37.3% | 10.7%(+26.6)#92 | 8.8%(+28.5)#1,414 |
| 93. | Las Palmas Ii | 36.6% | 10.7%(+25.9)#93 | 8.8%(+27.8)#1,458 |
| 94. | Morgan Farm | 36.5% | 10.7%(+25.8)#94 | 8.8%(+27.7)#1,466 |
| 95. | Rio Bravo | 36.5% | 10.7%(+25.8)#95 | 8.8%(+27.7)#1,469 |
| 96. | Normanna | 36.4% | 10.7%(+25.7)#96 | 8.8%(+27.6)#1,485 |
| 97. | Eugenio Saenz | 35.9% | 10.7%(+25.2)#97 | 8.8%(+27.1)#1,511 |
| 98. | Balcones Heights | 35.8% | 10.7%(+25.2)#98 | 8.8%(+27.1)#1,517 |
| 99. | Garceno | 35.7% | 10.7%(+25.0)#99 | 8.8%(+26.9)#1,542 |
| 100. | Three Rivers | 35.2% | 10.7%(+24.5)#100 | 8.8%(+26.4)#1,591 |
Common Questions
What are the Top 10 Cities with the Highest Poverty Level Among Families in Texas?
Top 10 Cities with the Highest Poverty Level Among Families in Texas are:
#1
100.0%
#2
100.0%
#3
100.0%
#4
100.0%
#5
100.0%
#6
100.0%
#7
100.0%
#8
100.0%
#9
95.1%
#10
84.4%
What city has the Highest Poverty Level Among Families in Texas?
Carrizo Hill has the Highest Poverty Level Among Families in Texas with 100.0%.
What is the Poverty Level Among Families in the State of Texas?
Poverty Level Among Families in Texas is 10.7%.
What is the Poverty Level Among Families in the United States?
Poverty Level Among Families in the United States is 8.8%.