Cities with the Highest Poverty Level Among Families in Alabama
RELATED REPORTS & OPTIONS
Highest Family Poverty
Alabama
Compare Cities
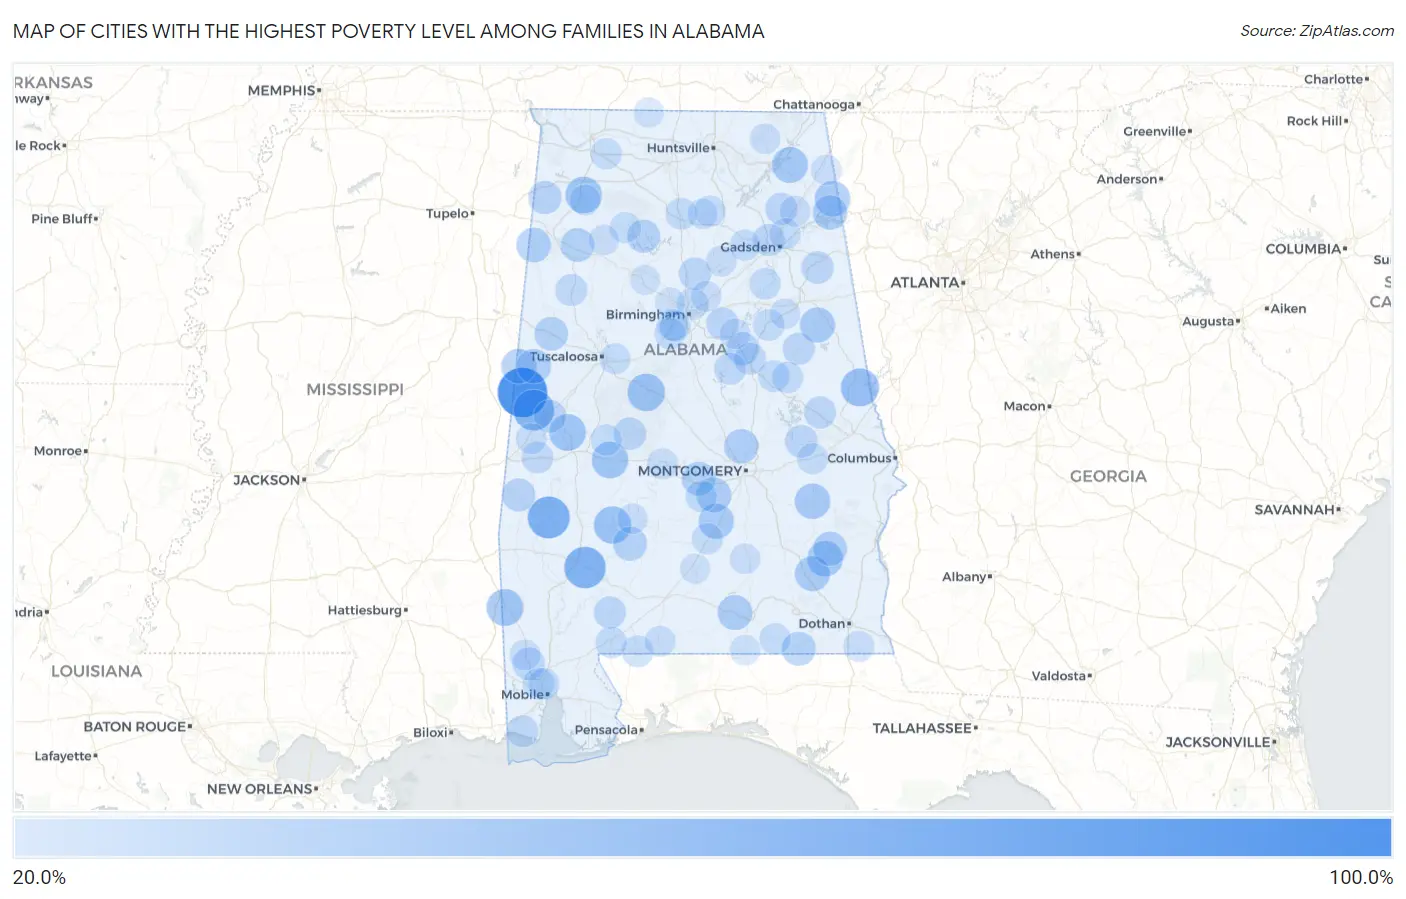
Map of Cities with the Highest Poverty Level Among Families in Alabama
0.0%
100.0%
Cities with the Highest Poverty Level Among Families in Alabama
| City | Family Poverty | vs State | vs National | |
| 1. | Panola | 100.0% | 11.3%(+88.7)#1 | 8.8%(+91.2)#57 |
| 2. | Abanda | 82.4% | 11.3%(+71.1)#2 | 8.8%(+73.6)#156 |
| 3. | Putnam | 68.8% | 11.3%(+57.5)#3 | 8.8%(+60.0)#253 |
| 4. | Whatley | 66.7% | 11.3%(+55.4)#4 | 8.8%(+57.9)#266 |
| 5. | Gainesville | 64.1% | 11.3%(+52.8)#5 | 8.8%(+55.3)#319 |
| 6. | Fredonia | 52.7% | 11.3%(+41.4)#6 | 8.8%(+43.9)#563 |
| 7. | Brent | 50.9% | 11.3%(+39.7)#7 | 8.8%(+42.2)#622 |
| 8. | Yellow Bluff | 50.0% | 11.3%(+38.7)#8 | 8.8%(+41.2)#650 |
| 9. | Fruitdale | 48.4% | 11.3%(+37.1)#9 | 8.8%(+39.6)#731 |
| 10. | Forkland | 47.5% | 11.3%(+36.2)#10 | 8.8%(+38.7)#780 |
| 11. | Uniontown | 47.1% | 11.3%(+35.8)#11 | 8.8%(+38.3)#794 |
| 12. | Spruce Pine | 47.1% | 11.3%(+35.8)#12 | 8.8%(+38.3)#795 |
| 13. | Equality | 45.8% | 11.3%(+34.5)#13 | 8.8%(+37.1)#836 |
| 14. | Dutton | 44.4% | 11.3%(+33.1)#14 | 8.8%(+35.6)#914 |
| 15. | Clio | 43.5% | 11.3%(+32.2)#15 | 8.8%(+34.7)#958 |
| 16. | Broomtown | 42.9% | 11.3%(+31.6)#16 | 8.8%(+34.1)#1,002 |
| 17. | Union Springs | 42.7% | 11.3%(+31.5)#17 | 8.8%(+34.0)#1,017 |
| 18. | Fort Deposit | 41.8% | 11.3%(+30.6)#18 | 8.8%(+33.1)#1,064 |
| 19. | Delta | 41.7% | 11.3%(+30.4)#19 | 8.8%(+32.9)#1,081 |
| 20. | Ariton | 41.3% | 11.3%(+30.0)#20 | 8.8%(+32.5)#1,111 |
| 21. | Sanford | 40.5% | 11.3%(+29.2)#21 | 8.8%(+31.7)#1,171 |
| 22. | Hayneville | 40.4% | 11.3%(+29.1)#22 | 8.8%(+31.6)#1,175 |
| 23. | Memphis | 40.0% | 11.3%(+28.7)#23 | 8.8%(+31.2)#1,218 |
| 24. | Detroit | 39.1% | 11.3%(+27.8)#24 | 8.8%(+30.3)#1,276 |
| 25. | Aliceville | 38.8% | 11.3%(+27.6)#25 | 8.8%(+30.1)#1,302 |
| 26. | Gaylesville | 38.6% | 11.3%(+27.3)#26 | 8.8%(+29.9)#1,314 |
| 27. | Elmore | 38.1% | 11.3%(+26.8)#27 | 8.8%(+29.3)#1,346 |
| 28. | Louisville | 37.1% | 11.3%(+25.8)#28 | 8.8%(+28.3)#1,421 |
| 29. | Vredenburgh | 36.8% | 11.3%(+25.6)#29 | 8.8%(+28.1)#1,439 |
| 30. | Eunola | 36.5% | 11.3%(+25.2)#30 | 8.8%(+27.8)#1,462 |
| 31. | Brilliant | 36.4% | 11.3%(+25.1)#31 | 8.8%(+27.6)#1,472 |
| 32. | White Hall | 36.2% | 11.3%(+24.9)#32 | 8.8%(+27.4)#1,495 |
| 33. | Reform | 35.7% | 11.3%(+24.4)#33 | 8.8%(+26.9)#1,545 |
| 34. | Arley | 34.1% | 11.3%(+22.9)#34 | 8.8%(+25.4)#1,694 |
| 35. | Vina | 34.1% | 11.3%(+22.8)#35 | 8.8%(+25.3)#1,704 |
| 36. | Lisman | 33.3% | 11.3%(+22.0)#36 | 8.8%(+24.6)#1,773 |
| 37. | Bon Air | 33.3% | 11.3%(+22.0)#37 | 8.8%(+24.6)#1,816 |
| 38. | Reeltown | 31.7% | 11.3%(+20.4)#38 | 8.8%(+22.9)#1,969 |
| 39. | Boligee | 31.6% | 11.3%(+20.3)#39 | 8.8%(+22.8)#1,990 |
| 40. | Chunchula | 30.8% | 11.3%(+19.5)#40 | 8.8%(+22.0)#2,107 |
| 41. | Vandiver | 30.7% | 11.3%(+19.4)#41 | 8.8%(+21.9)#2,116 |
| 42. | Nances Creek | 30.7% | 11.3%(+19.4)#42 | 8.8%(+21.9)#2,122 |
| 43. | Marion | 30.7% | 11.3%(+19.4)#43 | 8.8%(+21.9)#2,123 |
| 44. | Ashland | 30.4% | 11.3%(+19.1)#44 | 8.8%(+21.7)#2,155 |
| 45. | Trafford | 30.3% | 11.3%(+19.0)#45 | 8.8%(+21.5)#2,176 |
| 46. | Uriah | 30.0% | 11.3%(+18.7)#46 | 8.8%(+21.2)#2,223 |
| 47. | Ridgeville | 30.0% | 11.3%(+18.7)#47 | 8.8%(+21.2)#2,231 |
| 48. | Crossville | 30.0% | 11.3%(+18.7)#48 | 8.8%(+21.2)#2,243 |
| 49. | Camp Hill | 29.6% | 11.3%(+18.3)#49 | 8.8%(+20.8)#2,291 |
| 50. | Mignon | 29.0% | 11.3%(+17.8)#50 | 8.8%(+20.3)#2,376 |
| 51. | Fayette | 28.9% | 11.3%(+17.7)#51 | 8.8%(+20.2)#2,390 |
| 52. | Talladega Springs | 28.8% | 11.3%(+17.6)#52 | 8.8%(+20.1)#2,408 |
| 53. | Bayou La Batre | 28.7% | 11.3%(+17.4)#53 | 8.8%(+19.9)#2,439 |
| 54. | Bellamy | 28.0% | 11.3%(+16.7)#54 | 8.8%(+19.2)#2,569 |
| 55. | Flomaton | 27.9% | 11.3%(+16.6)#55 | 8.8%(+19.1)#2,592 |
| 56. | Talladega | 27.8% | 11.3%(+16.5)#56 | 8.8%(+19.0)#2,605 |
| 57. | Prichard | 27.8% | 11.3%(+16.5)#57 | 8.8%(+19.0)#2,622 |
| 58. | Goodwater | 27.6% | 11.3%(+16.3)#58 | 8.8%(+18.8)#2,663 |
| 59. | Tarrant | 27.5% | 11.3%(+16.2)#59 | 8.8%(+18.7)#2,677 |
| 60. | Ragland | 27.1% | 11.3%(+15.8)#60 | 8.8%(+18.3)#2,751 |
| 61. | Atmore | 27.0% | 11.3%(+15.7)#61 | 8.8%(+18.2)#2,769 |
| 62. | South Vinemont | 26.9% | 11.3%(+15.6)#62 | 8.8%(+18.1)#2,787 |
| 63. | Mosses | 26.9% | 11.3%(+15.6)#63 | 8.8%(+18.1)#2,795 |
| 64. | Brighton | 26.7% | 11.3%(+15.4)#64 | 8.8%(+17.9)#2,828 |
| 65. | Hackneyville | 26.6% | 11.3%(+15.3)#65 | 8.8%(+17.8)#2,841 |
| 66. | Greenville | 26.5% | 11.3%(+15.3)#66 | 8.8%(+17.8)#2,861 |
| 67. | Leighton | 26.3% | 11.3%(+15.0)#67 | 8.8%(+17.5)#2,935 |
| 68. | Samson | 26.2% | 11.3%(+14.9)#68 | 8.8%(+17.4)#2,942 |
| 69. | Tuskegee | 26.1% | 11.3%(+14.8)#69 | 8.8%(+17.3)#2,973 |
| 70. | Chickasaw | 26.0% | 11.3%(+14.7)#70 | 8.8%(+17.3)#2,982 |
| 71. | Lookout Mountain | 25.9% | 11.3%(+14.6)#71 | 8.8%(+17.1)#3,012 |
| 72. | Newbern | 25.9% | 11.3%(+14.6)#72 | 8.8%(+17.1)#3,016 |
| 73. | Cottondale | 25.9% | 11.3%(+14.6)#73 | 8.8%(+17.1)#3,023 |
| 74. | Baileyton | 25.9% | 11.3%(+14.6)#74 | 8.8%(+17.1)#3,029 |
| 75. | Bessemer | 25.7% | 11.3%(+14.4)#75 | 8.8%(+16.9)#3,063 |
| 76. | Double Springs | 25.5% | 11.3%(+14.3)#76 | 8.8%(+16.8)#3,101 |
| 77. | Altoona | 25.3% | 11.3%(+14.0)#77 | 8.8%(+16.5)#3,155 |
| 78. | Collinsville | 25.2% | 11.3%(+13.9)#78 | 8.8%(+16.4)#3,167 |
| 79. | Selma | 25.1% | 11.3%(+13.8)#79 | 8.8%(+16.3)#3,191 |
| 80. | Phil Campbell | 25.0% | 11.3%(+13.7)#80 | 8.8%(+16.2)#3,208 |
| 81. | East Brewton | 24.6% | 11.3%(+13.3)#81 | 8.8%(+15.8)#3,340 |
| 82. | Cottonwood | 24.6% | 11.3%(+13.3)#82 | 8.8%(+15.8)#3,342 |
| 83. | Livingston | 24.4% | 11.3%(+13.1)#83 | 8.8%(+15.6)#3,384 |
| 84. | Allgood | 24.4% | 11.3%(+13.1)#84 | 8.8%(+15.6)#3,402 |
| 85. | Lipscomb | 24.3% | 11.3%(+13.0)#85 | 8.8%(+15.5)#3,411 |
| 86. | Gulfcrest | 24.1% | 11.3%(+12.8)#86 | 8.8%(+15.4)#3,463 |
| 87. | Grayson Valley | 23.9% | 11.3%(+12.7)#87 | 8.8%(+15.2)#3,511 |
| 88. | Rutledge | 23.8% | 11.3%(+12.5)#88 | 8.8%(+15.0)#3,545 |
| 89. | Lynn | 23.7% | 11.3%(+12.4)#89 | 8.8%(+14.9)#3,588 |
| 90. | Camden | 23.6% | 11.3%(+12.3)#90 | 8.8%(+14.8)#3,601 |
| 91. | Munford | 23.6% | 11.3%(+12.3)#91 | 8.8%(+14.8)#3,602 |
| 92. | Vincent | 23.4% | 11.3%(+12.1)#92 | 8.8%(+14.6)#3,656 |
| 93. | Mentone | 23.2% | 11.3%(+11.9)#93 | 8.8%(+14.5)#3,698 |
| 94. | Fairview | 23.2% | 11.3%(+11.9)#94 | 8.8%(+14.4)#3,714 |
| 95. | Skyline | 22.8% | 11.3%(+11.5)#95 | 8.8%(+14.0)#3,808 |
| 96. | Florala | 22.6% | 11.3%(+11.3)#96 | 8.8%(+13.8)#3,882 |
| 97. | Lester | 22.5% | 11.3%(+11.2)#97 | 8.8%(+13.7)#3,913 |
| 98. | Adamsville | 22.4% | 11.3%(+11.1)#98 | 8.8%(+13.7)#3,928 |
| 99. | Georgiana | 22.2% | 11.3%(+10.9)#99 | 8.8%(+13.4)#4,026 |
| 100. | Cordova | 22.0% | 11.3%(+10.8)#100 | 8.8%(+13.3)#4,068 |
Common Questions
What are the Top 10 Cities with the Highest Poverty Level Among Families in Alabama?
Top 10 Cities with the Highest Poverty Level Among Families in Alabama are:
#1
100.0%
#2
68.8%
#3
66.7%
#4
64.1%
#5
52.7%
#6
50.9%
#7
50.0%
#8
48.4%
#9
47.5%
#10
47.1%
What city has the Highest Poverty Level Among Families in Alabama?
Panola has the Highest Poverty Level Among Families in Alabama with 100.0%.
What is the Poverty Level Among Families in the State of Alabama?
Poverty Level Among Families in Alabama is 11.3%.
What is the Poverty Level Among Families in the United States?
Poverty Level Among Families in the United States is 8.8%.