Cities with the Highest Poverty Level Among Families in South Carolina
RELATED REPORTS & OPTIONS
Highest Family Poverty
South Carolina
Compare Cities
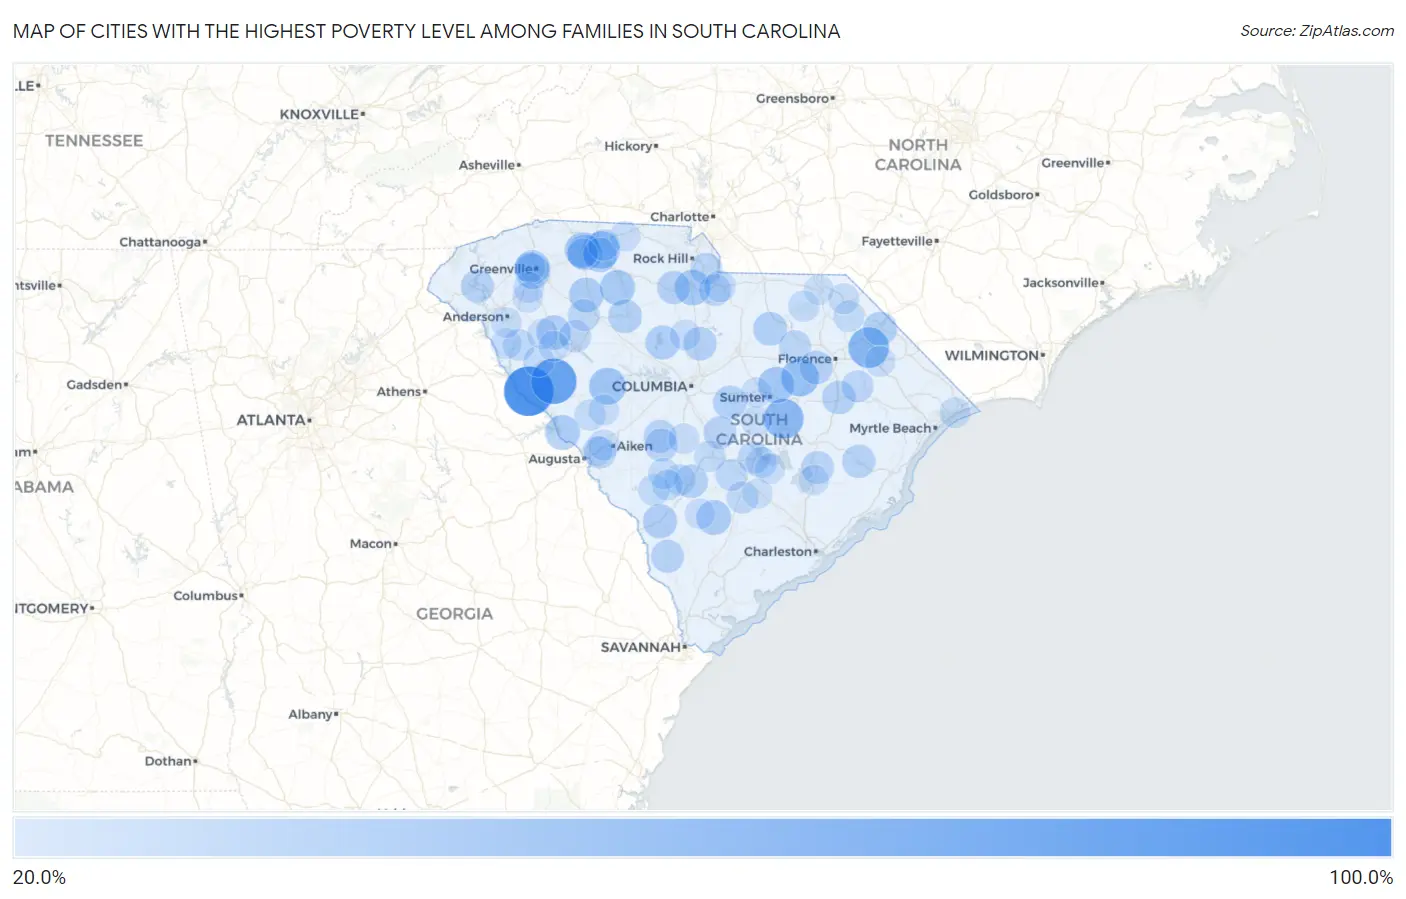
Map of Cities with the Highest Poverty Level Among Families in South Carolina
0.0%
100.0%
Cities with the Highest Poverty Level Among Families in South Carolina
| City | Family Poverty | vs State | vs National | |
| 1. | Rains | 100.0% | 10.2%(+89.8)#1 | 8.8%(+91.2)#52 |
| 2. | Willington | 100.0% | 10.2%(+89.8)#2 | 8.8%(+91.2)#58 |
| 3. | Bradley | 83.9% | 10.2%(+73.7)#3 | 8.8%(+75.1)#150 |
| 4. | Sellers | 63.6% | 10.2%(+53.4)#4 | 8.8%(+54.9)#330 |
| 5. | Cash | 61.8% | 10.2%(+51.6)#5 | 8.8%(+53.1)#358 |
| 6. | Alcolu | 60.5% | 10.2%(+50.3)#6 | 8.8%(+51.7)#376 |
| 7. | Zion | 59.5% | 10.2%(+49.3)#7 | 8.8%(+50.7)#394 |
| 8. | Little Rock | 57.0% | 10.2%(+46.9)#8 | 8.8%(+48.3)#446 |
| 9. | Manville | 52.7% | 10.2%(+42.5)#9 | 8.8%(+43.9)#560 |
| 10. | Lynchburg | 52.5% | 10.2%(+42.3)#10 | 8.8%(+43.7)#570 |
| 11. | Clifton | 51.0% | 10.2%(+40.8)#11 | 8.8%(+42.3)#617 |
| 12. | Saluda | 49.5% | 10.2%(+39.3)#12 | 8.8%(+40.7)#691 |
| 13. | Olympia | 49.4% | 10.2%(+39.2)#13 | 8.8%(+40.6)#699 |
| 14. | Oswego | 46.7% | 10.2%(+36.5)#14 | 8.8%(+37.9)#809 |
| 15. | Richburg | 44.6% | 10.2%(+34.4)#15 | 8.8%(+35.8)#893 |
| 16. | Saxon | 43.5% | 10.2%(+33.3)#16 | 8.8%(+34.8)#957 |
| 17. | Southern Shops | 42.9% | 10.2%(+32.7)#17 | 8.8%(+34.1)#996 |
| 18. | Judson | 42.6% | 10.2%(+32.4)#18 | 8.8%(+33.8)#1,024 |
| 19. | Buffalo | 42.5% | 10.2%(+32.3)#19 | 8.8%(+33.7)#1,028 |
| 20. | Clarks Hill | 41.7% | 10.2%(+31.5)#20 | 8.8%(+32.9)#1,084 |
| 21. | Williams | 41.3% | 10.2%(+31.1)#21 | 8.8%(+32.5)#1,114 |
| 22. | Enoree | 40.7% | 10.2%(+30.5)#22 | 8.8%(+31.9)#1,160 |
| 23. | City View | 40.1% | 10.2%(+29.9)#23 | 8.8%(+31.3)#1,197 |
| 24. | Ware Shoals | 39.9% | 10.2%(+29.7)#24 | 8.8%(+31.1)#1,226 |
| 25. | Glendale | 39.4% | 10.2%(+29.2)#25 | 8.8%(+30.6)#1,253 |
| 26. | Allendale | 39.1% | 10.2%(+28.9)#26 | 8.8%(+30.3)#1,282 |
| 27. | Jenkinsville | 38.5% | 10.2%(+28.3)#27 | 8.8%(+29.7)#1,327 |
| 28. | Dillon | 38.0% | 10.2%(+27.8)#28 | 8.8%(+29.2)#1,349 |
| 29. | Dovesville | 38.0% | 10.2%(+27.8)#29 | 8.8%(+29.2)#1,351 |
| 30. | Whitmire | 37.4% | 10.2%(+27.2)#30 | 8.8%(+28.6)#1,397 |
| 31. | Centenary | 37.3% | 10.2%(+27.1)#31 | 8.8%(+28.5)#1,404 |
| 32. | Bethune | 37.3% | 10.2%(+27.1)#32 | 8.8%(+28.5)#1,407 |
| 33. | Eastover | 37.2% | 10.2%(+27.0)#33 | 8.8%(+28.4)#1,416 |
| 34. | Timmonsville | 36.7% | 10.2%(+26.5)#34 | 8.8%(+27.9)#1,450 |
| 35. | Bamberg | 36.2% | 10.2%(+26.0)#35 | 8.8%(+27.4)#1,493 |
| 36. | Ridgeway | 35.9% | 10.2%(+25.7)#36 | 8.8%(+27.1)#1,512 |
| 37. | Scranton | 35.9% | 10.2%(+25.7)#37 | 8.8%(+27.1)#1,515 |
| 38. | Eureka Mill | 35.7% | 10.2%(+25.5)#38 | 8.8%(+26.9)#1,529 |
| 39. | Andrews | 34.9% | 10.2%(+24.7)#39 | 8.8%(+26.1)#1,617 |
| 40. | Newry | 34.6% | 10.2%(+24.4)#40 | 8.8%(+25.8)#1,645 |
| 41. | Estill | 34.3% | 10.2%(+24.1)#41 | 8.8%(+25.5)#1,679 |
| 42. | Perry | 33.8% | 10.2%(+23.6)#42 | 8.8%(+25.0)#1,733 |
| 43. | Salley | 33.8% | 10.2%(+23.6)#43 | 8.8%(+25.0)#1,735 |
| 44. | Dale | 33.6% | 10.2%(+23.4)#44 | 8.8%(+24.9)#1,753 |
| 45. | St Matthews | 33.3% | 10.2%(+23.1)#45 | 8.8%(+24.6)#1,765 |
| 46. | St Stephen | 33.3% | 10.2%(+23.1)#46 | 8.8%(+24.6)#1,767 |
| 47. | Waterloo | 31.7% | 10.2%(+21.5)#47 | 8.8%(+22.9)#1,982 |
| 48. | Daviston | 31.6% | 10.2%(+21.4)#48 | 8.8%(+22.8)#1,991 |
| 49. | Dunbar | 31.5% | 10.2%(+21.3)#49 | 8.8%(+22.7)#2,001 |
| 50. | Santee | 31.2% | 10.2%(+21.0)#50 | 8.8%(+22.4)#2,048 |
| 51. | Hamer | 30.9% | 10.2%(+20.7)#51 | 8.8%(+22.1)#2,086 |
| 52. | Catawba | 30.8% | 10.2%(+20.6)#52 | 8.8%(+22.0)#2,096 |
| 53. | Langley | 30.8% | 10.2%(+20.6)#53 | 8.8%(+22.0)#2,104 |
| 54. | Irwin | 30.7% | 10.2%(+20.5)#54 | 8.8%(+21.9)#2,115 |
| 55. | Lydia | 30.6% | 10.2%(+20.5)#55 | 8.8%(+21.9)#2,130 |
| 56. | Pamplico | 30.6% | 10.2%(+20.4)#56 | 8.8%(+21.8)#2,137 |
| 57. | St George | 30.3% | 10.2%(+20.1)#57 | 8.8%(+21.5)#2,180 |
| 58. | Grover | 30.1% | 10.2%(+19.9)#58 | 8.8%(+21.3)#2,209 |
| 59. | Watts Mills | 30.0% | 10.2%(+19.9)#59 | 8.8%(+21.3)#2,218 |
| 60. | Antreville | 29.5% | 10.2%(+19.4)#60 | 8.8%(+20.8)#2,304 |
| 61. | Bowman | 29.4% | 10.2%(+19.2)#61 | 8.8%(+20.6)#2,329 |
| 62. | Lancaster | 29.1% | 10.2%(+19.0)#62 | 8.8%(+20.4)#2,362 |
| 63. | Barnwell | 28.8% | 10.2%(+18.6)#63 | 8.8%(+20.0)#2,415 |
| 64. | Cowpens | 28.1% | 10.2%(+17.9)#64 | 8.8%(+19.3)#2,549 |
| 65. | Orangeburg | 28.0% | 10.2%(+17.8)#65 | 8.8%(+19.2)#2,561 |
| 66. | Vance | 28.0% | 10.2%(+17.8)#66 | 8.8%(+19.2)#2,570 |
| 67. | Denmark | 27.9% | 10.2%(+17.7)#67 | 8.8%(+19.2)#2,580 |
| 68. | Edgefield | 27.9% | 10.2%(+17.7)#68 | 8.8%(+19.1)#2,598 |
| 69. | Abbeville | 27.5% | 10.2%(+17.3)#69 | 8.8%(+18.8)#2,664 |
| 70. | Blenheim | 27.3% | 10.2%(+17.1)#70 | 8.8%(+18.5)#2,725 |
| 71. | Blackville | 27.2% | 10.2%(+17.0)#71 | 8.8%(+18.4)#2,734 |
| 72. | Patrick | 27.0% | 10.2%(+16.8)#72 | 8.8%(+18.2)#2,758 |
| 73. | Hilda | 26.9% | 10.2%(+16.7)#73 | 8.8%(+18.1)#2,802 |
| 74. | Graniteville | 26.8% | 10.2%(+16.6)#74 | 8.8%(+18.0)#2,815 |
| 75. | Unity | 26.6% | 10.2%(+16.4)#75 | 8.8%(+17.8)#2,855 |
| 76. | Atlantic Beach | 26.5% | 10.2%(+16.3)#76 | 8.8%(+17.7)#2,866 |
| 77. | Piedmont | 26.3% | 10.2%(+16.1)#77 | 8.8%(+17.5)#2,914 |
| 78. | Parker | 26.1% | 10.2%(+15.9)#78 | 8.8%(+17.3)#2,960 |
| 79. | North | 26.0% | 10.2%(+15.8)#79 | 8.8%(+17.2)#3,006 |
| 80. | Bennettsville | 26.0% | 10.2%(+15.8)#80 | 8.8%(+17.2)#3,008 |
| 81. | Iva | 25.9% | 10.2%(+15.7)#81 | 8.8%(+17.1)#3,014 |
| 82. | Johnston | 25.9% | 10.2%(+15.7)#82 | 8.8%(+17.1)#3,028 |
| 83. | Winnsboro | 25.6% | 10.2%(+15.4)#83 | 8.8%(+16.8)#3,088 |
| 84. | Marion | 25.5% | 10.2%(+15.3)#84 | 8.8%(+16.7)#3,108 |
| 85. | Homeland Park | 25.5% | 10.2%(+15.3)#85 | 8.8%(+16.7)#3,110 |
| 86. | Donalds | 25.3% | 10.2%(+15.1)#86 | 8.8%(+16.5)#3,164 |
| 87. | Edmund | 25.0% | 10.2%(+14.8)#87 | 8.8%(+16.2)#3,201 |
| 88. | Hodges | 25.0% | 10.2%(+14.8)#88 | 8.8%(+16.2)#3,234 |
| 89. | Lodge | 25.0% | 10.2%(+14.8)#89 | 8.8%(+16.2)#3,236 |
| 90. | Pinewood | 24.8% | 10.2%(+14.6)#90 | 8.8%(+16.0)#3,306 |
| 91. | West Pelzer | 24.7% | 10.2%(+14.6)#91 | 8.8%(+16.0)#3,307 |
| 92. | Arcadia | 24.7% | 10.2%(+14.5)#92 | 8.8%(+15.9)#3,324 |
| 93. | Cherryvale | 24.6% | 10.2%(+14.4)#93 | 8.8%(+15.8)#3,341 |
| 94. | Bonneau | 24.5% | 10.2%(+14.3)#94 | 8.8%(+15.7)#3,372 |
| 95. | Eutawville | 24.2% | 10.2%(+14.1)#95 | 8.8%(+15.5)#3,431 |
| 96. | East Gaffney | 24.2% | 10.2%(+14.0)#96 | 8.8%(+15.4)#3,435 |
| 97. | Burnettown | 23.8% | 10.2%(+13.6)#97 | 8.8%(+15.0)#3,560 |
| 98. | Cheraw | 23.5% | 10.2%(+13.3)#98 | 8.8%(+14.7)#3,625 |
| 99. | East Camden | 23.5% | 10.2%(+13.3)#99 | 8.8%(+14.7)#3,629 |
| 100. | Harleyville | 23.5% | 10.2%(+13.3)#100 | 8.8%(+14.7)#3,635 |
Common Questions
What are the Top 10 Cities with the Highest Poverty Level Among Families in South Carolina?
Top 10 Cities with the Highest Poverty Level Among Families in South Carolina are:
What city has the Highest Poverty Level Among Families in South Carolina?
Willington has the Highest Poverty Level Among Families in South Carolina with 100.0%.
What is the Poverty Level Among Families in the State of South Carolina?
Poverty Level Among Families in South Carolina is 10.2%.
What is the Poverty Level Among Families in the United States?
Poverty Level Among Families in the United States is 8.8%.