Cities with the Highest Poverty Level Among Families in New Mexico
RELATED REPORTS & OPTIONS
Highest Family Poverty
New Mexico
Compare Cities
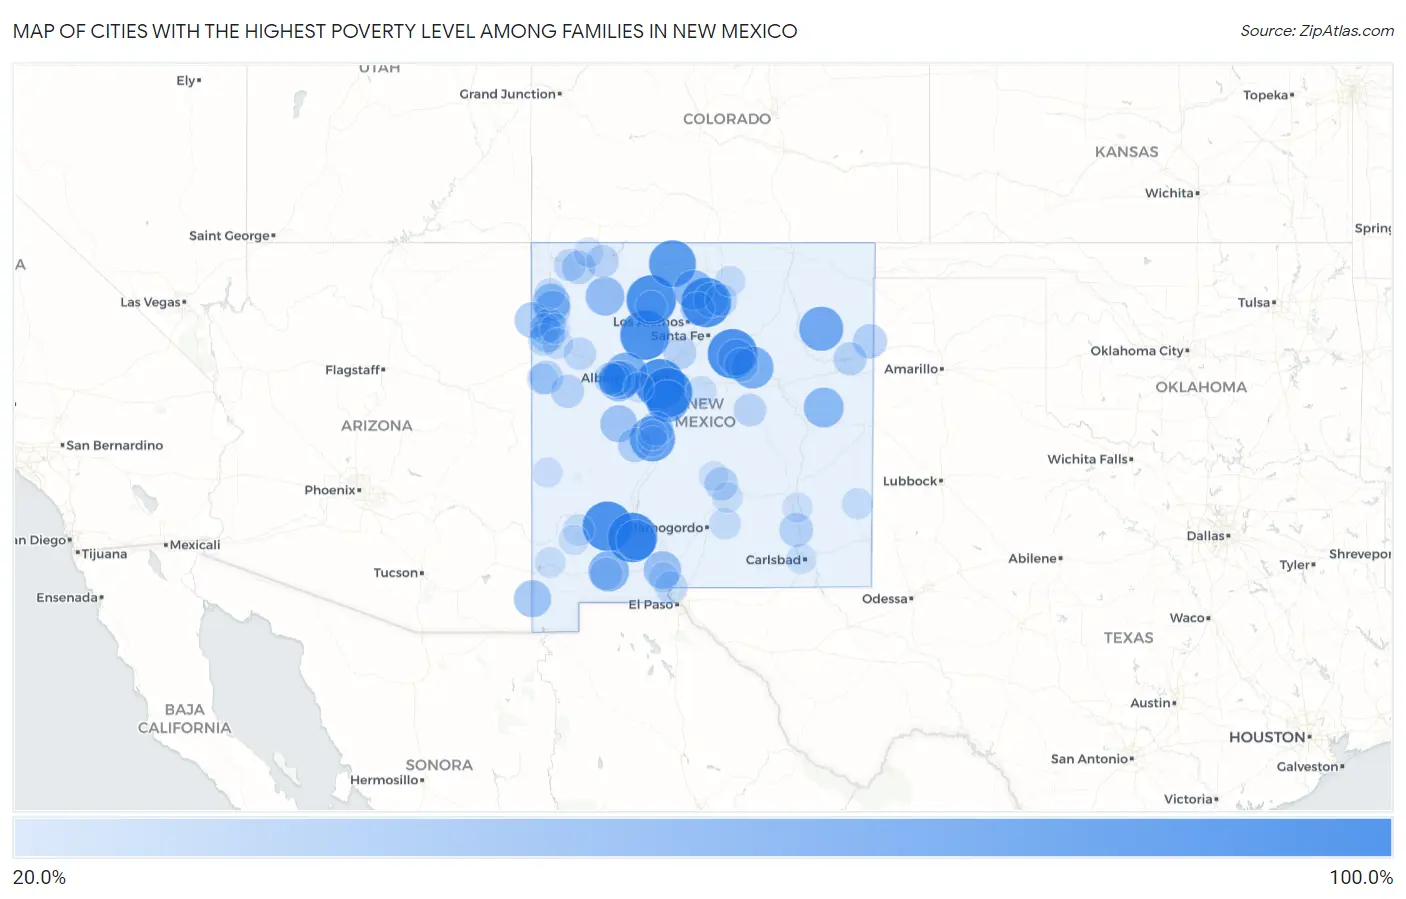
Map of Cities with the Highest Poverty Level Among Families in New Mexico
0.0%
100.0%
Cities with the Highest Poverty Level Among Families in New Mexico
| City | Family Poverty | vs State | vs National | |
| 1. | Placitas Cdp Dona Ana County | 100.0% | 13.7%(+86.3)#1 | 8.8%(+91.2)#5 |
| 2. | Homer C Jones | 100.0% | 13.7%(+86.3)#2 | 8.8%(+91.2)#10 |
| 3. | Velarde | 100.0% | 13.7%(+86.3)#3 | 8.8%(+91.2)#12 |
| 4. | Soham | 100.0% | 13.7%(+86.3)#4 | 8.8%(+91.2)#17 |
| 5. | Pajarito Mesa | 100.0% | 13.7%(+86.3)#5 | 8.8%(+91.2)#18 |
| 6. | Chical | 100.0% | 13.7%(+86.3)#6 | 8.8%(+91.2)#19 |
| 7. | Medanales | 100.0% | 13.7%(+86.3)#7 | 8.8%(+91.2)#27 |
| 8. | San Luis | 100.0% | 13.7%(+86.3)#8 | 8.8%(+91.2)#29 |
| 9. | Kingston | 100.0% | 13.7%(+86.3)#9 | 8.8%(+91.2)#53 |
| 10. | Garfield | 100.0% | 13.7%(+86.3)#11 | 8.8%(+91.2)#61 |
| 11. | Encantado | 100.0% | 13.7%(+86.3)#12 | 8.8%(+91.2)#62 |
| 12. | Regina | 100.0% | 13.7%(+86.3)#13 | 8.8%(+91.2)#67 |
| 13. | Tierra Amarilla | 90.7% | 13.7%(+77.0)#14 | 8.8%(+81.9)#133 |
| 14. | Polvadera | 84.0% | 13.7%(+70.3)#15 | 8.8%(+75.2)#149 |
| 15. | Mosquero | 80.0% | 13.7%(+66.3)#16 | 8.8%(+71.2)#169 |
| 16. | Ojo Encino | 77.3% | 13.7%(+63.6)#17 | 8.8%(+68.5)#183 |
| 17. | Totah Vista | 77.1% | 13.7%(+63.4)#18 | 8.8%(+68.3)#186 |
| 18. | Monterey Park | 73.6% | 13.7%(+59.9)#19 | 8.8%(+64.8)#212 |
| 19. | Paguate | 73.1% | 13.7%(+59.5)#20 | 8.8%(+64.4)#216 |
| 20. | Tecolotito | 72.3% | 13.7%(+58.6)#21 | 8.8%(+63.5)#226 |
| 21. | Pinedale | 68.0% | 13.7%(+54.3)#22 | 8.8%(+59.3)#258 |
| 22. | Manuelito | 66.7% | 13.7%(+53.0)#23 | 8.8%(+57.9)#277 |
| 23. | Ventura | 66.5% | 13.7%(+52.8)#24 | 8.8%(+57.7)#284 |
| 24. | Salem | 65.6% | 13.7%(+51.9)#25 | 8.8%(+56.8)#292 |
| 25. | Borrego Pass | 65.0% | 13.7%(+51.3)#26 | 8.8%(+56.2)#298 |
| 26. | Lybrook | 64.6% | 13.7%(+50.9)#27 | 8.8%(+55.8)#306 |
| 27. | House | 64.3% | 13.7%(+50.6)#28 | 8.8%(+55.5)#316 |
| 28. | Seama | 64.2% | 13.7%(+50.5)#29 | 8.8%(+55.4)#318 |
| 29. | El Rito | 63.8% | 13.7%(+50.1)#30 | 8.8%(+55.0)#325 |
| 30. | Nageezi | 59.7% | 13.7%(+46.0)#31 | 8.8%(+50.9)#388 |
| 31. | Paraje | 58.7% | 13.7%(+45.1)#32 | 8.8%(+50.0)#409 |
| 32. | Sheep Springs | 56.2% | 13.7%(+42.5)#33 | 8.8%(+47.4)#467 |
| 33. | University Park | 55.8% | 13.7%(+42.1)#34 | 8.8%(+47.0)#475 |
| 34. | Rodeo | 54.2% | 13.7%(+40.5)#35 | 8.8%(+45.4)#525 |
| 35. | Alamo | 53.0% | 13.7%(+39.3)#36 | 8.8%(+44.2)#553 |
| 36. | Prewitt | 52.7% | 13.7%(+39.0)#37 | 8.8%(+43.9)#561 |
| 37. | Ribera | 52.1% | 13.7%(+38.4)#38 | 8.8%(+43.3)#587 |
| 38. | Naschitti | 50.0% | 13.7%(+36.3)#39 | 8.8%(+41.2)#642 |
| 39. | North Acomita Village | 50.0% | 13.7%(+36.3)#40 | 8.8%(+41.2)#646 |
| 40. | Candy Kitchen | 50.0% | 13.7%(+36.3)#41 | 8.8%(+41.2)#662 |
| 41. | La Bajada | 50.0% | 13.7%(+36.3)#42 | 8.8%(+41.2)#681 |
| 42. | Navajo | 49.3% | 13.7%(+35.6)#43 | 8.8%(+40.5)#703 |
| 43. | Dixon | 45.9% | 13.7%(+32.2)#44 | 8.8%(+37.1)#832 |
| 44. | Twin Lakes | 45.2% | 13.7%(+31.5)#45 | 8.8%(+36.4)#871 |
| 45. | Magdalena | 43.6% | 13.7%(+30.0)#46 | 8.8%(+34.9)#947 |
| 46. | La Joya | 43.6% | 13.7%(+29.9)#47 | 8.8%(+34.8)#954 |
| 47. | Nara Visa | 43.2% | 13.7%(+29.5)#48 | 8.8%(+34.4)#983 |
| 48. | El Duende | 42.9% | 13.7%(+29.2)#49 | 8.8%(+34.1)#999 |
| 49. | Tohatchi | 42.5% | 13.7%(+28.8)#50 | 8.8%(+33.7)#1,031 |
| 50. | Morningside | 42.1% | 13.7%(+28.4)#51 | 8.8%(+33.3)#1,051 |
| 51. | Villanueva | 41.8% | 13.7%(+28.1)#52 | 8.8%(+33.0)#1,069 |
| 52. | Black Rock | 41.2% | 13.7%(+27.6)#53 | 8.8%(+32.5)#1,118 |
| 53. | Napi Headquarters | 40.7% | 13.7%(+27.1)#54 | 8.8%(+32.0)#1,155 |
| 54. | Haystack | 40.7% | 13.7%(+27.1)#55 | 8.8%(+32.0)#1,156 |
| 55. | South Acomita Village | 40.7% | 13.7%(+27.1)#56 | 8.8%(+32.0)#1,158 |
| 56. | Pinehill | 40.2% | 13.7%(+26.5)#57 | 8.8%(+31.4)#1,189 |
| 57. | Logan | 40.1% | 13.7%(+26.4)#58 | 8.8%(+31.3)#1,196 |
| 58. | Nogal | 40.0% | 13.7%(+26.3)#59 | 8.8%(+31.2)#1,205 |
| 59. | San Felipe Pueblo | 39.5% | 13.7%(+25.8)#60 | 8.8%(+30.7)#1,247 |
| 60. | Sagar | 39.4% | 13.7%(+25.7)#61 | 8.8%(+30.6)#1,252 |
| 61. | Dona Ana | 38.7% | 13.7%(+25.0)#62 | 8.8%(+29.9)#1,310 |
| 62. | Vaughn | 38.5% | 13.7%(+24.8)#63 | 8.8%(+29.7)#1,322 |
| 63. | Blanco | 38.3% | 13.7%(+24.6)#64 | 8.8%(+29.5)#1,333 |
| 64. | La Hacienda | 37.4% | 13.7%(+23.8)#65 | 8.8%(+28.7)#1,394 |
| 65. | Thoreau | 37.4% | 13.7%(+23.7)#66 | 8.8%(+28.6)#1,399 |
| 66. | Anthony | 37.4% | 13.7%(+23.7)#67 | 8.8%(+28.6)#1,400 |
| 67. | Torreon Cdp Sandoval County | 37.1% | 13.7%(+23.4)#68 | 8.8%(+28.3)#1,420 |
| 68. | Ojo Amarillo | 36.6% | 13.7%(+22.9)#69 | 8.8%(+27.9)#1,455 |
| 69. | Mccartys Village | 36.4% | 13.7%(+22.7)#70 | 8.8%(+27.6)#1,473 |
| 70. | Picuris Pueblo | 36.4% | 13.7%(+22.7)#71 | 8.8%(+27.6)#1,478 |
| 71. | Rock Springs | 34.5% | 13.7%(+20.8)#72 | 8.8%(+25.7)#1,659 |
| 72. | Las Tusas | 34.1% | 13.7%(+20.5)#73 | 8.8%(+25.4)#1,697 |
| 73. | Nakaibito | 33.9% | 13.7%(+20.2)#74 | 8.8%(+25.1)#1,729 |
| 74. | Becenti | 33.3% | 13.7%(+19.6)#75 | 8.8%(+24.6)#1,785 |
| 75. | Twin Forks | 33.3% | 13.7%(+19.6)#76 | 8.8%(+24.6)#1,787 |
| 76. | Pinos Altos | 33.3% | 13.7%(+19.6)#77 | 8.8%(+24.6)#1,790 |
| 77. | Tatum | 32.6% | 13.7%(+18.9)#78 | 8.8%(+23.8)#1,877 |
| 78. | Newcomb | 32.4% | 13.7%(+18.7)#79 | 8.8%(+23.7)#1,895 |
| 79. | Zuni Pueblo | 32.4% | 13.7%(+18.7)#80 | 8.8%(+23.6)#1,900 |
| 80. | Church Rock | 32.2% | 13.7%(+18.5)#81 | 8.8%(+23.4)#1,914 |
| 81. | La Jara | 31.7% | 13.7%(+18.0)#82 | 8.8%(+22.9)#1,967 |
| 82. | Taos Pueblo | 31.6% | 13.7%(+17.9)#83 | 8.8%(+22.8)#1,985 |
| 83. | Glen Acres | 31.2% | 13.7%(+17.6)#84 | 8.8%(+22.5)#2,033 |
| 84. | Mcintosh | 31.2% | 13.7%(+17.5)#85 | 8.8%(+22.4)#2,043 |
| 85. | Ruidoso Downs | 30.9% | 13.7%(+17.2)#86 | 8.8%(+22.1)#2,085 |
| 86. | Highland Meadows | 30.3% | 13.7%(+16.6)#87 | 8.8%(+21.5)#2,182 |
| 87. | Lemitar | 30.2% | 13.7%(+16.5)#88 | 8.8%(+21.4)#2,194 |
| 88. | Gamerco | 30.1% | 13.7%(+16.4)#89 | 8.8%(+21.3)#2,206 |
| 89. | San Miguel | 30.1% | 13.7%(+16.4)#90 | 8.8%(+21.3)#2,207 |
| 90. | Brimhall Nizhoni | 29.9% | 13.7%(+16.2)#91 | 8.8%(+21.1)#2,258 |
| 91. | North Light Plant | 29.8% | 13.7%(+16.1)#92 | 8.8%(+21.0)#2,272 |
| 92. | Crouch Mesa | 29.8% | 13.7%(+16.1)#93 | 8.8%(+21.0)#2,274 |
| 93. | Happy Valley | 29.7% | 13.7%(+16.0)#94 | 8.8%(+20.9)#2,279 |
| 94. | Tyrone | 29.5% | 13.7%(+15.8)#95 | 8.8%(+20.7)#2,309 |
| 95. | Reserve | 29.4% | 13.7%(+15.7)#96 | 8.8%(+20.6)#2,316 |
| 96. | Dexter | 29.3% | 13.7%(+15.6)#97 | 8.8%(+20.5)#2,339 |
| 97. | Carrizozo | 29.2% | 13.7%(+15.5)#98 | 8.8%(+20.4)#2,350 |
| 98. | Alamillo | 29.2% | 13.7%(+15.5)#99 | 8.8%(+20.4)#2,357 |
| 99. | Iyanbito | 28.6% | 13.7%(+14.9)#100 | 8.8%(+19.8)#2,447 |
| 100. | Penasco | 28.6% | 13.7%(+14.9)#101 | 8.8%(+19.8)#2,450 |
Common Questions
What are the Top 10 Cities with the Highest Poverty Level Among Families in New Mexico?
Top 10 Cities with the Highest Poverty Level Among Families in New Mexico are:
#1
100.0%
#2
100.0%
#3
100.0%
#4
100.0%
#5
100.0%
#6
100.0%
#7
100.0%
#8
100.0%
#9
90.7%
#10
84.0%
What city has the Highest Poverty Level Among Families in New Mexico?
Velarde has the Highest Poverty Level Among Families in New Mexico with 100.0%.
What is the Poverty Level Among Families in the State of New Mexico?
Poverty Level Among Families in New Mexico is 13.7%.
What is the Poverty Level Among Families in the United States?
Poverty Level Among Families in the United States is 8.8%.