Cities with the Highest Poverty Level Among Families in Maryland
RELATED REPORTS & OPTIONS
Highest Family Poverty
Maryland
Compare Cities
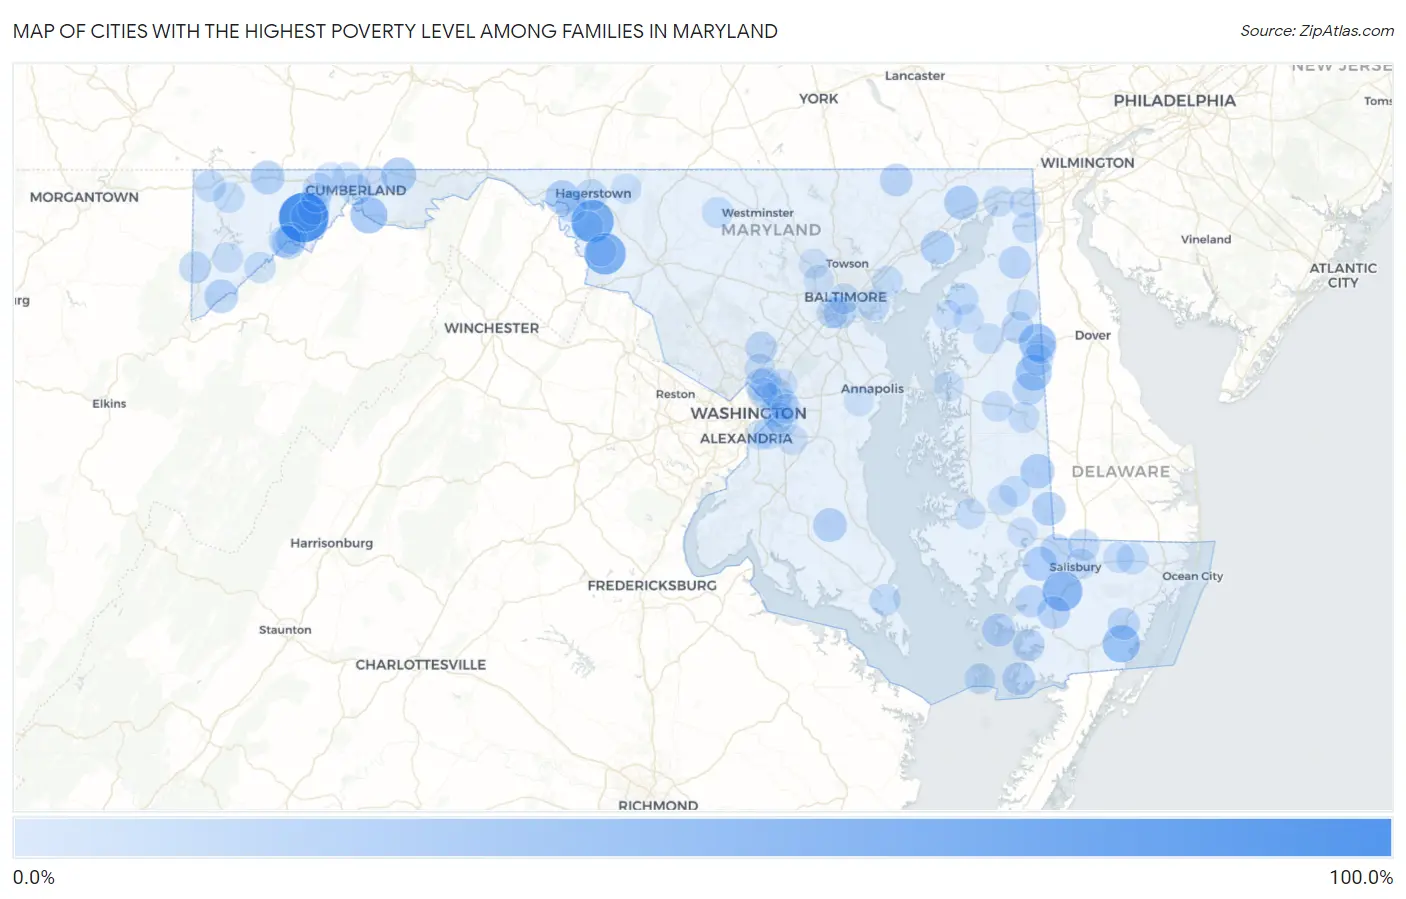
Map of Cities with the Highest Poverty Level Among Families in Maryland
0.0%
100.0%
Cities with the Highest Poverty Level Among Families in Maryland
| City | Family Poverty | vs State | vs National | |
| 1. | Detmold | 100.0% | 6.2%(+93.8)#1 | 8.8%(+91.2)#51 |
| 2. | Breathedsville | 66.7% | 6.2%(+60.5)#2 | 8.8%(+57.9)#267 |
| 3. | Rohrersville | 61.8% | 6.2%(+55.5)#3 | 8.8%(+53.0)#359 |
| 4. | Eden | 53.9% | 6.2%(+47.7)#4 | 8.8%(+45.1)#529 |
| 5. | Girdletree | 42.9% | 6.2%(+36.6)#5 | 8.8%(+34.1)#1,005 |
| 6. | Templeville | 42.4% | 6.2%(+36.2)#6 | 8.8%(+33.6)#1,032 |
| 7. | Spring Gap | 40.0% | 6.2%(+33.8)#7 | 8.8%(+31.2)#1,215 |
| 8. | Goldsboro | 36.4% | 6.2%(+30.1)#8 | 8.8%(+27.6)#1,475 |
| 9. | Flintstone | 31.8% | 6.2%(+25.6)#9 | 8.8%(+23.0)#1,953 |
| 10. | Ten Mile Creek | 30.7% | 6.2%(+24.5)#10 | 8.8%(+21.9)#2,118 |
| 11. | Pinesburg | 28.9% | 6.2%(+22.7)#11 | 8.8%(+20.1)#2,397 |
| 12. | Federalsburg | 28.5% | 6.2%(+22.3)#12 | 8.8%(+19.7)#2,480 |
| 13. | Quantico | 28.4% | 6.2%(+22.1)#13 | 8.8%(+19.6)#2,500 |
| 14. | Port Deposit | 27.6% | 6.2%(+21.4)#14 | 8.8%(+18.9)#2,642 |
| 15. | Perryman | 26.4% | 6.2%(+20.2)#15 | 8.8%(+17.7)#2,886 |
| 16. | Grantsville | 26.2% | 6.2%(+20.0)#16 | 8.8%(+17.4)#2,943 |
| 17. | Galestown | 25.9% | 6.2%(+19.7)#17 | 8.8%(+17.1)#3,020 |
| 18. | Gorman | 25.7% | 6.2%(+19.5)#18 | 8.8%(+16.9)#3,071 |
| 19. | Benedict | 25.6% | 6.2%(+19.4)#19 | 8.8%(+16.9)#3,081 |
| 20. | Luke | 24.0% | 6.2%(+17.8)#20 | 8.8%(+15.2)#3,499 |
| 21. | Deal Island | 23.2% | 6.2%(+17.0)#21 | 8.8%(+14.4)#3,704 |
| 22. | Crisfield | 21.6% | 6.2%(+15.4)#22 | 8.8%(+12.8)#4,215 |
| 23. | Pylesville | 21.6% | 6.2%(+15.4)#23 | 8.8%(+12.8)#4,220 |
| 24. | Princess Anne | 21.4% | 6.2%(+15.2)#24 | 8.8%(+12.7)#4,270 |
| 25. | Langley Park | 21.4% | 6.2%(+15.2)#25 | 8.8%(+12.6)#4,307 |
| 26. | Greensboro | 21.3% | 6.2%(+15.1)#26 | 8.8%(+12.5)#4,317 |
| 27. | Baltimore Highlands | 21.1% | 6.2%(+14.9)#27 | 8.8%(+12.3)#4,394 |
| 28. | Cecilton | 21.0% | 6.2%(+14.8)#28 | 8.8%(+12.2)#4,453 |
| 29. | Bloomington | 20.0% | 6.2%(+13.8)#29 | 8.8%(+11.2)#4,856 |
| 30. | Hebron | 19.9% | 6.2%(+13.7)#30 | 8.8%(+11.1)#4,925 |
| 31. | Snow Hill | 19.9% | 6.2%(+13.7)#31 | 8.8%(+11.1)#4,927 |
| 32. | Sudlersville | 19.5% | 6.2%(+13.3)#32 | 8.8%(+10.7)#5,047 |
| 33. | Mount Vernon | 19.2% | 6.2%(+13.0)#33 | 8.8%(+10.4)#5,152 |
| 34. | Crumpton | 18.8% | 6.2%(+12.6)#34 | 8.8%(+10.0)#5,346 |
| 35. | Crellin | 18.8% | 6.2%(+12.5)#35 | 8.8%(+9.97)#5,377 |
| 36. | Spencerville | 18.7% | 6.2%(+12.5)#36 | 8.8%(+9.92)#5,404 |
| 37. | Fairmount | 18.6% | 6.2%(+12.4)#37 | 8.8%(+9.86)#5,427 |
| 38. | Hagerstown | 18.4% | 6.2%(+12.2)#38 | 8.8%(+9.61)#5,555 |
| 39. | Midland | 18.1% | 6.2%(+11.9)#39 | 8.8%(+9.31)#5,720 |
| 40. | Delmar | 18.1% | 6.2%(+11.8)#40 | 8.8%(+9.27)#5,742 |
| 41. | Lansdowne | 17.6% | 6.2%(+11.3)#41 | 8.8%(+8.77)#5,989 |
| 42. | Frostburg | 17.4% | 6.2%(+11.2)#42 | 8.8%(+8.61)#6,072 |
| 43. | Williamsport | 17.2% | 6.2%(+11.0)#43 | 8.8%(+8.47)#6,145 |
| 44. | Dundalk | 17.2% | 6.2%(+11.0)#44 | 8.8%(+8.47)#6,146 |
| 45. | Henderson | 17.1% | 6.2%(+10.9)#45 | 8.8%(+8.36)#6,199 |
| 46. | Fairmount Heights | 17.0% | 6.2%(+10.8)#46 | 8.8%(+8.23)#6,271 |
| 47. | Butlertown | 16.9% | 6.2%(+10.7)#47 | 8.8%(+8.09)#6,341 |
| 48. | Willards | 16.8% | 6.2%(+10.6)#48 | 8.8%(+7.99)#6,391 |
| 49. | Lexington Park | 16.6% | 6.2%(+10.4)#49 | 8.8%(+7.82)#6,513 |
| 50. | Millington | 16.2% | 6.2%(+9.95)#50 | 8.8%(+7.39)#6,739 |
| 51. | Westernport | 16.0% | 6.2%(+9.79)#51 | 8.8%(+7.22)#6,820 |
| 52. | Kitzmiller | 15.9% | 6.2%(+9.73)#52 | 8.8%(+7.16)#6,864 |
| 53. | Friendsville | 15.9% | 6.2%(+9.71)#53 | 8.8%(+7.15)#6,870 |
| 54. | Marlow Heights | 15.5% | 6.2%(+9.28)#54 | 8.8%(+6.71)#7,130 |
| 55. | Cumberland | 15.2% | 6.2%(+8.97)#55 | 8.8%(+6.40)#7,331 |
| 56. | Middle River | 15.1% | 6.2%(+8.88)#56 | 8.8%(+6.32)#7,384 |
| 57. | Smith Island | 14.8% | 6.2%(+8.60)#57 | 8.8%(+6.03)#7,594 |
| 58. | Tilghmanton | 14.7% | 6.2%(+8.53)#58 | 8.8%(+5.96)#7,635 |
| 59. | Union Bridge | 14.7% | 6.2%(+8.52)#59 | 8.8%(+5.96)#7,640 |
| 60. | Accident | 14.7% | 6.2%(+8.49)#60 | 8.8%(+5.92)#7,663 |
| 61. | Baltimore | 14.5% | 6.2%(+8.30)#61 | 8.8%(+5.74)#7,790 |
| 62. | East Riverdale | 14.1% | 6.2%(+7.93)#62 | 8.8%(+5.36)#8,091 |
| 63. | Denton | 14.1% | 6.2%(+7.85)#63 | 8.8%(+5.28)#8,145 |
| 64. | Hurlock | 14.1% | 6.2%(+7.85)#64 | 8.8%(+5.28)#8,148 |
| 65. | North East | 13.5% | 6.2%(+7.27)#65 | 8.8%(+4.70)#8,579 |
| 66. | Hillsboro | 13.3% | 6.2%(+7.12)#66 | 8.8%(+4.55)#8,697 |
| 67. | Cambridge | 13.3% | 6.2%(+7.09)#67 | 8.8%(+4.52)#8,727 |
| 68. | Pittsville | 13.3% | 6.2%(+7.07)#68 | 8.8%(+4.50)#8,739 |
| 69. | Landover | 13.3% | 6.2%(+7.06)#69 | 8.8%(+4.50)#8,744 |
| 70. | Lonaconing | 13.2% | 6.2%(+7.03)#70 | 8.8%(+4.47)#8,759 |
| 71. | Salisbury | 13.2% | 6.2%(+6.94)#71 | 8.8%(+4.37)#8,824 |
| 72. | Elkton | 13.0% | 6.2%(+6.81)#72 | 8.8%(+4.24)#8,950 |
| 73. | Deer Park | 13.0% | 6.2%(+6.75)#73 | 8.8%(+4.18)#8,998 |
| 74. | Church Hill | 12.8% | 6.2%(+6.62)#74 | 8.8%(+4.06)#9,098 |
| 75. | Corriganville | 12.8% | 6.2%(+6.59)#75 | 8.8%(+4.03)#9,123 |
| 76. | Chesapeake City | 12.6% | 6.2%(+6.40)#76 | 8.8%(+3.84)#9,258 |
| 77. | Adelphi | 12.5% | 6.2%(+6.32)#77 | 8.8%(+3.75)#9,315 |
| 78. | Pleasant Grove | 12.2% | 6.2%(+6.03)#78 | 8.8%(+3.46)#9,581 |
| 79. | Melwood | 12.1% | 6.2%(+5.93)#79 | 8.8%(+3.37)#9,672 |
| 80. | White Oak | 12.1% | 6.2%(+5.93)#80 | 8.8%(+3.36)#9,676 |
| 81. | East New Market | 12.0% | 6.2%(+5.83)#81 | 8.8%(+3.27)#9,758 |
| 82. | Mount Savage | 12.0% | 6.2%(+5.76)#82 | 8.8%(+3.19)#9,829 |
| 83. | Vienna | 11.6% | 6.2%(+5.36)#83 | 8.8%(+2.80)#10,182 |
| 84. | Mount Briar | 11.5% | 6.2%(+5.32)#84 | 8.8%(+2.76)#10,219 |
| 85. | Marydel | 11.5% | 6.2%(+5.32)#85 | 8.8%(+2.76)#10,223 |
| 86. | Chestertown | 11.4% | 6.2%(+5.15)#86 | 8.8%(+2.58)#10,398 |
| 87. | Smithsburg | 11.1% | 6.2%(+4.91)#87 | 8.8%(+2.34)#10,599 |
| 88. | Queenstown | 10.9% | 6.2%(+4.71)#88 | 8.8%(+2.15)#10,816 |
| 89. | Glassmanor | 10.9% | 6.2%(+4.68)#89 | 8.8%(+2.11)#10,850 |
| 90. | Fairlee | 10.7% | 6.2%(+4.50)#90 | 8.8%(+1.93)#11,014 |
| 91. | Garrison | 10.6% | 6.2%(+4.41)#91 | 8.8%(+1.84)#11,106 |
| 92. | District Heights | 10.6% | 6.2%(+4.38)#92 | 8.8%(+1.81)#11,137 |
| 93. | Capitol Heights | 10.5% | 6.2%(+4.26)#93 | 8.8%(+1.69)#11,265 |
| 94. | Edgewater | 10.5% | 6.2%(+4.26)#94 | 8.8%(+1.69)#11,267 |
| 95. | Lochearn | 10.5% | 6.2%(+4.25)#95 | 8.8%(+1.69)#11,278 |
| 96. | Greenbelt | 10.4% | 6.2%(+4.21)#96 | 8.8%(+1.65)#11,329 |
| 97. | Brentwood | 10.4% | 6.2%(+4.21)#97 | 8.8%(+1.64)#11,332 |
| 98. | Shaft | 10.2% | 6.2%(+4.01)#98 | 8.8%(+1.45)#11,529 |
| 99. | Chillum | 10.2% | 6.2%(+4.00)#99 | 8.8%(+1.44)#11,535 |
| 100. | Summerfield | 10.2% | 6.2%(+3.96)#100 | 8.8%(+1.40)#11,573 |
Common Questions
What are the Top 10 Cities with the Highest Poverty Level Among Families in Maryland?
Top 10 Cities with the Highest Poverty Level Among Families in Maryland are:
#1
100.0%
#2
66.7%
#3
61.8%
#4
53.9%
#5
42.9%
#6
42.4%
#7
40.0%
#8
36.4%
#9
31.8%
#10
28.9%
What city has the Highest Poverty Level Among Families in Maryland?
Detmold has the Highest Poverty Level Among Families in Maryland with 100.0%.
What is the Poverty Level Among Families in the State of Maryland?
Poverty Level Among Families in Maryland is 6.2%.
What is the Poverty Level Among Families in the United States?
Poverty Level Among Families in the United States is 8.8%.