Cities with the Highest Poverty Level Among Families in Minnesota
RELATED REPORTS & OPTIONS
Highest Family Poverty
Minnesota
Compare Cities
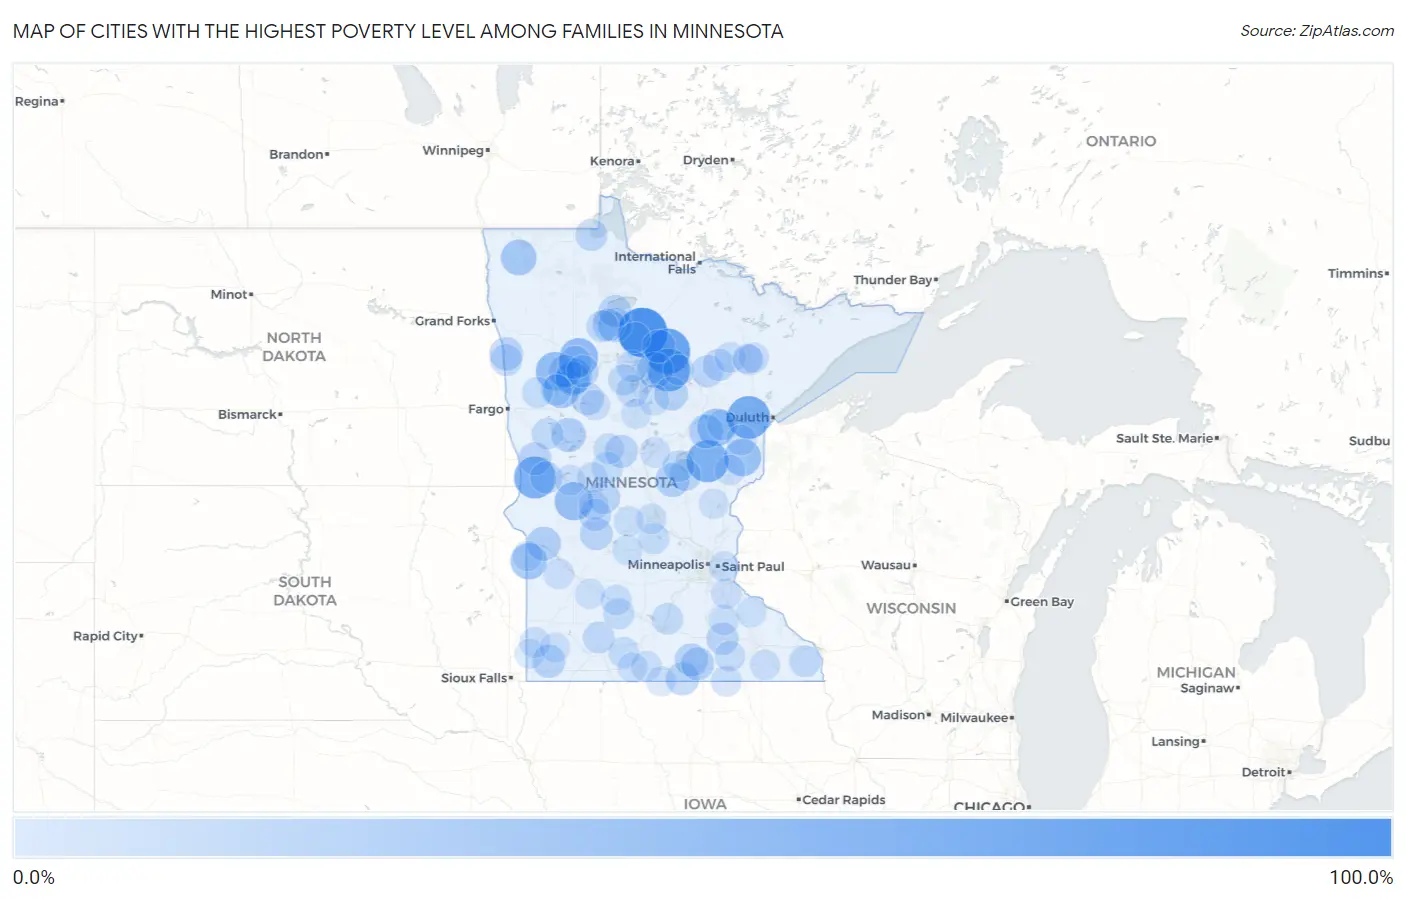
Map of Cities with the Highest Poverty Level Among Families in Minnesota
0.0%
100.0%
Cities with the Highest Poverty Level Among Families in Minnesota
| City | Family Poverty | vs State | vs National | |
| 1. | Funkley | 100.0% | 5.5%(+94.5)#1 | 8.8%(+91.2)#74 |
| 2. | Inger | 81.2% | 5.5%(+75.7)#2 | 8.8%(+72.5)#161 |
| 3. | Mahnomen | 70.6% | 5.5%(+65.1)#3 | 8.8%(+61.8)#238 |
| 4. | Ball Club | 70.5% | 5.5%(+64.9)#4 | 8.8%(+61.7)#241 |
| 5. | Nashua | 66.7% | 5.5%(+61.1)#5 | 8.8%(+57.9)#276 |
| 6. | Mcgrath | 66.7% | 5.5%(+61.1)#6 | 8.8%(+57.9)#280 |
| 7. | Ebro | 52.6% | 5.5%(+47.1)#7 | 8.8%(+43.8)#565 |
| 8. | Riverland | 51.4% | 5.5%(+45.9)#8 | 8.8%(+42.6)#607 |
| 9. | Farwell | 50.0% | 5.5%(+44.5)#9 | 8.8%(+41.2)#675 |
| 10. | Tamarack | 47.4% | 5.5%(+41.8)#10 | 8.8%(+38.6)#784 |
| 11. | Bruno | 46.7% | 5.5%(+41.1)#11 | 8.8%(+37.9)#813 |
| 12. | White Earth | 43.0% | 5.5%(+37.4)#12 | 8.8%(+34.2)#994 |
| 13. | Marietta | 42.9% | 5.5%(+37.3)#13 | 8.8%(+34.1)#1,004 |
| 14. | Bena | 41.7% | 5.5%(+36.1)#14 | 8.8%(+32.9)#1,080 |
| 15. | Naytahwaush | 41.1% | 5.5%(+35.5)#15 | 8.8%(+32.3)#1,139 |
| 16. | Halma | 40.0% | 5.5%(+34.5)#16 | 8.8%(+31.2)#1,216 |
| 17. | Twin Lakes | 33.9% | 5.5%(+28.4)#17 | 8.8%(+25.1)#1,726 |
| 18. | Redby | 33.6% | 5.5%(+28.1)#18 | 8.8%(+24.9)#1,752 |
| 19. | Mcgregor | 33.3% | 5.5%(+27.8)#19 | 8.8%(+24.6)#1,774 |
| 20. | Dent | 33.3% | 5.5%(+27.8)#20 | 8.8%(+24.6)#1,786 |
| 21. | Correll | 33.3% | 5.5%(+27.8)#22 | 8.8%(+24.6)#1,831 |
| 22. | Hillman | 33.3% | 5.5%(+27.8)#23 | 8.8%(+24.6)#1,832 |
| 23. | Remer | 30.9% | 5.5%(+25.3)#24 | 8.8%(+22.1)#2,088 |
| 24. | Kiester | 29.5% | 5.5%(+23.9)#25 | 8.8%(+20.7)#2,310 |
| 25. | Freeborn | 29.3% | 5.5%(+23.8)#26 | 8.8%(+20.6)#2,332 |
| 26. | Squaw Lake | 29.2% | 5.5%(+23.6)#27 | 8.8%(+20.4)#2,359 |
| 27. | Nielsville | 29.2% | 5.5%(+23.6)#28 | 8.8%(+20.4)#2,360 |
| 28. | Kenneth | 28.6% | 5.5%(+23.0)#29 | 8.8%(+19.8)#2,468 |
| 29. | Manchester | 28.6% | 5.5%(+23.0)#30 | 8.8%(+19.8)#2,472 |
| 30. | Midway | 28.6% | 5.5%(+23.0)#31 | 8.8%(+19.8)#2,476 |
| 31. | Pine Bend | 28.6% | 5.5%(+23.0)#32 | 8.8%(+19.8)#2,478 |
| 32. | Staples | 28.2% | 5.5%(+22.7)#33 | 8.8%(+19.4)#2,527 |
| 33. | Pine Point | 27.9% | 5.5%(+22.4)#34 | 8.8%(+19.2)#2,579 |
| 34. | Sunburg | 27.8% | 5.5%(+22.3)#35 | 8.8%(+19.0)#2,617 |
| 35. | Foxhome | 27.6% | 5.5%(+22.1)#36 | 8.8%(+18.8)#2,656 |
| 36. | West Union | 27.3% | 5.5%(+21.7)#37 | 8.8%(+18.5)#2,723 |
| 37. | Ponemah | 26.5% | 5.5%(+21.0)#38 | 8.8%(+17.7)#2,877 |
| 38. | Red Lake | 25.7% | 5.5%(+20.2)#39 | 8.8%(+17.0)#3,053 |
| 39. | Claremont | 25.2% | 5.5%(+19.7)#40 | 8.8%(+16.4)#3,177 |
| 40. | Calumet | 25.0% | 5.5%(+19.5)#41 | 8.8%(+16.2)#3,220 |
| 41. | Wendell | 25.0% | 5.5%(+19.5)#42 | 8.8%(+16.2)#3,231 |
| 42. | South End | 25.0% | 5.5%(+19.5)#43 | 8.8%(+16.2)#3,259 |
| 43. | Sedan | 25.0% | 5.5%(+19.5)#44 | 8.8%(+16.2)#3,262 |
| 44. | Keewatin | 24.8% | 5.5%(+19.2)#45 | 8.8%(+16.0)#3,303 |
| 45. | Warroad | 24.4% | 5.5%(+18.9)#46 | 8.8%(+15.7)#3,379 |
| 46. | Onamia | 24.3% | 5.5%(+18.8)#47 | 8.8%(+15.6)#3,408 |
| 47. | Walker | 24.2% | 5.5%(+18.7)#48 | 8.8%(+15.4)#3,442 |
| 48. | Little Rock | 23.8% | 5.5%(+18.2)#49 | 8.8%(+15.0)#3,559 |
| 49. | Houston | 23.7% | 5.5%(+18.1)#50 | 8.8%(+14.9)#3,589 |
| 50. | Shelly | 23.4% | 5.5%(+17.9)#51 | 8.8%(+14.6)#3,653 |
| 51. | Jeffers | 23.4% | 5.5%(+17.9)#52 | 8.8%(+14.6)#3,661 |
| 52. | Vineland | 23.1% | 5.5%(+17.6)#53 | 8.8%(+14.3)#3,733 |
| 53. | Cass Lake | 23.0% | 5.5%(+17.5)#54 | 8.8%(+14.2)#3,761 |
| 54. | Eagle Bend | 22.2% | 5.5%(+16.6)#55 | 8.8%(+13.4)#4,031 |
| 55. | Kasota | 22.1% | 5.5%(+16.6)#56 | 8.8%(+13.3)#4,054 |
| 56. | Pelican Rapids | 21.7% | 5.5%(+16.2)#57 | 8.8%(+12.9)#4,190 |
| 57. | Evan | 21.1% | 5.5%(+15.5)#58 | 8.8%(+12.3)#4,422 |
| 58. | Laporte | 21.1% | 5.5%(+15.5)#59 | 8.8%(+12.3)#4,423 |
| 59. | Odin | 20.6% | 5.5%(+15.1)#60 | 8.8%(+11.8)#4,605 |
| 60. | South Haven | 20.5% | 5.5%(+14.9)#61 | 8.8%(+11.7)#4,652 |
| 61. | Ogema | 20.3% | 5.5%(+14.8)#62 | 8.8%(+11.5)#4,708 |
| 62. | Ulen | 20.2% | 5.5%(+14.7)#63 | 8.8%(+11.4)#4,761 |
| 63. | Verndale | 20.0% | 5.5%(+14.5)#64 | 8.8%(+11.2)#4,821 |
| 64. | Longville | 20.0% | 5.5%(+14.5)#65 | 8.8%(+11.2)#4,848 |
| 65. | Wright | 20.0% | 5.5%(+14.5)#66 | 8.8%(+11.2)#4,863 |
| 66. | Chisholm | 19.9% | 5.5%(+14.4)#67 | 8.8%(+11.1)#4,929 |
| 67. | Blackduck | 19.7% | 5.5%(+14.2)#68 | 8.8%(+10.9)#4,987 |
| 68. | Pipestone | 19.6% | 5.5%(+14.1)#69 | 8.8%(+10.8)#5,007 |
| 69. | Lyle | 19.5% | 5.5%(+14.0)#70 | 8.8%(+10.8)#5,031 |
| 70. | Franklin | 19.5% | 5.5%(+14.0)#71 | 8.8%(+10.7)#5,045 |
| 71. | Kenyon | 19.2% | 5.5%(+13.7)#72 | 8.8%(+10.5)#5,150 |
| 72. | Deer River | 19.1% | 5.5%(+13.5)#73 | 8.8%(+10.3)#5,224 |
| 73. | Miltona | 18.9% | 5.5%(+13.4)#74 | 8.8%(+10.1)#5,289 |
| 74. | Waltham | 18.9% | 5.5%(+13.3)#75 | 8.8%(+10.1)#5,321 |
| 75. | Eveleth | 18.9% | 5.5%(+13.3)#76 | 8.8%(+10.1)#5,323 |
| 76. | Brainerd | 18.7% | 5.5%(+13.2)#77 | 8.8%(+9.92)#5,410 |
| 77. | Boyd | 18.6% | 5.5%(+13.1)#78 | 8.8%(+9.82)#5,440 |
| 78. | Granada | 18.5% | 5.5%(+12.9)#79 | 8.8%(+9.68)#5,519 |
| 79. | Barnum | 18.3% | 5.5%(+12.8)#80 | 8.8%(+9.53)#5,607 |
| 80. | Evansville | 18.2% | 5.5%(+12.7)#81 | 8.8%(+9.46)#5,638 |
| 81. | New Trier | 18.2% | 5.5%(+12.7)#82 | 8.8%(+9.40)#5,687 |
| 82. | Wykoff | 18.0% | 5.5%(+12.5)#83 | 8.8%(+9.22)#5,773 |
| 83. | Osage | 17.9% | 5.5%(+12.4)#84 | 8.8%(+9.17)#5,794 |
| 84. | Grove City | 17.7% | 5.5%(+12.2)#85 | 8.8%(+8.96)#5,893 |
| 85. | Sandstone | 17.7% | 5.5%(+12.2)#86 | 8.8%(+8.92)#5,909 |
| 86. | Waite Park | 17.5% | 5.5%(+12.0)#87 | 8.8%(+8.77)#5,990 |
| 87. | Landfall | 17.5% | 5.5%(+12.0)#88 | 8.8%(+8.76)#5,995 |
| 88. | St Martin | 17.4% | 5.5%(+11.9)#89 | 8.8%(+8.66)#6,053 |
| 89. | Gilbert | 17.4% | 5.5%(+11.9)#90 | 8.8%(+8.62)#6,069 |
| 90. | Belview | 17.2% | 5.5%(+11.7)#91 | 8.8%(+8.42)#6,174 |
| 91. | Backus | 17.1% | 5.5%(+11.6)#92 | 8.8%(+8.36)#6,196 |
| 92. | Braham | 17.1% | 5.5%(+11.6)#93 | 8.8%(+8.32)#6,216 |
| 93. | Bellechester | 17.0% | 5.5%(+11.5)#94 | 8.8%(+8.24)#6,266 |
| 94. | Elmore | 16.9% | 5.5%(+11.4)#95 | 8.8%(+8.14)#6,312 |
| 95. | Welcome | 16.9% | 5.5%(+11.4)#96 | 8.8%(+8.10)#6,333 |
| 96. | Jasper | 16.7% | 5.5%(+11.1)#97 | 8.8%(+7.88)#6,441 |
| 97. | Chandler | 16.7% | 5.5%(+11.1)#98 | 8.8%(+7.88)#6,447 |
| 98. | Villard | 16.7% | 5.5%(+11.1)#99 | 8.8%(+7.88)#6,458 |
| 99. | Leonidas | 16.7% | 5.5%(+11.1)#100 | 8.8%(+7.88)#6,490 |
| 100. | Nassau | 16.7% | 5.5%(+11.1)#101 | 8.8%(+7.88)#6,491 |
Common Questions
What are the Top 10 Cities with the Highest Poverty Level Among Families in Minnesota?
Top 10 Cities with the Highest Poverty Level Among Families in Minnesota are:
What city has the Highest Poverty Level Among Families in Minnesota?
Funkley has the Highest Poverty Level Among Families in Minnesota with 100.0%.
What is the Poverty Level Among Families in the State of Minnesota?
Poverty Level Among Families in Minnesota is 5.5%.
What is the Poverty Level Among Families in the United States?
Poverty Level Among Families in the United States is 8.8%.