Cities with the Fewest Births per 1,000 Women Over the Age of 35 in Nevada
RELATED REPORTS & OPTIONS
Lowest Birth Rate | Women 35+
Nevada
Compare Cities
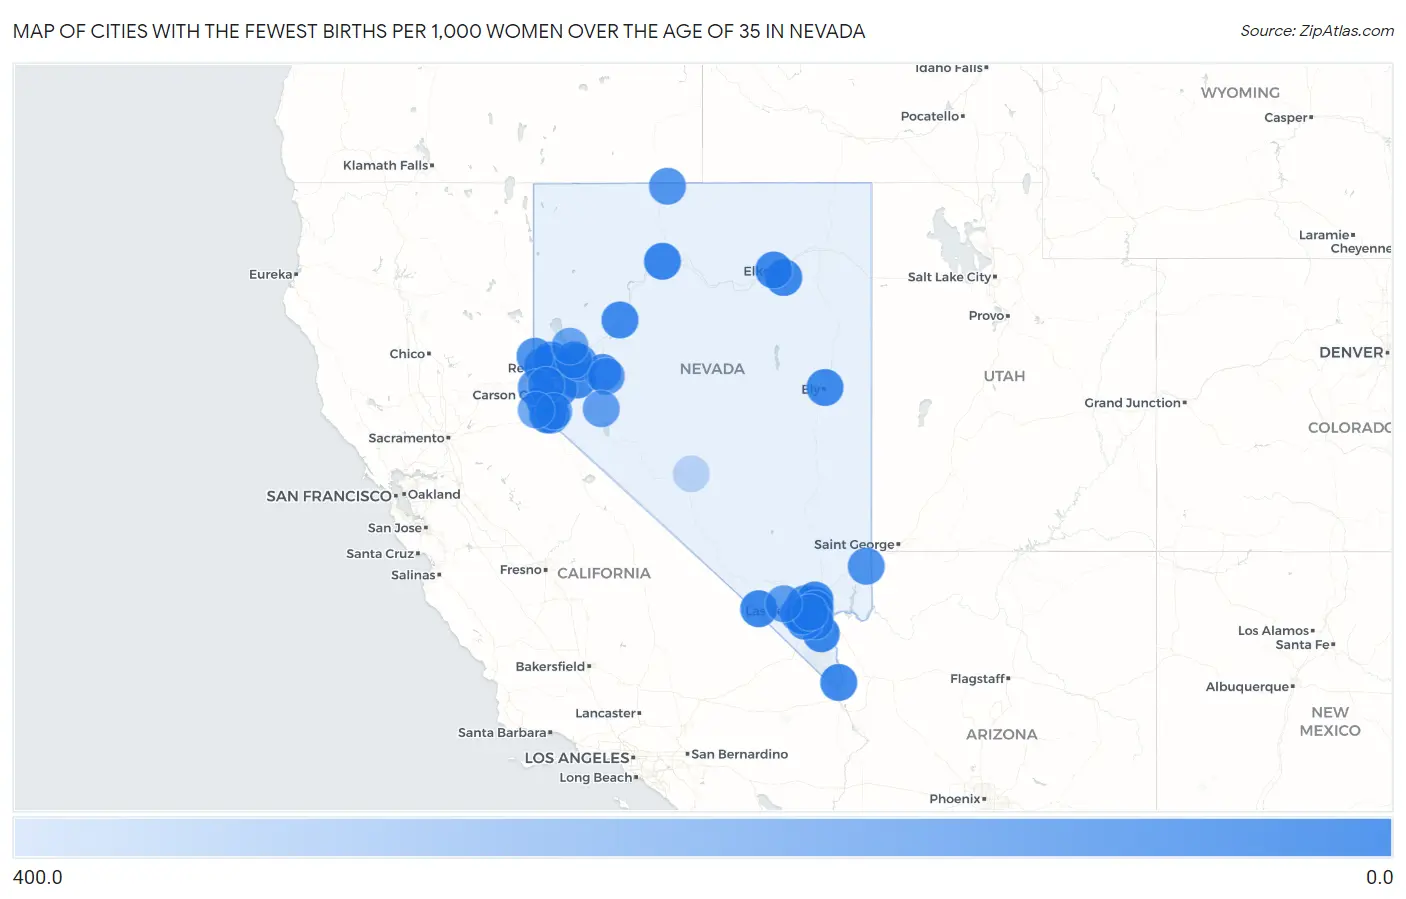
Map of Cities with the Fewest Births per 1,000 Women Over the Age of 35 in Nevada
400.0
0.0
Cities with the Fewest Births per 1,000 Women Over the Age of 35 in Nevada
| City | Births / 1,000 Women | vs State | vs National | |
| 1. | Winnemucca | 3.0 | 32.0(-29.0)#1 | 32.0(-29.0)#66 |
| 2. | Pahrump | 11.0 | 32.0(-21.0)#2 | 32.0(-21.0)#658 |
| 3. | Boulder City | 11.0 | 32.0(-21.0)#3 | 32.0(-21.0)#687 |
| 4. | Spring Creek | 16.0 | 32.0(-16.0)#4 | 32.0(-16.0)#1,355 |
| 5. | Laughlin | 19.0 | 32.0(-13.0)#5 | 32.0(-13.0)#1,889 |
| 6. | Whitney | 20.0 | 32.0(-12.0)#6 | 32.0(-12.0)#1,991 |
| 7. | Summerlin South | 20.0 | 32.0(-12.0)#7 | 32.0(-12.0)#2,001 |
| 8. | Elko | 20.0 | 32.0(-12.0)#8 | 32.0(-12.0)#2,015 |
| 9. | Paradise | 21.0 | 32.0(-11.0)#9 | 32.0(-11.0)#2,136 |
| 10. | Nellis Afb | 22.0 | 32.0(-10.00)#10 | 32.0(-10.00)#2,416 |
| 11. | Ely | 22.0 | 32.0(-10.00)#11 | 32.0(-10.00)#2,417 |
| 12. | Silver Springs | 23.0 | 32.0(-9.00)#12 | 32.0(-9.00)#2,586 |
| 13. | Johnson Lane | 26.0 | 32.0(-6.00)#13 | 32.0(-6.00)#3,112 |
| 14. | Reno | 28.0 | 32.0(-4.00)#14 | 32.0(-4.00)#3,383 |
| 15. | Lovelock | 28.0 | 32.0(-4.00)#15 | 32.0(-4.00)#3,521 |
| 16. | Las Vegas | 31.0 | 32.0(-1.000)#16 | 32.0(-1.000)#3,937 |
| 17. | North Las Vegas | 31.0 | 32.0(-1.000)#17 | 32.0(-1.000)#3,943 |
| 18. | Sunrise Manor | 31.0 | 32.0(-1.000)#18 | 32.0(-1.000)#3,947 |
| 19. | Henderson | 32.0 | 32.0(=0.000)#19 | 32.0(=0.000)#4,117 |
| 20. | Enterprise | 37.0 | 32.0(+5.00)#20 | 32.0(+5.00)#4,943 |
| 21. | Indian Hills | 38.0 | 32.0(+6.00)#21 | 32.0(+6.00)#5,206 |
| 22. | Spring Valley | 39.0 | 32.0(+7.00)#22 | 32.0(+7.00)#5,285 |
| 23. | Sparks | 45.0 | 32.0(+13.0)#23 | 32.0(+13.0)#6,042 |
| 24. | Dayton | 45.0 | 32.0(+13.0)#24 | 32.0(+13.0)#6,070 |
| 25. | Fernley | 50.0 | 32.0(+18.0)#25 | 32.0(+18.0)#6,594 |
| 26. | Ruhenstroth | 51.0 | 32.0(+19.0)#26 | 32.0(+19.0)#6,742 |
| 27. | Gardnerville Ranchos | 54.0 | 32.0(+22.0)#27 | 32.0(+22.0)#6,989 |
| 28. | Carson | 55.0 | 32.0(+23.0)#28 | 32.0(+23.0)#7,073 |
| 29. | Spanish Springs | 57.0 | 32.0(+25.0)#29 | 32.0(+25.0)#7,246 |
| 30. | Fallon | 59.0 | 32.0(+27.0)#30 | 32.0(+27.0)#7,378 |
| 31. | Wadsworth | 60.0 | 32.0(+28.0)#31 | 32.0(+28.0)#7,490 |
| 32. | Winchester | 61.0 | 32.0(+29.0)#32 | 32.0(+29.0)#7,501 |
| 33. | Cold Springs | 62.0 | 32.0(+30.0)#33 | 32.0(+30.0)#7,593 |
| 34. | Mesquite | 63.0 | 32.0(+31.0)#34 | 32.0(+31.0)#7,637 |
| 35. | Fort Mcdermitt | 77.0 | 32.0(+45.0)#35 | 32.0(+45.0)#8,419 |
| 36. | Incline Village | 92.0 | 32.0(+60.0)#36 | 32.0(+60.0)#8,892 |
| 37. | Fallon Station | 92.0 | 32.0(+60.0)#37 | 32.0(+60.0)#8,915 |
| 38. | Mount Charleston | 115.0 | 32.0(+83.0)#38 | 32.0(+83.0)#9,489 |
| 39. | Schurz | 121.0 | 32.0(+89.0)#39 | 32.0(+89.0)#9,599 |
| 40. | Washoe Valley | 139.0 | 32.0(+107)#40 | 32.0(+107)#9,880 |
| 41. | Fish Springs | 143.0 | 32.0(+111)#41 | 32.0(+111)#9,925 |
| 42. | Nixon | 150.0 | 32.0(+118)#42 | 32.0(+118)#10,018 |
| 43. | Stateline | 154.0 | 32.0(+122)#43 | 32.0(+122)#10,051 |
| 44. | Tonopah | 369.0 | 32.0(+337)#44 | 32.0(+337)#10,839 |
1
Common Questions
What are the Top 10 Cities with the Fewest Births per 1,000 Women Over the Age of 35 in Nevada?
Top 10 Cities with the Fewest Births per 1,000 Women Over the Age of 35 in Nevada are:
#1
0.0
#2
0.0
#3
0.0
#4
0.0
#5
0.0
#6
0.0
#7
0.0
#8
0.0
#9
0.0
#10
0.0
What city has the Fewest Births per 1,000 Women Over the Age of 35 in Nevada?
Winnemucca has the Fewest Births per 1,000 Women Over the Age of 35 in Nevada with 3.0.
What is the Number of Births per 1,000 Women Over the Age of 35 in the State of Nevada?
Number of Births per 1,000 Women Over the Age of 35 in Nevada is 32.0.
What is the Number of Births per 1,000 Women Over the Age of 35 in the United States?
Number of Births per 1,000 Women Over the Age of 35 in the United States is 32.0.