Cities with the Fewest Births per 1,000 Women Over the Age of 35 in Connecticut
RELATED REPORTS & OPTIONS
Lowest Birth Rate | Women 35+
Connecticut
Compare Cities
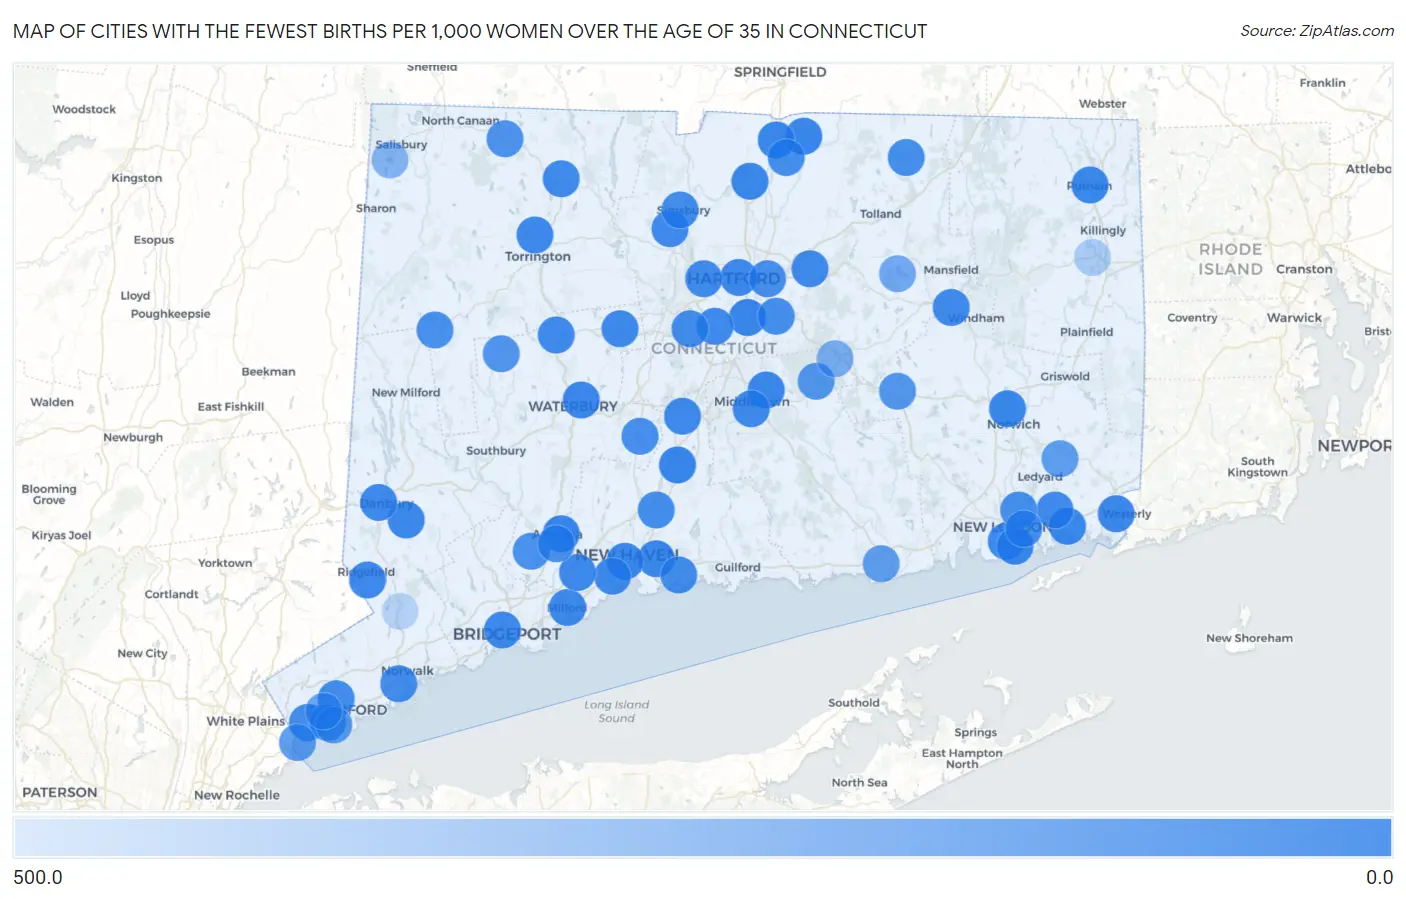
Map of Cities with the Fewest Births per 1,000 Women Over the Age of 35 in Connecticut
500.0
0.0
Cities with the Fewest Births per 1,000 Women Over the Age of 35 in Connecticut
| City | Births / 1,000 Women | vs State | vs National | |
| 1. | Ansonia | 6.0 | 34.0(-28.0)#1 | 32.0(-26.0)#190 |
| 2. | Wethersfield | 9.0 | 34.0(-25.0)#2 | 32.0(-23.0)#433 |
| 3. | Wallingford Center | 9.0 | 34.0(-25.0)#3 | 32.0(-23.0)#444 |
| 4. | Hazardville | 9.0 | 34.0(-25.0)#4 | 32.0(-23.0)#493 |
| 5. | Bethel | 10.0 | 34.0(-24.0)#5 | 32.0(-22.0)#581 |
| 6. | Thompsonville | 10.0 | 34.0(-24.0)#6 | 32.0(-22.0)#607 |
| 7. | East Haven | 11.0 | 34.0(-23.0)#7 | 32.0(-21.0)#669 |
| 8. | Sandy Hook | 11.0 | 34.0(-23.0)#8 | 32.0(-21.0)#717 |
| 9. | Danielson Borough | 11.0 | 34.0(-23.0)#9 | 32.0(-21.0)#752 |
| 10. | Putnam | 12.0 | 34.0(-22.0)#10 | 32.0(-20.0)#873 |
| 11. | Mystic | 13.0 | 34.0(-21.0)#11 | 32.0(-19.0)#1,008 |
| 12. | Windsor Locks | 15.0 | 34.0(-19.0)#12 | 32.0(-17.0)#1,228 |
| 13. | Portland | 15.0 | 34.0(-19.0)#13 | 32.0(-17.0)#1,250 |
| 14. | Daniels Farm | 16.0 | 34.0(-18.0)#14 | 32.0(-16.0)#1,401 |
| 15. | Norwich | 17.0 | 34.0(-17.0)#15 | 32.0(-15.0)#1,478 |
| 16. | New London | 19.0 | 34.0(-15.0)#16 | 32.0(-13.0)#1,838 |
| 17. | Pawcatuck | 19.0 | 34.0(-15.0)#17 | 32.0(-13.0)#1,900 |
| 18. | Hartford | 20.0 | 34.0(-14.0)#18 | 32.0(-12.0)#1,976 |
| 19. | New Haven | 23.0 | 34.0(-11.0)#19 | 32.0(-9.00)#2,491 |
| 20. | Waterbury | 24.0 | 34.0(-10.00)#20 | 32.0(-8.00)#2,681 |
| 21. | Groton | 24.0 | 34.0(-10.00)#21 | 32.0(-8.00)#2,771 |
| 22. | Bristol | 26.0 | 34.0(-8.00)#22 | 32.0(-6.00)#3,049 |
| 23. | Middletown | 26.0 | 34.0(-8.00)#23 | 32.0(-6.00)#3,053 |
| 24. | West Haven | 27.0 | 34.0(-7.00)#24 | 32.0(-5.00)#3,212 |
| 25. | Torrington | 27.0 | 34.0(-7.00)#25 | 32.0(-5.00)#3,227 |
| 26. | Meriden | 28.0 | 34.0(-6.00)#26 | 32.0(-4.00)#3,397 |
| 27. | Trumbull Center | 28.0 | 34.0(-6.00)#27 | 32.0(-4.00)#3,470 |
| 28. | Ridgefield | 28.0 | 34.0(-6.00)#28 | 32.0(-4.00)#3,478 |
| 29. | Danbury | 29.0 | 34.0(-5.00)#29 | 32.0(-3.00)#3,573 |
| 30. | Milford City Balance | 29.0 | 34.0(-5.00)#30 | 32.0(-3.00)#3,585 |
| 31. | Staples | 29.0 | 34.0(-5.00)#31 | 32.0(-3.00)#3,643 |
| 32. | Woodmont Borough | 30.0 | 34.0(-4.00)#32 | 32.0(-2.00)#3,903 |
| 33. | Bridgeport | 31.0 | 34.0(-3.00)#33 | 32.0(-1.000)#3,953 |
| 34. | Orange | 31.0 | 34.0(-3.00)#34 | 32.0(-1.000)#4,013 |
| 35. | New Canaan | 31.0 | 34.0(-3.00)#35 | 32.0(-1.000)#4,034 |
| 36. | Noroton Heights | 31.0 | 34.0(-3.00)#36 | 32.0(-1.000)#4,056 |
| 37. | Manchester | 33.0 | 34.0(-1.000)#37 | 32.0(+1.000)#4,306 |
| 38. | East | 35.0 | 34.0(+1.000)#38 | 32.0(+3.00)#4,717 |
| 39. | Winsted | 37.0 | 34.0(+3.00)#39 | 32.0(+5.00)#5,036 |
| 40. | Willimantic | 38.0 | 34.0(+4.00)#40 | 32.0(+6.00)#5,161 |
| 41. | Weatogue | 39.0 | 34.0(+5.00)#41 | 32.0(+7.00)#5,387 |
| 42. | West Hartford | 40.0 | 34.0(+6.00)#42 | 32.0(+8.00)#5,435 |
| 43. | Newington | 40.0 | 34.0(+6.00)#43 | 32.0(+8.00)#5,452 |
| 44. | Old Mystic | 41.0 | 34.0(+7.00)#44 | 32.0(+9.00)#5,644 |
| 45. | Thomaston | 41.0 | 34.0(+7.00)#45 | 32.0(+9.00)#5,657 |
| 46. | Norwalk | 42.0 | 34.0(+8.00)#46 | 32.0(+10.00)#5,698 |
| 47. | New Britain | 44.0 | 34.0(+10.00)#47 | 32.0(+12.0)#5,948 |
| 48. | Greenwich | 45.0 | 34.0(+11.0)#48 | 32.0(+13.0)#6,074 |
| 49. | Naugatuck Borough | 47.0 | 34.0(+13.0)#49 | 32.0(+15.0)#6,269 |
| 50. | Branford Center | 47.0 | 34.0(+13.0)#50 | 32.0(+15.0)#6,306 |
| 51. | Simsbury Center | 47.0 | 34.0(+13.0)#51 | 32.0(+15.0)#6,307 |
| 52. | Stamford | 48.0 | 34.0(+14.0)#52 | 32.0(+16.0)#6,359 |
| 53. | Glastonbury Center | 49.0 | 34.0(+15.0)#53 | 32.0(+17.0)#6,508 |
| 54. | Conning Towers Nautilus Park | 50.0 | 34.0(+16.0)#54 | 32.0(+18.0)#6,616 |
| 55. | Newtown Borough | 51.0 | 34.0(+17.0)#55 | 32.0(+19.0)#6,738 |
| 56. | Southwood Acres | 52.0 | 34.0(+18.0)#56 | 32.0(+20.0)#6,814 |
| 57. | Stafford Springs | 52.0 | 34.0(+18.0)#57 | 32.0(+20.0)#6,825 |
| 58. | Long Hill | 52.0 | 34.0(+18.0)#58 | 32.0(+20.0)#6,827 |
| 59. | Jewett City Borough | 54.0 | 34.0(+20.0)#59 | 32.0(+22.0)#7,021 |
| 60. | North Haven | 55.0 | 34.0(+21.0)#60 | 32.0(+23.0)#7,083 |
| 61. | Greens Farms | 56.0 | 34.0(+22.0)#61 | 32.0(+24.0)#7,193 |
| 62. | Compo | 58.0 | 34.0(+24.0)#62 | 32.0(+26.0)#7,324 |
| 63. | East Hartford | 59.0 | 34.0(+25.0)#63 | 32.0(+27.0)#7,356 |
| 64. | Cheshire Village | 62.0 | 34.0(+28.0)#64 | 32.0(+30.0)#7,602 |
| 65. | Mill Plain | 66.0 | 34.0(+32.0)#65 | 32.0(+34.0)#7,862 |
| 66. | New Preston | 69.0 | 34.0(+35.0)#66 | 32.0(+37.0)#8,013 |
| 67. | Shelton | 72.0 | 34.0(+38.0)#67 | 32.0(+40.0)#8,146 |
| 68. | Derby | 74.0 | 34.0(+40.0)#68 | 32.0(+42.0)#8,237 |
| 69. | Riverside | 75.0 | 34.0(+41.0)#69 | 32.0(+43.0)#8,299 |
| 70. | Norfolk | 83.0 | 34.0(+49.0)#70 | 32.0(+51.0)#8,621 |
| 71. | Route 7 Gateway | 93.0 | 34.0(+59.0)#71 | 32.0(+61.0)#8,938 |
| 72. | Lake Pocotopaug | 97.0 | 34.0(+63.0)#72 | 32.0(+65.0)#9,042 |
| 73. | Bethlehem Village | 98.0 | 34.0(+64.0)#73 | 32.0(+66.0)#9,077 |
| 74. | Colchester | 106.0 | 34.0(+72.0)#74 | 32.0(+74.0)#9,266 |
| 75. | Indian Field | 111.0 | 34.0(+77.0)#75 | 32.0(+79.0)#9,392 |
| 76. | Byram | 131.0 | 34.0(+97.0)#76 | 32.0(+99.0)#9,754 |
| 77. | Noroton | 138.0 | 34.0(+104)#77 | 32.0(+106)#9,861 |
| 78. | Old Greenwich | 139.0 | 34.0(+105)#78 | 32.0(+107)#9,876 |
| 79. | Mashantucket | 143.0 | 34.0(+109)#79 | 32.0(+111)#9,944 |
| 80. | Old Saybrook Center | 145.0 | 34.0(+111)#80 | 32.0(+113)#9,953 |
| 81. | Tashua | 162.0 | 34.0(+128)#81 | 32.0(+130)#10,125 |
| 82. | Plattsville | 173.0 | 34.0(+139)#82 | 32.0(+141)#10,204 |
| 83. | Cos Cob | 190.0 | 34.0(+156)#83 | 32.0(+158)#10,313 |
| 84. | Cornwall Bridge | 200.0 | 34.0(+166)#84 | 32.0(+168)#10,377 |
| 85. | Saugatuck | 205.0 | 34.0(+171)#85 | 32.0(+173)#10,410 |
| 86. | Coventry Lake | 216.0 | 34.0(+182)#86 | 32.0(+184)#10,466 |
| 87. | Terramuggus | 238.0 | 34.0(+204)#87 | 32.0(+206)#10,552 |
| 88. | Lakeville | 284.0 | 34.0(+250)#88 | 32.0(+252)#10,702 |
| 89. | Weston | 397.0 | 34.0(+363)#89 | 32.0(+365)#10,863 |
| 90. | East Brooklyn | 434.0 | 34.0(+400)#90 | 32.0(+402)#10,890 |
| 91. | Cannondale | 473.0 | 34.0(+439)#91 | 32.0(+441)#10,918 |
1
2Common Questions
What are the Top 10 Cities with the Fewest Births per 1,000 Women Over the Age of 35 in Connecticut?
Top 10 Cities with the Fewest Births per 1,000 Women Over the Age of 35 in Connecticut are:
#1
0.0
#2
0.0
#3
0.0
#4
0.0
#5
0.0
#6
0.0
#7
0.0
#8
0.0
#9
6.0
#10
9.0
What city has the Fewest Births per 1,000 Women Over the Age of 35 in Connecticut?
Ansonia has the Fewest Births per 1,000 Women Over the Age of 35 in Connecticut with 6.0.
What is the Number of Births per 1,000 Women Over the Age of 35 in the State of Connecticut?
Number of Births per 1,000 Women Over the Age of 35 in Connecticut is 34.0.
What is the Number of Births per 1,000 Women Over the Age of 35 in the United States?
Number of Births per 1,000 Women Over the Age of 35 in the United States is 32.0.