Selma, CA Map & Demographics
Selma Map
Selma Overview
$21,714
PER CAPITA INCOME
$58,562
AVG FAMILY INCOME
$53,874
AVG HOUSEHOLD INCOME
14.9%
WAGE / INCOME GAP [ % ]
85.1¢/ $1
WAGE / INCOME GAP [ $ ]
$8,699
FAMILY INCOME DEFICIT
0.46
INEQUALITY / GINI INDEX
24,576
TOTAL POPULATION
12,649
MALE POPULATION
11,927
FEMALE POPULATION
106.05
MALES / 100 FEMALES
94.29
FEMALES / 100 MALES
31.3
MEDIAN AGE
3.8
AVG FAMILY SIZE
3.4
AVG HOUSEHOLD SIZE
11,665
LABOR FORCE [ PEOPLE ]
61.6%
PERCENT IN LABOR FORCE
10.3%
UNEMPLOYMENT RATE
Selma Zip Codes
Selma Area Codes
Income in Selma
Income Overview in Selma
Per Capita Income in Selma is $21,714, while median incomes of families and households are $58,562 and $53,874 respectively.
| Characteristic | Number | Measure |
| Per Capita Income | 24,576 | $21,714 |
| Median Family Income | 5,596 | $58,562 |
| Mean Family Income | 5,596 | $70,584 |
| Median Household Income | 7,272 | $53,874 |
| Mean Household Income | 7,272 | $69,548 |
| Income Deficit | 5,596 | $8,699 |
| Wage / Income Gap (%) | 24,576 | 14.86% |
| Wage / Income Gap ($) | 24,576 | 85.14¢ per $1 |
| Gini / Inequality Index | 24,576 | 0.46 |
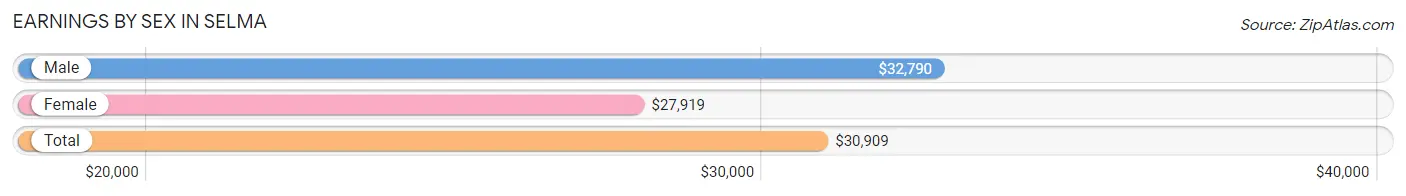
Earnings by Sex in Selma
Average Earnings in Selma are $30,909, $32,790 for men and $27,919 for women, a difference of 14.9%.
| Sex | Number | Average Earnings |
| Male | 6,385 (57.2%) | $32,790 |
| Female | 4,780 (42.8%) | $27,919 |
| Total | 11,165 (100.0%) | $30,909 |
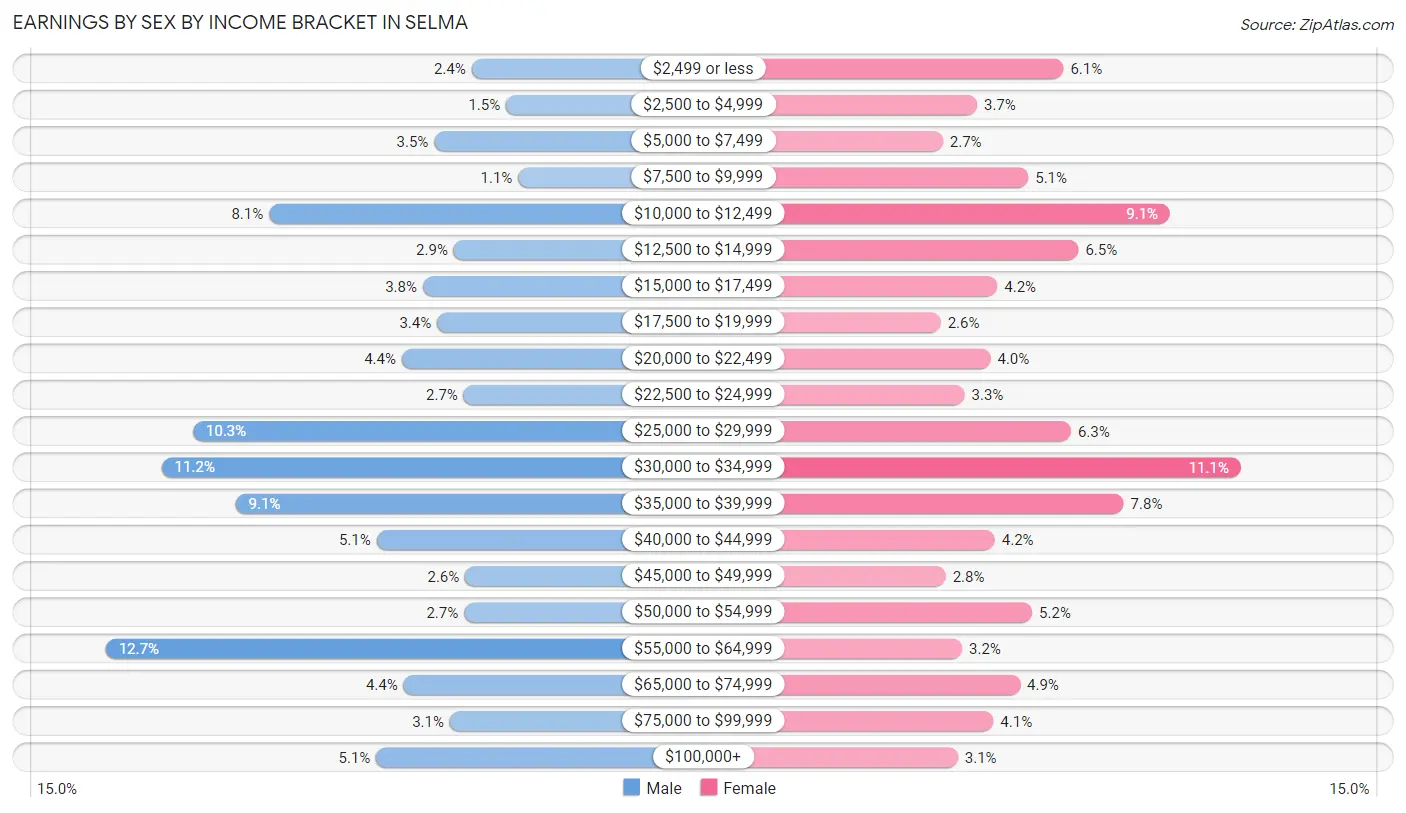
Earnings by Sex by Income Bracket in Selma
The most common earnings brackets in Selma are $55,000 to $64,999 for men (812 | 12.7%) and $30,000 to $34,999 for women (529 | 11.1%).
| Income | Male | Female |
| $2,499 or less | 156 (2.4%) | 291 (6.1%) |
| $2,500 to $4,999 | 94 (1.5%) | 175 (3.7%) |
| $5,000 to $7,499 | 223 (3.5%) | 129 (2.7%) |
| $7,500 to $9,999 | 72 (1.1%) | 244 (5.1%) |
| $10,000 to $12,499 | 519 (8.1%) | 434 (9.1%) |
| $12,500 to $14,999 | 188 (2.9%) | 311 (6.5%) |
| $15,000 to $17,499 | 243 (3.8%) | 202 (4.2%) |
| $17,500 to $19,999 | 218 (3.4%) | 126 (2.6%) |
| $20,000 to $22,499 | 281 (4.4%) | 193 (4.0%) |
| $22,500 to $24,999 | 170 (2.7%) | 158 (3.3%) |
| $25,000 to $29,999 | 656 (10.3%) | 301 (6.3%) |
| $30,000 to $34,999 | 712 (11.2%) | 529 (11.1%) |
| $35,000 to $39,999 | 579 (9.1%) | 372 (7.8%) |
| $40,000 to $44,999 | 326 (5.1%) | 199 (4.2%) |
| $45,000 to $49,999 | 167 (2.6%) | 133 (2.8%) |
| $50,000 to $54,999 | 169 (2.6%) | 249 (5.2%) |
| $55,000 to $64,999 | 812 (12.7%) | 155 (3.2%) |
| $65,000 to $74,999 | 278 (4.3%) | 233 (4.9%) |
| $75,000 to $99,999 | 195 (3.0%) | 197 (4.1%) |
| $100,000+ | 327 (5.1%) | 149 (3.1%) |
| Total | 6,385 (100.0%) | 4,780 (100.0%) |
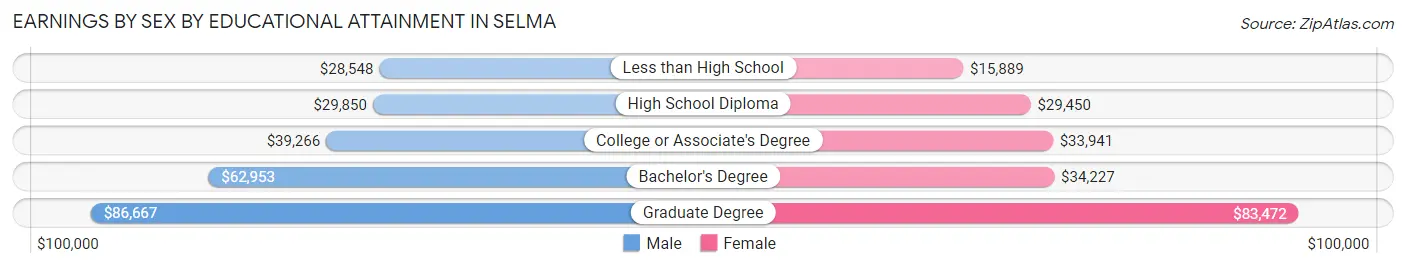
Earnings by Sex by Educational Attainment in Selma
Average earnings in Selma are $35,449 for men and $31,041 for women, a difference of 12.4%. Men with an educational attainment of graduate degree enjoy the highest average annual earnings of $86,667, while those with less than high school education earn the least with $28,548. Women with an educational attainment of graduate degree earn the most with the average annual earnings of $83,472, while those with less than high school education have the smallest earnings of $15,889.
| Educational Attainment | Male Income | Female Income |
| Less than High School | $28,548 | $15,889 |
| High School Diploma | $29,850 | $29,450 |
| College or Associate's Degree | $39,266 | $33,941 |
| Bachelor's Degree | $62,953 | $34,227 |
| Graduate Degree | $86,667 | $83,472 |
| Total | $35,449 | $31,041 |
Family Income in Selma
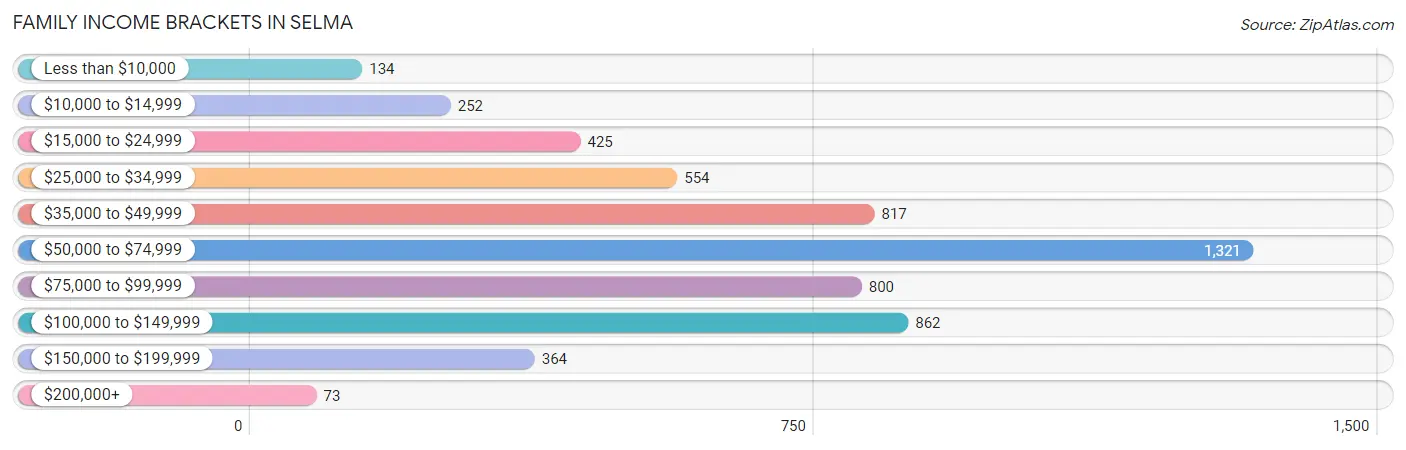
Family Income Brackets in Selma
According to the Selma family income data, there are 1,321 families falling into the $50,000 to $74,999 income range, which is the most common income bracket and makes up 23.6% of all families. Conversely, the $200,000+ income bracket is the least frequent group with only 73 families (1.3%) belonging to this category.
| Income Bracket | # Families | % Families |
| Less than $10,000 | 134 | 2.4% |
| $10,000 to $14,999 | 252 | 4.5% |
| $15,000 to $24,999 | 425 | 7.6% |
| $25,000 to $34,999 | 554 | 9.9% |
| $35,000 to $49,999 | 817 | 14.6% |
| $50,000 to $74,999 | 1,321 | 23.6% |
| $75,000 to $99,999 | 800 | 14.3% |
| $100,000 to $149,999 | 862 | 15.4% |
| $150,000 to $199,999 | 364 | 6.5% |
| $200,000+ | 73 | 1.3% |
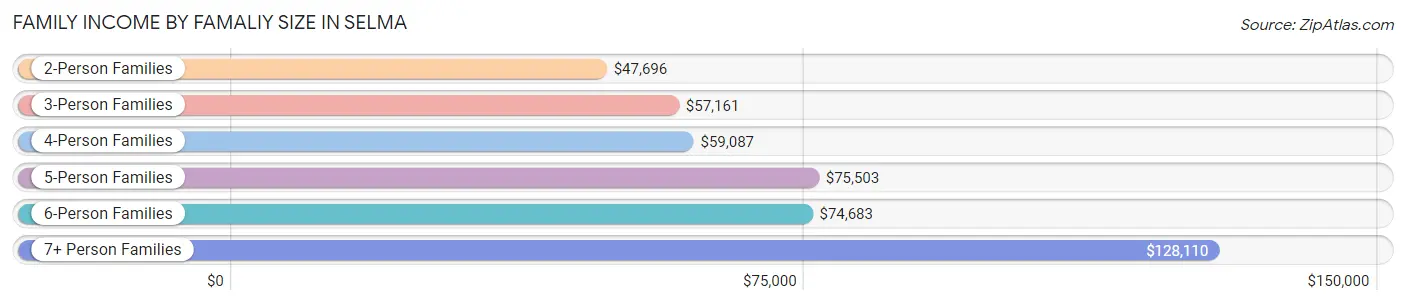
Family Income by Famaliy Size in Selma
7+ person families (226 | 4.0%) account for the highest median family income in Selma with $128,110 per family, while 2-person families (1,809 | 32.3%) have the highest median income of $23,848 per family member.
| Income Bracket | # Families | Median Income |
| 2-Person Families | 1,809 (32.3%) | $47,696 |
| 3-Person Families | 1,195 (21.3%) | $57,161 |
| 4-Person Families | 1,164 (20.8%) | $59,087 |
| 5-Person Families | 782 (14.0%) | $75,503 |
| 6-Person Families | 420 (7.5%) | $74,683 |
| 7+ Person Families | 226 (4.0%) | $128,110 |
| Total | 5,596 (100.0%) | $58,562 |
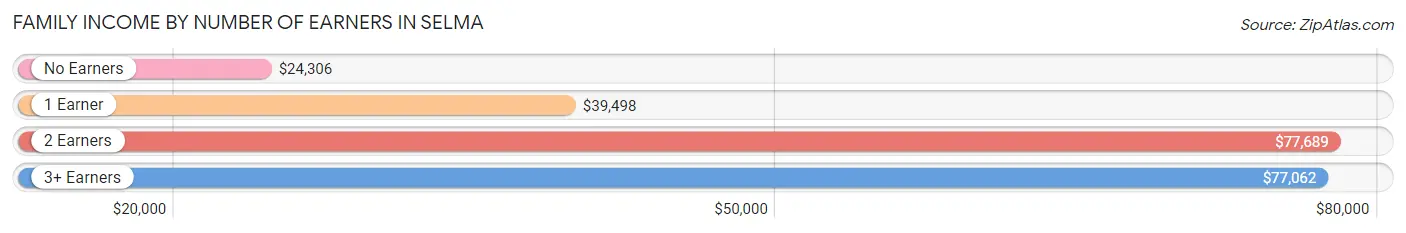
Family Income by Number of Earners in Selma
The median family income in Selma is $58,562, with families comprising 2 earners (1,947) having the highest median family income of $77,689, while families with no earners (576) have the lowest median family income of $24,306, accounting for 34.8% and 10.3% of families, respectively.
| Number of Earners | # Families | Median Income |
| No Earners | 576 (10.3%) | $24,306 |
| 1 Earner | 2,071 (37.0%) | $39,498 |
| 2 Earners | 1,947 (34.8%) | $77,689 |
| 3+ Earners | 1,002 (17.9%) | $77,062 |
| Total | 5,596 (100.0%) | $58,562 |
Household Income in Selma
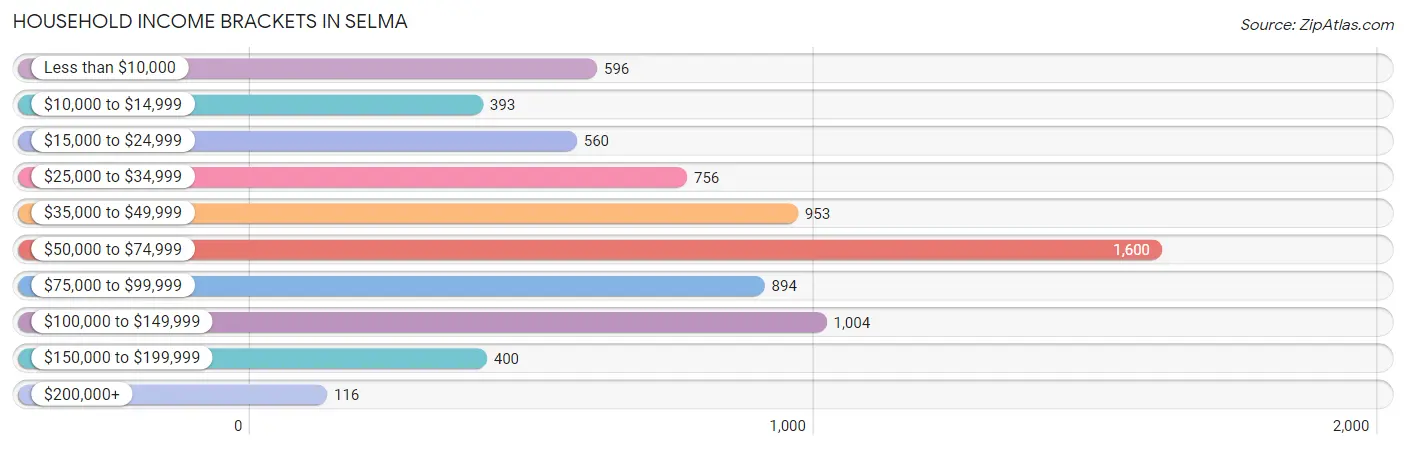
Household Income Brackets in Selma
With 1,600 households falling in the category, the $50,000 to $74,999 income range is the most frequent in Selma, accounting for 22.0% of all households. In contrast, only 116 households (1.6%) fall into the $200,000+ income bracket, making it the least populous group.
| Income Bracket | # Households | % Households |
| Less than $10,000 | 596 | 8.2% |
| $10,000 to $14,999 | 393 | 5.4% |
| $15,000 to $24,999 | 560 | 7.7% |
| $25,000 to $34,999 | 756 | 10.4% |
| $35,000 to $49,999 | 953 | 13.1% |
| $50,000 to $74,999 | 1,600 | 22.0% |
| $75,000 to $99,999 | 894 | 12.3% |
| $100,000 to $149,999 | 1,004 | 13.8% |
| $150,000 to $199,999 | 400 | 5.5% |
| $200,000+ | 116 | 1.6% |
Household Income by Householder Age in Selma
The median household income in Selma is $53,874, with the highest median household income of $67,064 found in the 45 to 64 years age bracket for the primary householder. A total of 2,575 households (35.4%) fall into this category. Meanwhile, the 15 to 24 years age bracket for the primary householder has the lowest median household income of $35,493, with 381 households (5.2%) in this group.
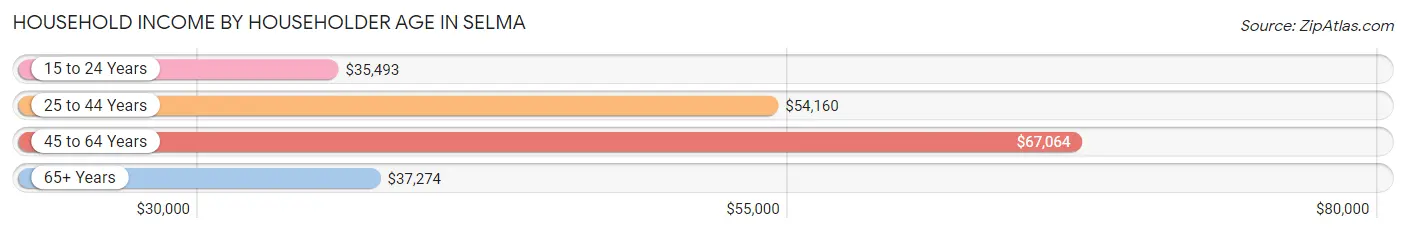
| Income Bracket | # Households | Median Income |
| 15 to 24 Years | 381 (5.2%) | $35,493 |
| 25 to 44 Years | 2,681 (36.9%) | $54,160 |
| 45 to 64 Years | 2,575 (35.4%) | $67,064 |
| 65+ Years | 1,635 (22.5%) | $37,274 |
| Total | 7,272 (100.0%) | $53,874 |
Poverty in Selma
Income Below Poverty by Sex and Age in Selma
With 20.5% poverty level for males and 21.9% for females among the residents of Selma, under 5 year old males and 15 year old females are the most vulnerable to poverty, with 457 males (59.5%) and 34 females (38.2%) in their respective age groups living below the poverty level.
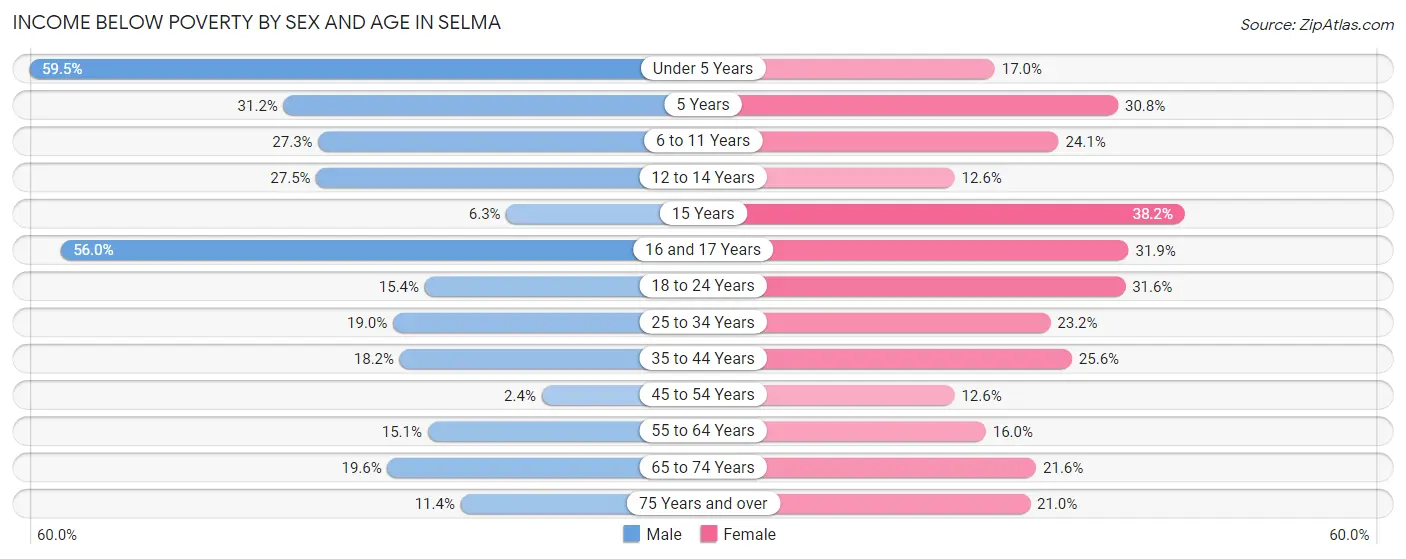
| Age Bracket | Male | Female |
| Under 5 Years | 457 (59.5%) | 144 (17.0%) |
| 5 Years | 38 (31.1%) | 36 (30.8%) |
| 6 to 11 Years | 248 (27.3%) | 309 (24.1%) |
| 12 to 14 Years | 151 (27.5%) | 69 (12.6%) |
| 15 Years | 17 (6.3%) | 34 (38.2%) |
| 16 and 17 Years | 237 (56.0%) | 168 (31.9%) |
| 18 to 24 Years | 310 (15.4%) | 309 (31.6%) |
| 25 to 34 Years | 390 (19.0%) | 390 (23.2%) |
| 35 to 44 Years | 300 (18.2%) | 425 (25.6%) |
| 45 to 54 Years | 32 (2.4%) | 148 (12.6%) |
| 55 to 64 Years | 202 (15.1%) | 202 (16.0%) |
| 65 to 74 Years | 148 (19.6%) | 230 (21.6%) |
| 75 Years and over | 36 (11.4%) | 127 (21.0%) |
| Total | 2,566 (20.5%) | 2,591 (21.9%) |
Income Above Poverty by Sex and Age in Selma
According to the poverty statistics in Selma, males aged 45 to 54 years and females aged 45 to 54 years are the age groups that are most secure financially, with 97.6% of males and 87.5% of females in these age groups living above the poverty line.
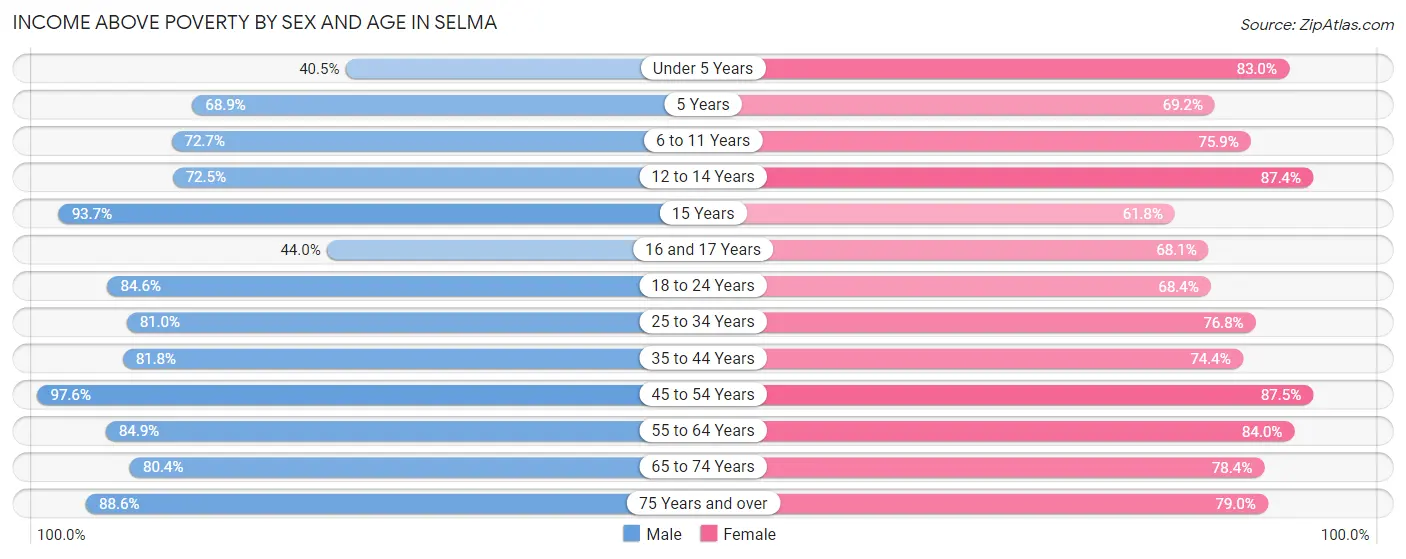
| Age Bracket | Male | Female |
| Under 5 Years | 311 (40.5%) | 701 (83.0%) |
| 5 Years | 84 (68.9%) | 81 (69.2%) |
| 6 to 11 Years | 661 (72.7%) | 971 (75.9%) |
| 12 to 14 Years | 398 (72.5%) | 480 (87.4%) |
| 15 Years | 251 (93.7%) | 55 (61.8%) |
| 16 and 17 Years | 186 (44.0%) | 358 (68.1%) |
| 18 to 24 Years | 1,701 (84.6%) | 670 (68.4%) |
| 25 to 34 Years | 1,667 (81.0%) | 1,289 (76.8%) |
| 35 to 44 Years | 1,347 (81.8%) | 1,233 (74.4%) |
| 45 to 54 Years | 1,294 (97.6%) | 1,031 (87.5%) |
| 55 to 64 Years | 1,136 (84.9%) | 1,057 (84.0%) |
| 65 to 74 Years | 608 (80.4%) | 833 (78.4%) |
| 75 Years and over | 279 (88.6%) | 479 (79.0%) |
| Total | 9,923 (79.4%) | 9,238 (78.1%) |
Income Below Poverty Among Married-Couple Families in Selma
The poverty statistics for married-couple families in Selma show that 15.8% or 474 of the total 3,008 families live below the poverty line. Families with 3 or 4 children have the highest poverty rate of 27.5%, comprising of 159 families. On the other hand, families with 5 or more children have the lowest poverty rate of 0.0%, which includes 0 families.
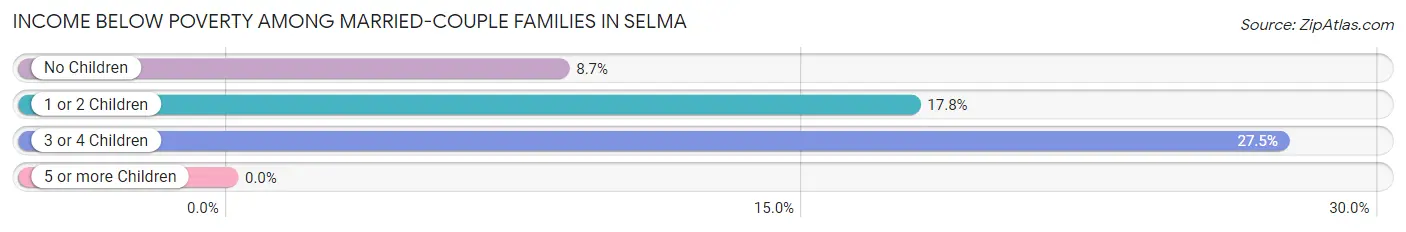
| Children | Above Poverty | Below Poverty |
| No Children | 1,120 (91.3%) | 106 (8.6%) |
| 1 or 2 Children | 964 (82.2%) | 209 (17.8%) |
| 3 or 4 Children | 420 (72.5%) | 159 (27.5%) |
| 5 or more Children | 30 (100.0%) | 0 (0.0%) |
| Total | 2,534 (84.2%) | 474 (15.8%) |
Income Below Poverty Among Single-Parent Households in Selma
According to the poverty data in Selma, 8.6% or 88 single-father households and 24.1% or 377 single-mother households are living below the poverty line. Among single-father households, those with 3 or 4 children have the highest poverty rate, with 58 households (92.1%) experiencing poverty. Likewise, among single-mother households, those with 3 or 4 children have the highest poverty rate, with 85 households (59.0%) falling below the poverty line.
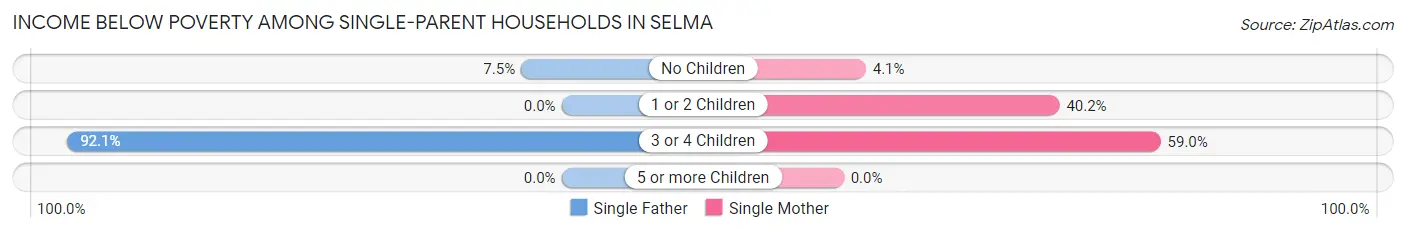
| Children | Single Father | Single Mother |
| No Children | 30 (7.5%) | 32 (4.1%) |
| 1 or 2 Children | 0 (0.0%) | 260 (40.2%) |
| 3 or 4 Children | 58 (92.1%) | 85 (59.0%) |
| 5 or more Children | 0 (0.0%) | 0 (0.0%) |
| Total | 88 (8.6%) | 377 (24.1%) |
Income Below Poverty Among Married-Couple vs Single-Parent Households in Selma
The poverty data for Selma shows that 474 of the married-couple family households (15.8%) and 465 of the single-parent households (18.0%) are living below the poverty level. Within the married-couple family households, those with 3 or 4 children have the highest poverty rate, with 159 households (27.5%) falling below the poverty line. Among the single-parent households, those with 3 or 4 children have the highest poverty rate, with 143 household (69.1%) living below poverty.
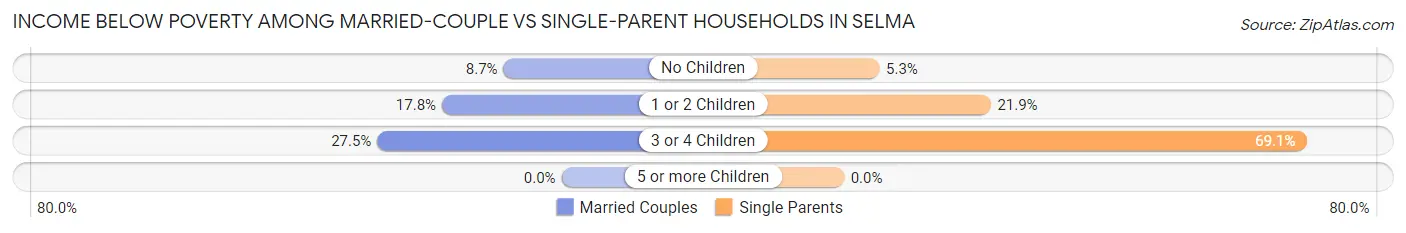
| Children | Married-Couple Families | Single-Parent Households |
| No Children | 106 (8.6%) | 62 (5.3%) |
| 1 or 2 Children | 209 (17.8%) | 260 (21.9%) |
| 3 or 4 Children | 159 (27.5%) | 143 (69.1%) |
| 5 or more Children | 0 (0.0%) | 0 (0.0%) |
| Total | 474 (15.8%) | 465 (18.0%) |
Race in Selma
The most populous races in Selma are Hispanic or Latino (20,638 | 84.0%), White / Caucasian (14,449 | 58.8%), and Some other Race (5,657 | 23.0%).
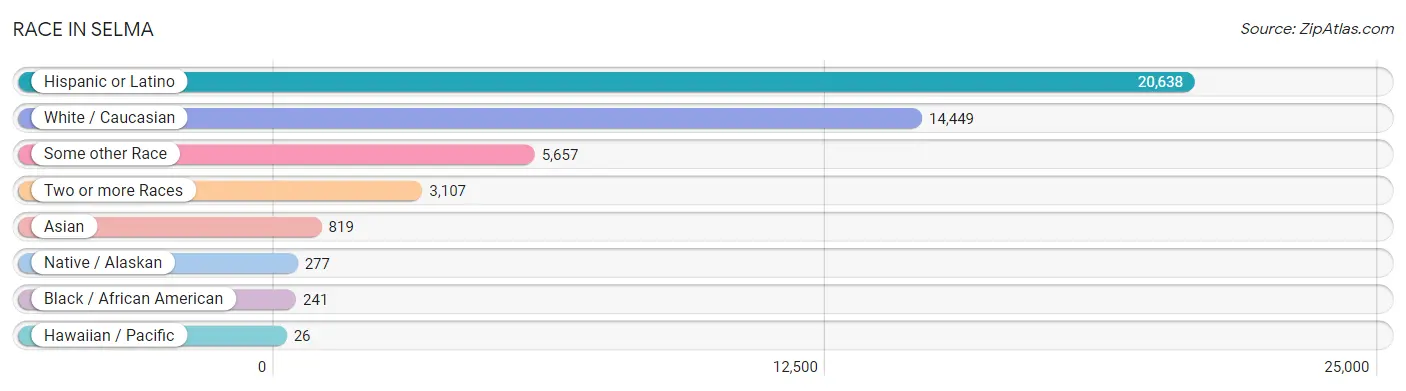
| Race | # Population | % Population |
| Asian | 819 | 3.3% |
| Black / African American | 241 | 1.0% |
| Hawaiian / Pacific | 26 | 0.1% |
| Hispanic or Latino | 20,638 | 84.0% |
| Native / Alaskan | 277 | 1.1% |
| White / Caucasian | 14,449 | 58.8% |
| Two or more Races | 3,107 | 12.6% |
| Some other Race | 5,657 | 23.0% |
| Total | 24,576 | 100.0% |
Ancestry in Selma
The most populous ancestries reported in Selma are Mexican (19,998 | 81.4%), Irish (703 | 2.9%), German (643 | 2.6%), Thai (636 | 2.6%), and English (483 | 2.0%), together accounting for 91.4% of all Selma residents.
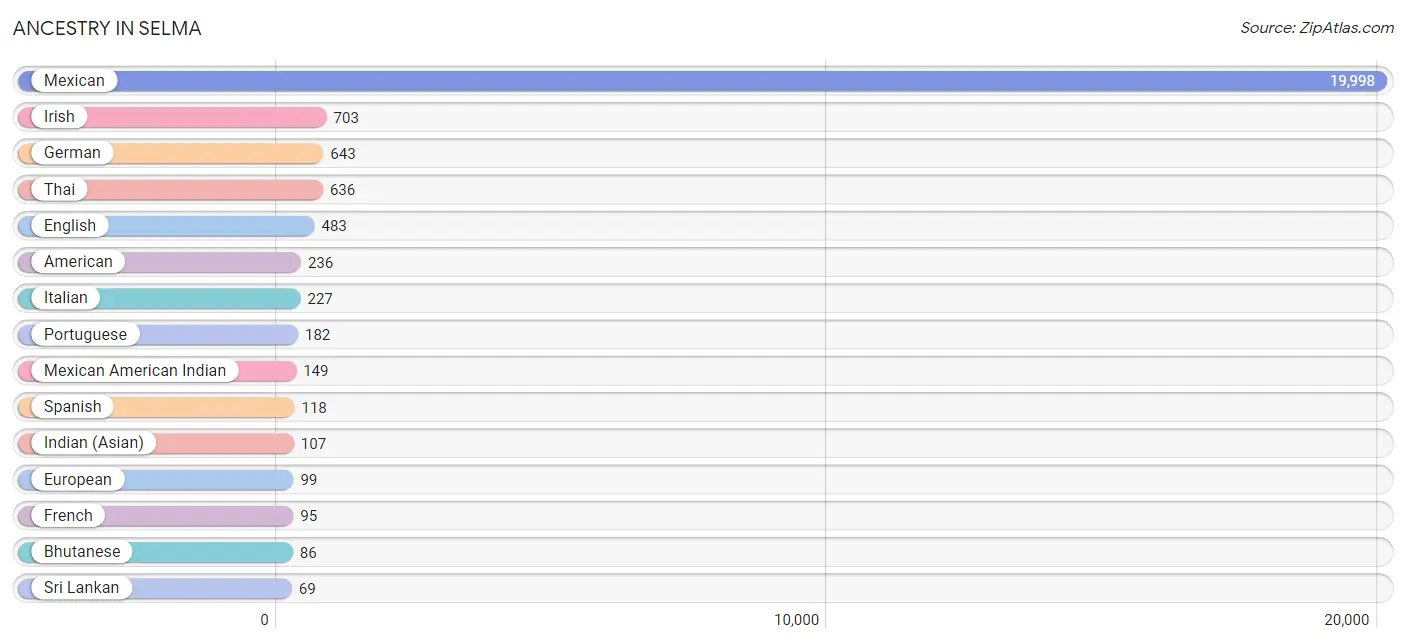
| Ancestry | # Population | % Population |
| African | 1 | 0.0% |
| American | 236 | 1.0% |
| Apache | 9 | 0.0% |
| Arab | 13 | 0.1% |
| Armenian | 32 | 0.1% |
| Basque | 20 | 0.1% |
| Bhutanese | 86 | 0.4% |
| Blackfeet | 18 | 0.1% |
| British | 23 | 0.1% |
| Canadian | 9 | 0.0% |
| Central American | 64 | 0.3% |
| Cherokee | 13 | 0.1% |
| Chickasaw | 15 | 0.1% |
| Choctaw | 14 | 0.1% |
| Czech | 28 | 0.1% |
| Danish | 57 | 0.2% |
| Dutch | 61 | 0.3% |
| English | 483 | 2.0% |
| Estonian | 18 | 0.1% |
| European | 99 | 0.4% |
| French | 95 | 0.4% |
| German | 643 | 2.6% |
| Haitian | 3 | 0.0% |
| Honduran | 28 | 0.1% |
| Hungarian | 48 | 0.2% |
| Indian (Asian) | 107 | 0.4% |
| Irish | 703 | 2.9% |
| Italian | 227 | 0.9% |
| Jamaican | 65 | 0.3% |
| Korean | 19 | 0.1% |
| Mexican | 19,998 | 81.4% |
| Mexican American Indian | 149 | 0.6% |
| Navajo | 21 | 0.1% |
| Northern European | 8 | 0.0% |
| Norwegian | 41 | 0.2% |
| Portuguese | 182 | 0.7% |
| Puerto Rican | 34 | 0.1% |
| Russian | 12 | 0.1% |
| Salvadoran | 36 | 0.2% |
| Samoan | 26 | 0.1% |
| Scottish | 27 | 0.1% |
| Spaniard | 5 | 0.0% |
| Spanish | 118 | 0.5% |
| Sri Lankan | 69 | 0.3% |
| Subsaharan African | 4 | 0.0% |
| Swedish | 40 | 0.2% |
| Thai | 636 | 2.6% |
| Yaqui | 9 | 0.0% | View All 48 Rows |
Immigrants in Selma
The most numerous immigrant groups reported in Selma came from Latin America (5,324 | 21.7%), Central America (5,313 | 21.6%), Mexico (5,225 | 21.3%), Asia (532 | 2.2%), and South Central Asia (288 | 1.2%), together accounting for 67.9% of all Selma residents.
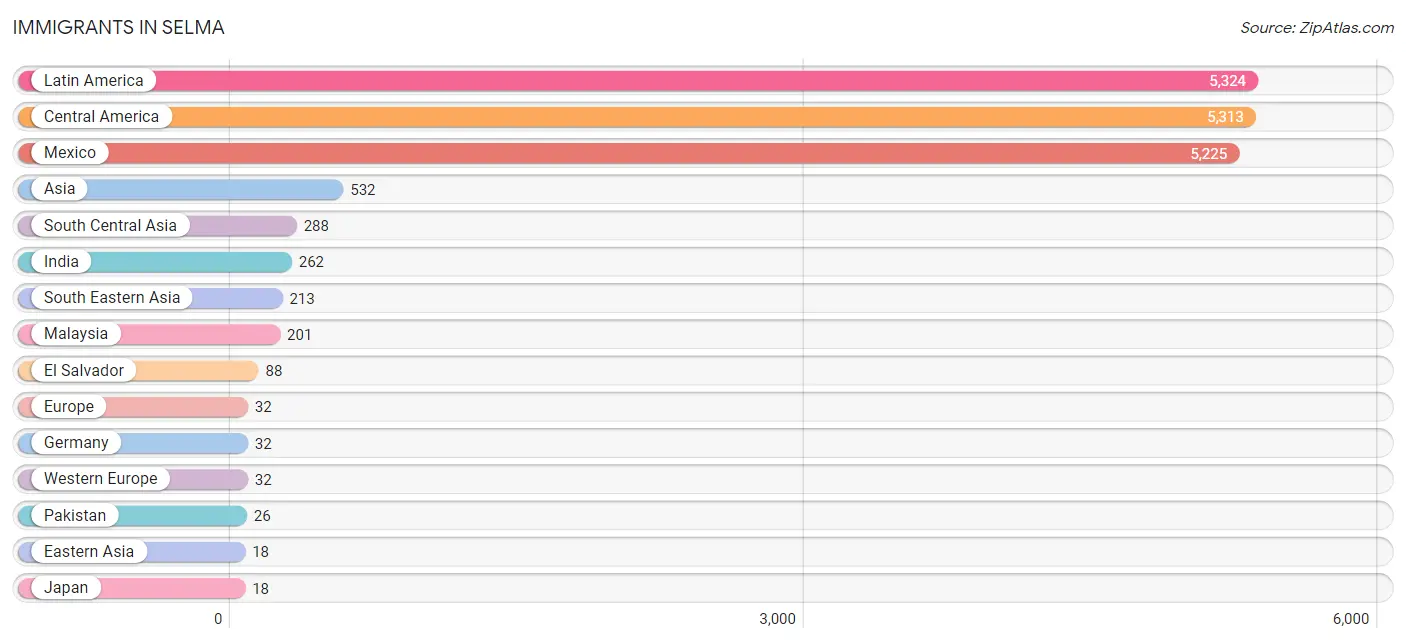
| Immigration Origin | # Population | % Population |
| Africa | 3 | 0.0% |
| Asia | 532 | 2.2% |
| Canada | 9 | 0.0% |
| Caribbean | 11 | 0.0% |
| Central America | 5,313 | 21.6% |
| Eastern Asia | 18 | 0.1% |
| El Salvador | 88 | 0.4% |
| Europe | 32 | 0.1% |
| Germany | 32 | 0.1% |
| India | 262 | 1.1% |
| Jamaica | 11 | 0.0% |
| Japan | 18 | 0.1% |
| Latin America | 5,324 | 21.7% |
| Malaysia | 201 | 0.8% |
| Mexico | 5,225 | 21.3% |
| Oceania | 15 | 0.1% |
| Pakistan | 26 | 0.1% |
| Philippines | 12 | 0.1% |
| South Central Asia | 288 | 1.2% |
| South Eastern Asia | 213 | 0.9% |
| Western Asia | 13 | 0.1% |
| Western Europe | 32 | 0.1% |
| Yemen | 13 | 0.1% | View All 23 Rows |
Sex and Age in Selma
Sex and Age in Selma
The most populous age groups in Selma are 20 to 24 Years (1,402 | 11.1%) for men and 25 to 29 Years (1,135 | 9.5%) for women.
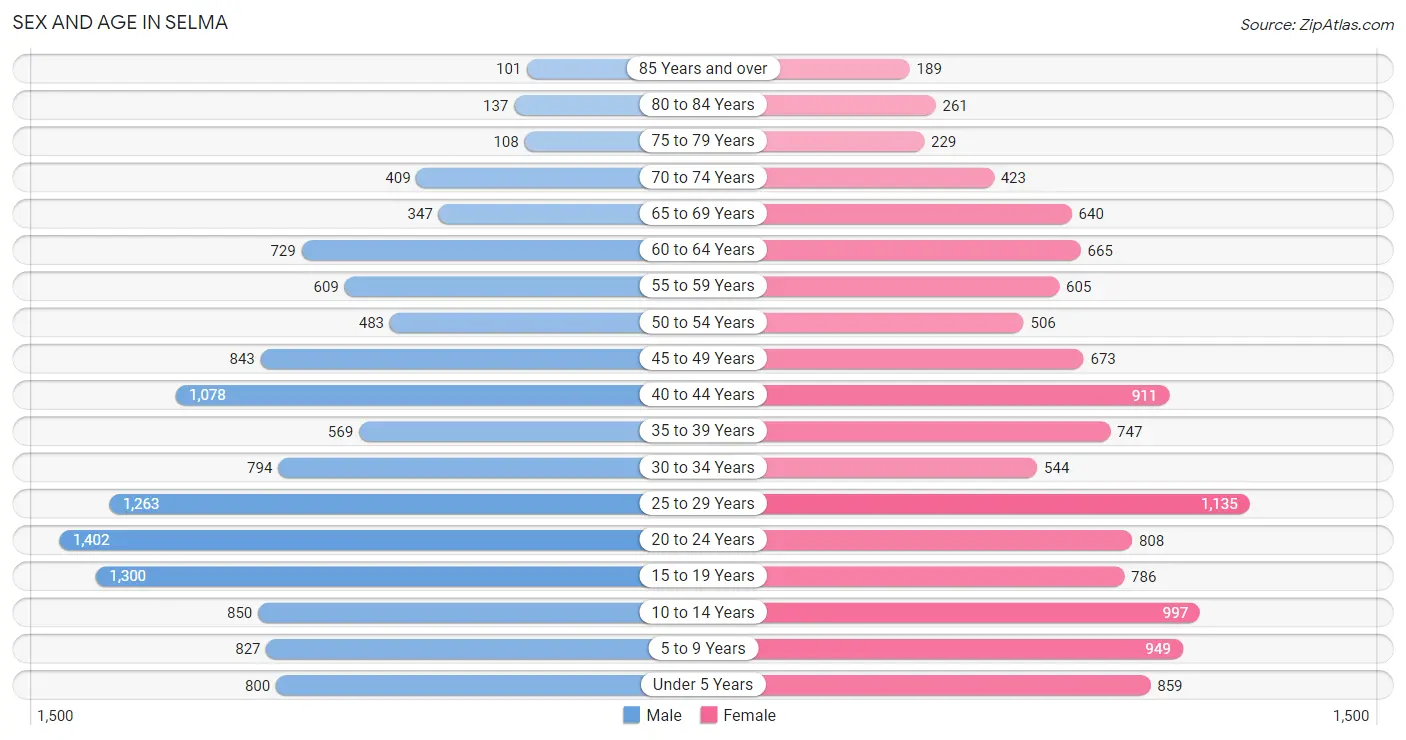
| Age Bracket | Male | Female |
| Under 5 Years | 800 (6.3%) | 859 (7.2%) |
| 5 to 9 Years | 827 (6.5%) | 949 (8.0%) |
| 10 to 14 Years | 850 (6.7%) | 997 (8.4%) |
| 15 to 19 Years | 1,300 (10.3%) | 786 (6.6%) |
| 20 to 24 Years | 1,402 (11.1%) | 808 (6.8%) |
| 25 to 29 Years | 1,263 (10.0%) | 1,135 (9.5%) |
| 30 to 34 Years | 794 (6.3%) | 544 (4.6%) |
| 35 to 39 Years | 569 (4.5%) | 747 (6.3%) |
| 40 to 44 Years | 1,078 (8.5%) | 911 (7.6%) |
| 45 to 49 Years | 843 (6.7%) | 673 (5.6%) |
| 50 to 54 Years | 483 (3.8%) | 506 (4.2%) |
| 55 to 59 Years | 609 (4.8%) | 605 (5.1%) |
| 60 to 64 Years | 729 (5.8%) | 665 (5.6%) |
| 65 to 69 Years | 347 (2.7%) | 640 (5.4%) |
| 70 to 74 Years | 409 (3.2%) | 423 (3.5%) |
| 75 to 79 Years | 108 (0.9%) | 229 (1.9%) |
| 80 to 84 Years | 137 (1.1%) | 261 (2.2%) |
| 85 Years and over | 101 (0.8%) | 189 (1.6%) |
| Total | 12,649 (100.0%) | 11,927 (100.0%) |
Families and Households in Selma
Median Family Size in Selma
The median family size in Selma is 3.81 persons per family, with married-couple families (3,008 | 53.7%) accounting for the largest median family size of 4.15 persons per family. On the other hand, single male/father families (1,021 | 18.2%) represent the smallest median family size with 3.36 persons per family.
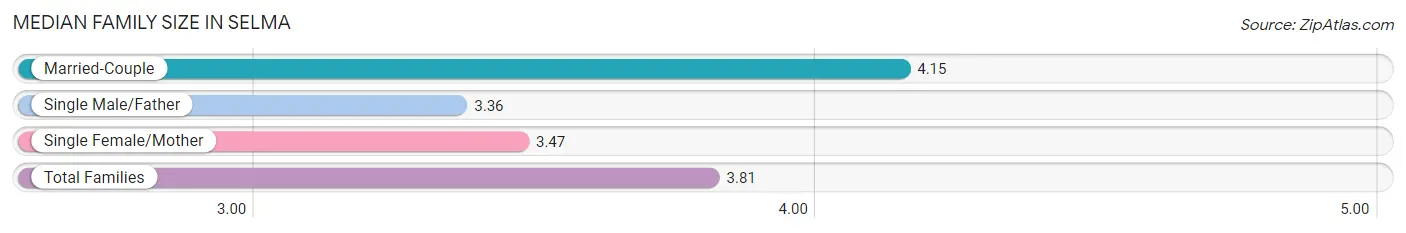
| Family Type | # Families | Family Size |
| Married-Couple | 3,008 (53.7%) | 4.15 |
| Single Male/Father | 1,021 (18.2%) | 3.36 |
| Single Female/Mother | 1,567 (28.0%) | 3.47 |
| Total Families | 5,596 (100.0%) | 3.81 |
Median Household Size in Selma
The median household size in Selma is 3.36 persons per household, with married-couple households (3,008 | 41.4%) accounting for the largest median household size of 4.15 persons per household. non-family households (1,676 | 23.1%) represent the smallest median household size with 1.15 persons per household.
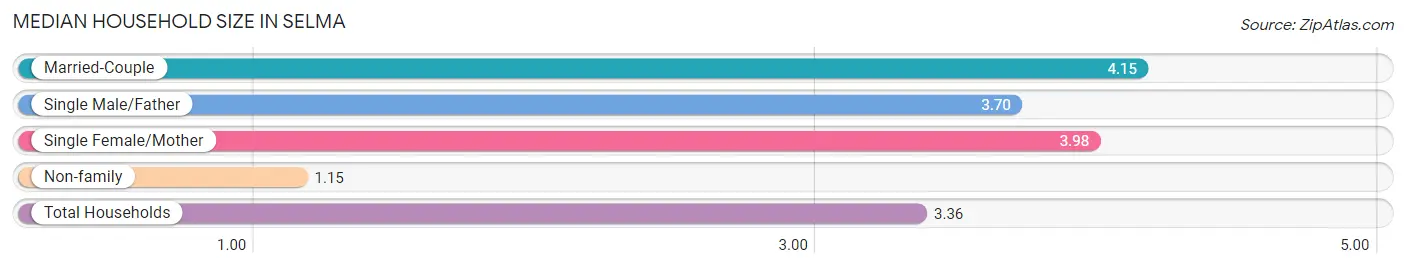
| Household Type | # Households | Household Size |
| Married-Couple | 3,008 (41.4%) | 4.15 |
| Single Male/Father | 1,021 (14.0%) | 3.70 |
| Single Female/Mother | 1,567 (21.5%) | 3.98 |
| Non-family | 1,676 (23.1%) | 1.15 |
| Total Households | 7,272 (100.0%) | 3.36 |
Household Size by Marriage Status in Selma
Out of a total of 7,272 households in Selma, 5,596 (76.9%) are family households, while 1,676 (23.1%) are nonfamily households. The most numerous type of family households are 2-person households, comprising 1,490, and the most common type of nonfamily households are 1-person households, comprising 1,539.
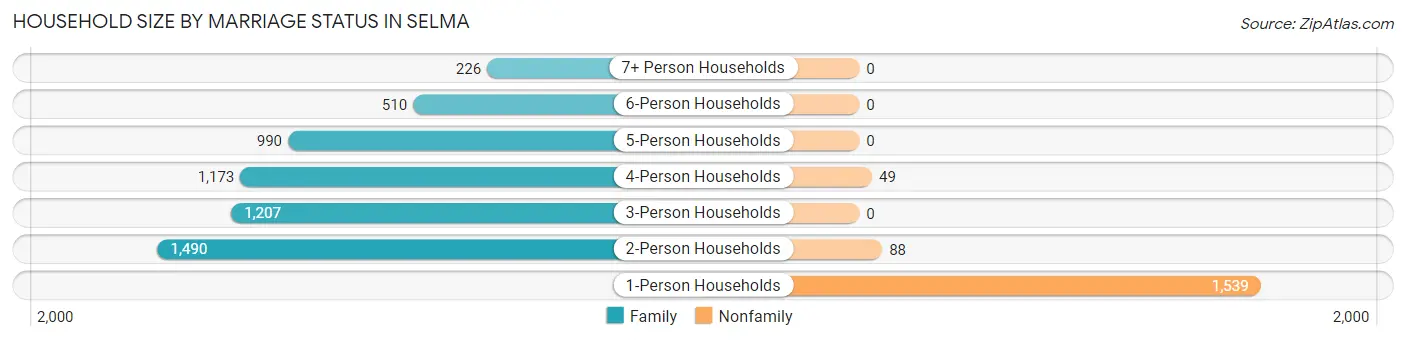
| Household Size | Family Households | Nonfamily Households |
| 1-Person Households | - | 1,539 (21.2%) |
| 2-Person Households | 1,490 (20.5%) | 88 (1.2%) |
| 3-Person Households | 1,207 (16.6%) | 0 (0.0%) |
| 4-Person Households | 1,173 (16.1%) | 49 (0.7%) |
| 5-Person Households | 990 (13.6%) | 0 (0.0%) |
| 6-Person Households | 510 (7.0%) | 0 (0.0%) |
| 7+ Person Households | 226 (3.1%) | 0 (0.0%) |
| Total | 5,596 (76.9%) | 1,676 (23.1%) |
Female Fertility in Selma
Fertility by Age in Selma
Average fertility rate in Selma is 45.0 births per 1,000 women. Women in the age bracket of 20 to 34 years have the highest fertility rate with 87.0 births per 1,000 women. Women in the age bracket of 20 to 34 years acount for 83.1% of all women with births.
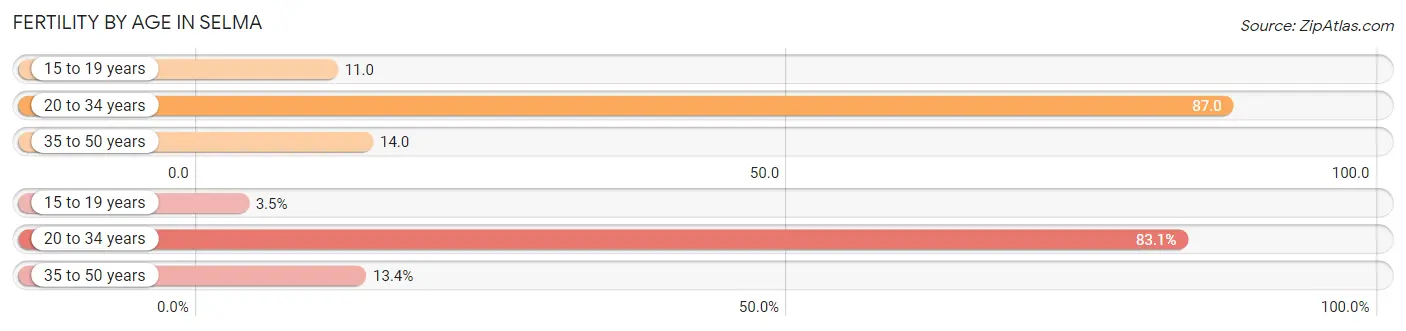
| Age Bracket | Women with Births | Births / 1,000 Women |
| 15 to 19 years | 9 (3.5%) | 11.0 |
| 20 to 34 years | 217 (83.1%) | 87.0 |
| 35 to 50 years | 35 (13.4%) | 14.0 |
| Total | 261 (100.0%) | 45.0 |
Fertility by Age by Marriage Status in Selma
31.8% of women with births (261) in Selma are married. The highest percentage of unmarried women with births falls into 20 to 34 years age bracket with 76.0% of them unmarried at the time of birth, while the lowest percentage of unmarried women with births belong to 15 to 19 years age bracket with 0.0% of them unmarried.
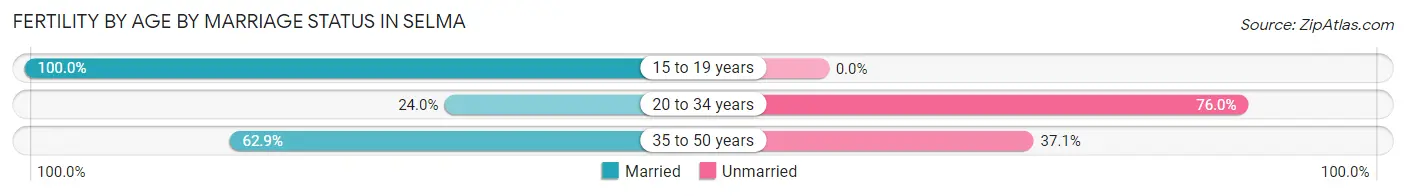
| Age Bracket | Married | Unmarried |
| 15 to 19 years | 9 (100.0%) | 0 (0.0%) |
| 20 to 34 years | 52 (24.0%) | 165 (76.0%) |
| 35 to 50 years | 22 (62.9%) | 13 (37.1%) |
| Total | 83 (31.8%) | 178 (68.2%) |
Fertility by Education in Selma
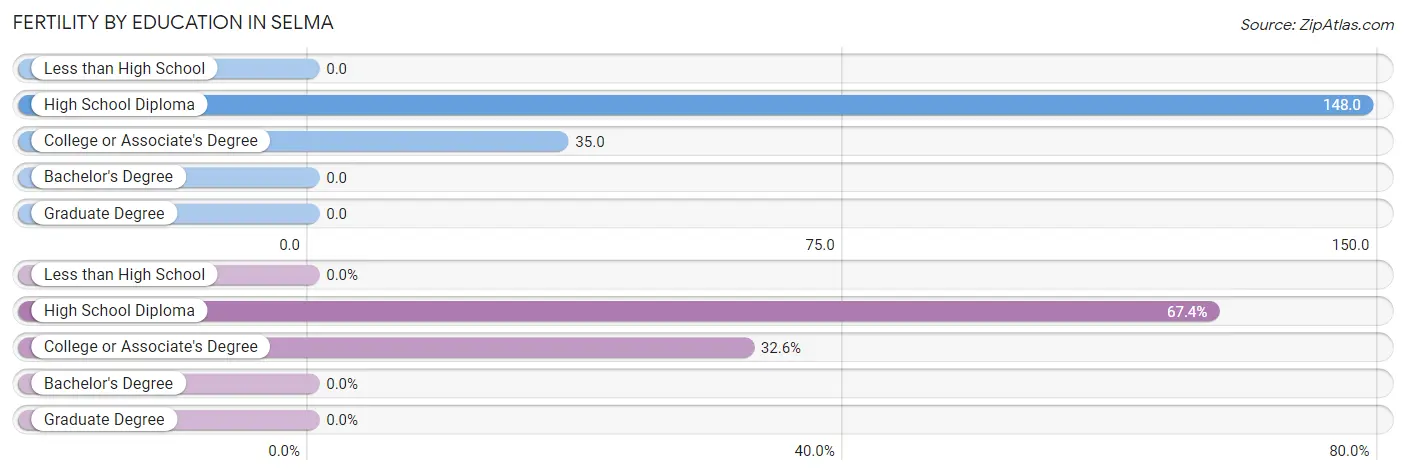
| Educational Attainment | Women with Births | Births / 1,000 Women |
| Less than High School | 0 (0.0%) | 0.0 |
| High School Diploma | 176 (67.4%) | 148.0 |
| College or Associate's Degree | 85 (32.6%) | 35.0 |
| Bachelor's Degree | 0 (0.0%) | 0.0 |
| Graduate Degree | 0 (0.0%) | 0.0 |
| Total | 261 (100.0%) | 45.0 |
Fertility by Education by Marriage Status in Selma
68.2% of women with births in Selma are unmarried. Women with the educational attainment of high school diploma are most likely to be married with 32.4% of them married at childbirth, while women with the educational attainment of college or associate's degree are least likely to be married with 69.4% of them unmarried at childbirth.
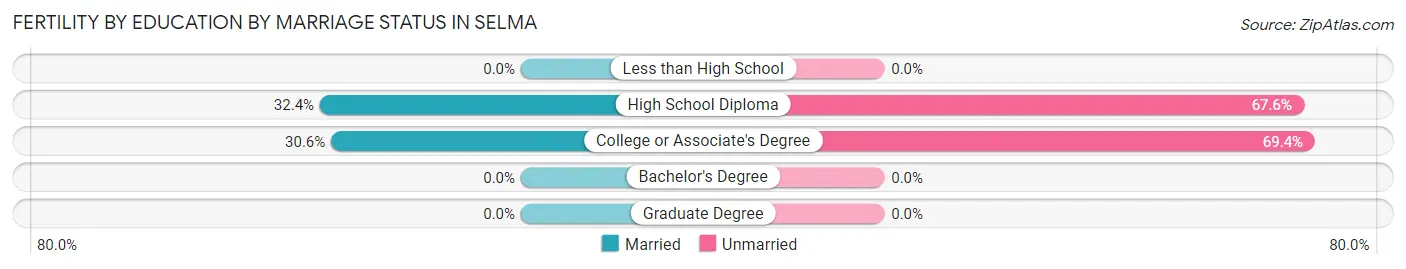
| Educational Attainment | Married | Unmarried |
| Less than High School | 0 (0.0%) | 0 (0.0%) |
| High School Diploma | 57 (32.4%) | 119 (67.6%) |
| College or Associate's Degree | 26 (30.6%) | 59 (69.4%) |
| Bachelor's Degree | 0 (0.0%) | 0 (0.0%) |
| Graduate Degree | 0 (0.0%) | 0 (0.0%) |
| Total | 83 (31.8%) | 178 (68.2%) |
Employment Characteristics in Selma
Employment by Class of Employer in Selma
Among the 9,998 employed individuals in Selma, private company employees (6,875 | 68.8%), local government employees (1,591 | 15.9%), and not-for-profit organizations (807 | 8.1%) make up the most common classes of employment.
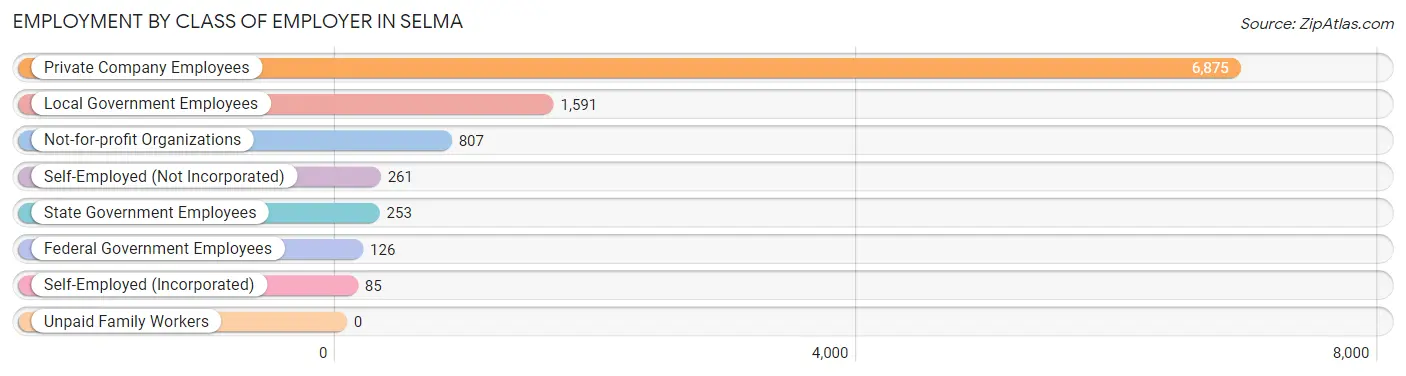
| Employer Class | # Employees | % Employees |
| Private Company Employees | 6,875 | 68.8% |
| Self-Employed (Incorporated) | 85 | 0.9% |
| Self-Employed (Not Incorporated) | 261 | 2.6% |
| Not-for-profit Organizations | 807 | 8.1% |
| Local Government Employees | 1,591 | 15.9% |
| State Government Employees | 253 | 2.5% |
| Federal Government Employees | 126 | 1.3% |
| Unpaid Family Workers | 0 | 0.0% |
| Total | 9,998 | 100.0% |
Employment Status by Age in Selma
According to the labor force statistics for Selma, out of the total population over 16 years of age (18,937), 61.6% or 11,665 individuals are in the labor force, with 10.3% or 1,201 of them unemployed. The age group with the highest labor force participation rate is 35 to 44 years, with 81.4% or 2,690 individuals in the labor force. Within the labor force, the 25 to 29 years age range has the highest percentage of unemployed individuals, with 25.8% or 494 of them being unemployed.
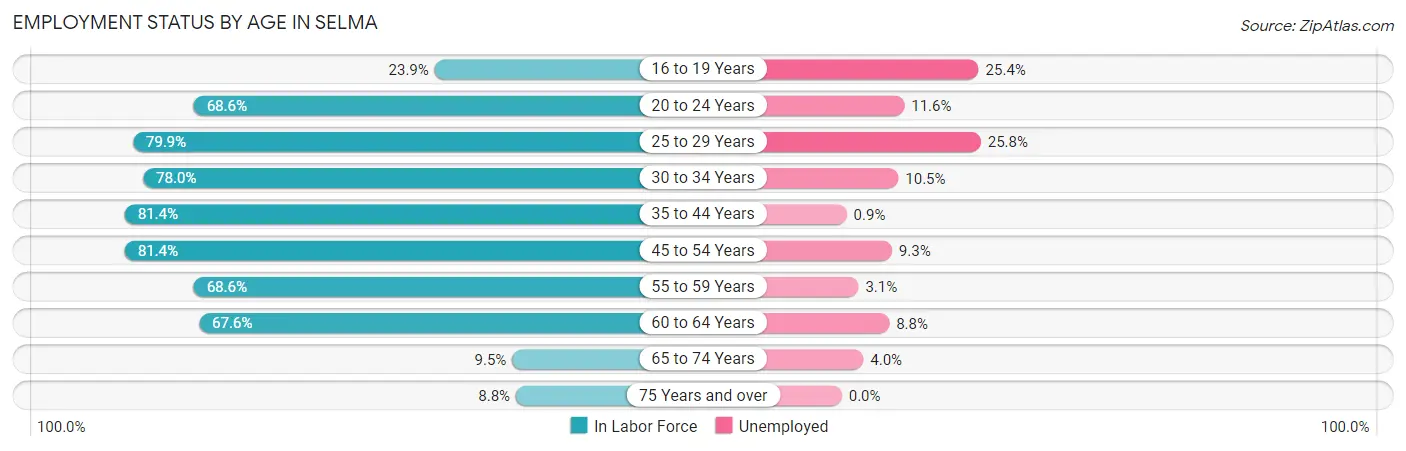
| Age Bracket | In Labor Force | Unemployed |
| 16 to 19 Years | 413 (23.9%) | 105 (25.4%) |
| 20 to 24 Years | 1,516 (68.6%) | 176 (11.6%) |
| 25 to 29 Years | 1,916 (79.9%) | 494 (25.8%) |
| 30 to 34 Years | 1,044 (78.0%) | 110 (10.5%) |
| 35 to 44 Years | 2,690 (81.4%) | 24 (0.9%) |
| 45 to 54 Years | 2,039 (81.4%) | 190 (9.3%) |
| 55 to 59 Years | 833 (68.6%) | 26 (3.1%) |
| 60 to 64 Years | 942 (67.6%) | 83 (8.8%) |
| 65 to 74 Years | 173 (9.5%) | 7 (4.0%) |
| 75 Years and over | 90 (8.8%) | 0 (0.0%) |
| Total | 11,665 (61.6%) | 1,201 (10.3%) |
Employment Status by Educational Attainment in Selma
According to labor force statistics for Selma, 77.9% of individuals (9,468) out of the total population between 25 and 64 years of age (12,154) are in the labor force, with 9.7% or 918 of them being unemployed. The group with the highest labor force participation rate are those with the educational attainment of bachelor's degree or higher, with 84.1% or 1,129 individuals in the labor force. Within the labor force, individuals with less than high school education have the highest percentage of unemployment, with 14.8% or 355 of them being unemployed.
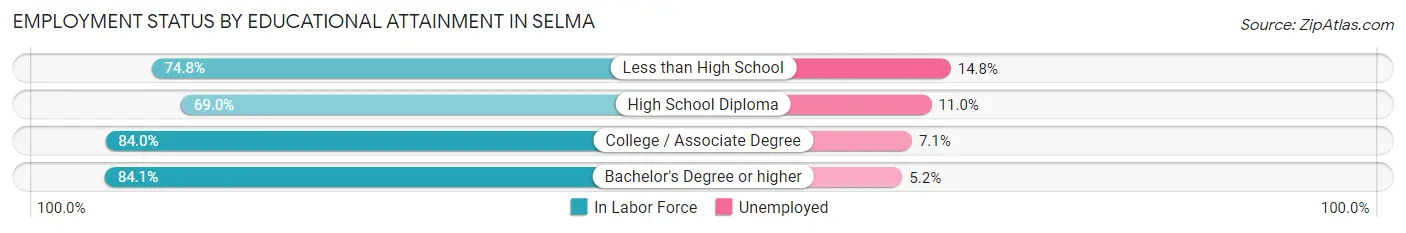
| Educational Attainment | In Labor Force | Unemployed |
| Less than High School | 2,397 (74.8%) | 474 (14.8%) |
| High School Diploma | 2,071 (69.0%) | 330 (11.0%) |
| College / Associate Degree | 3,867 (84.0%) | 327 (7.1%) |
| Bachelor's Degree or higher | 1,129 (84.1%) | 70 (5.2%) |
| Total | 9,468 (77.9%) | 1,179 (9.7%) |
Employment Occupations by Sex in Selma
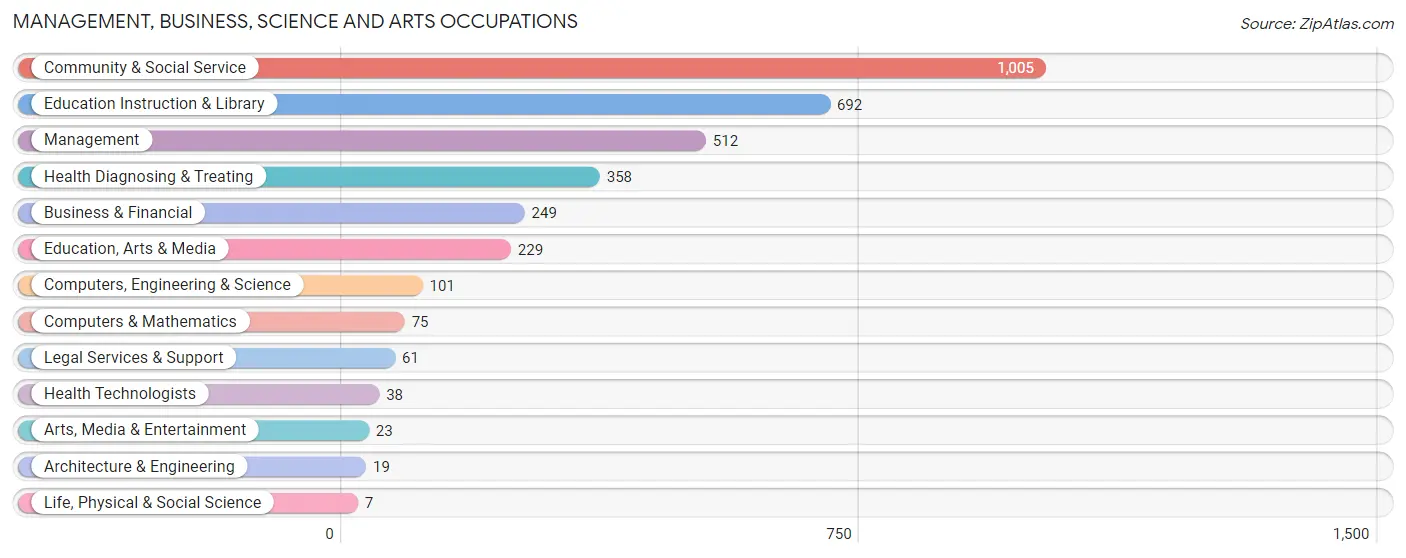
Management, Business, Science and Arts Occupations
The most common Management, Business, Science and Arts occupations in Selma are Community & Social Service (1,005 | 9.7%), Education Instruction & Library (692 | 6.7%), Management (512 | 5.0%), Health Diagnosing & Treating (358 | 3.5%), and Business & Financial (249 | 2.4%).
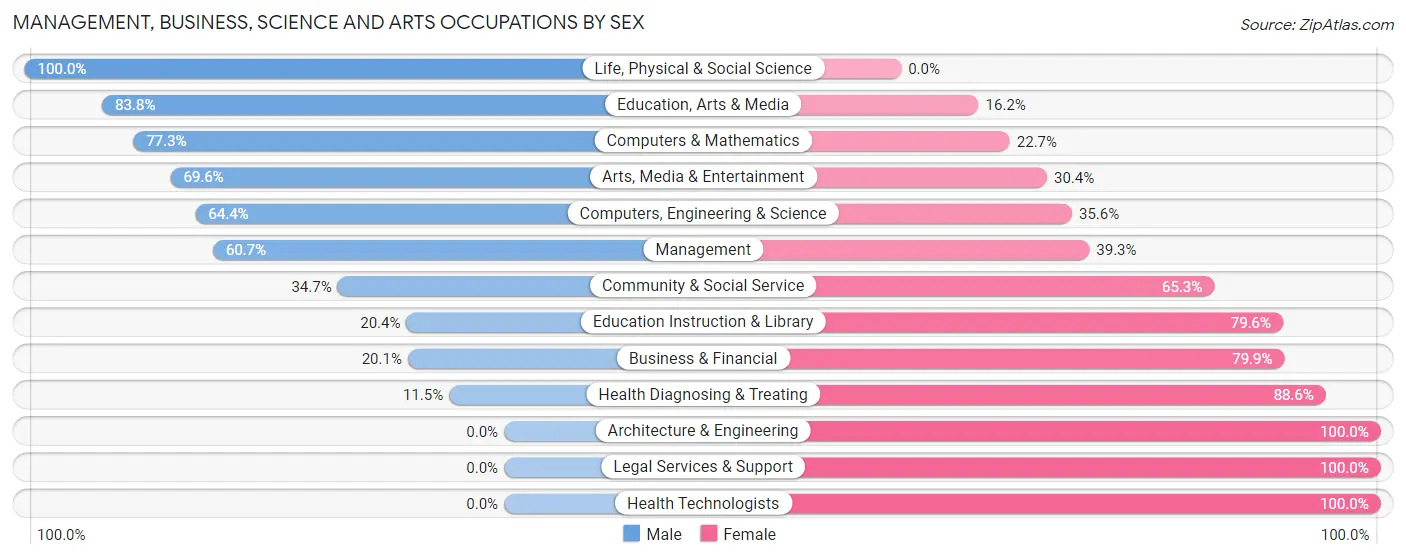
Management, Business, Science and Arts Occupations by Sex
Within the Management, Business, Science and Arts occupations in Selma, the most male-oriented occupations are Life, Physical & Social Science (100.0%), Education, Arts & Media (83.8%), and Computers & Mathematics (77.3%), while the most female-oriented occupations are Architecture & Engineering (100.0%), Legal Services & Support (100.0%), and Health Technologists (100.0%).
| Occupation | Male | Female |
| Management | 311 (60.7%) | 201 (39.3%) |
| Business & Financial | 50 (20.1%) | 199 (79.9%) |
| Computers, Engineering & Science | 65 (64.4%) | 36 (35.6%) |
| Computers & Mathematics | 58 (77.3%) | 17 (22.7%) |
| Architecture & Engineering | 0 (0.0%) | 19 (100.0%) |
| Life, Physical & Social Science | 7 (100.0%) | 0 (0.0%) |
| Community & Social Service | 349 (34.7%) | 656 (65.3%) |
| Education, Arts & Media | 192 (83.8%) | 37 (16.2%) |
| Legal Services & Support | 0 (0.0%) | 61 (100.0%) |
| Education Instruction & Library | 141 (20.4%) | 551 (79.6%) |
| Arts, Media & Entertainment | 16 (69.6%) | 7 (30.4%) |
| Health Diagnosing & Treating | 41 (11.5%) | 317 (88.5%) |
| Health Technologists | 0 (0.0%) | 38 (100.0%) |
| Total (Category) | 816 (36.7%) | 1,409 (63.3%) |
| Total (Overall) | 5,989 (57.9%) | 4,361 (42.1%) |
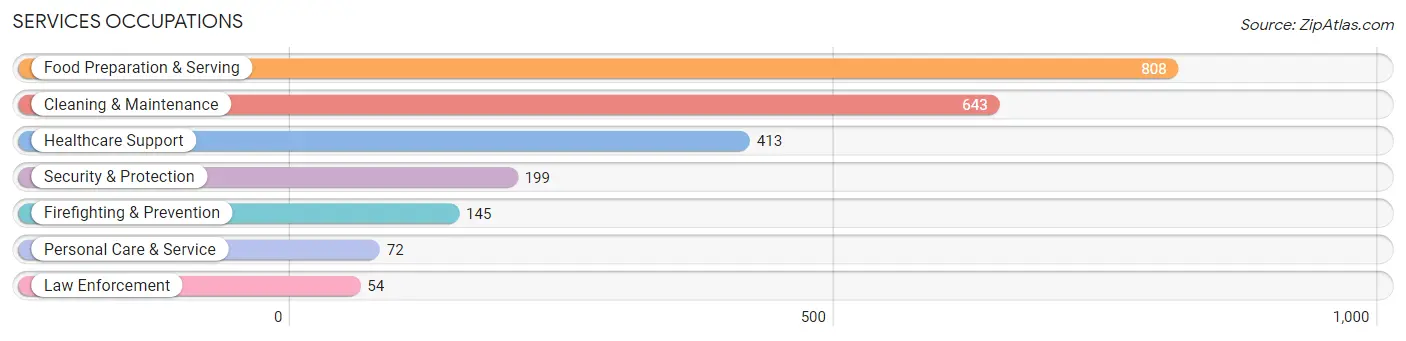
Services Occupations
The most common Services occupations in Selma are Food Preparation & Serving (808 | 7.8%), Cleaning & Maintenance (643 | 6.2%), Healthcare Support (413 | 4.0%), Security & Protection (199 | 1.9%), and Firefighting & Prevention (145 | 1.4%).
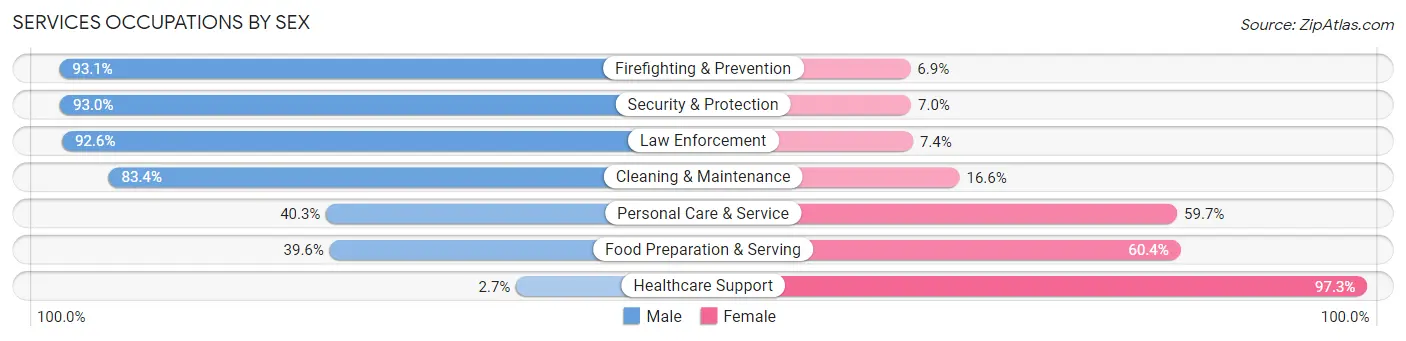
Services Occupations by Sex
Within the Services occupations in Selma, the most male-oriented occupations are Firefighting & Prevention (93.1%), Security & Protection (93.0%), and Law Enforcement (92.6%), while the most female-oriented occupations are Healthcare Support (97.3%), Food Preparation & Serving (60.4%), and Personal Care & Service (59.7%).
| Occupation | Male | Female |
| Healthcare Support | 11 (2.7%) | 402 (97.3%) |
| Security & Protection | 185 (93.0%) | 14 (7.0%) |
| Firefighting & Prevention | 135 (93.1%) | 10 (6.9%) |
| Law Enforcement | 50 (92.6%) | 4 (7.4%) |
| Food Preparation & Serving | 320 (39.6%) | 488 (60.4%) |
| Cleaning & Maintenance | 536 (83.4%) | 107 (16.6%) |
| Personal Care & Service | 29 (40.3%) | 43 (59.7%) |
| Total (Category) | 1,081 (50.6%) | 1,054 (49.4%) |
| Total (Overall) | 5,989 (57.9%) | 4,361 (42.1%) |
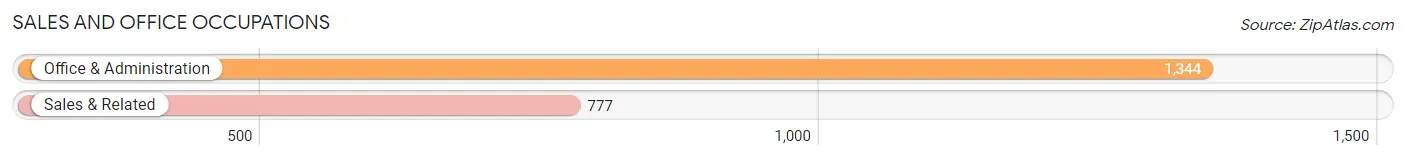
Sales and Office Occupations
The most common Sales and Office occupations in Selma are Office & Administration (1,344 | 13.0%), and Sales & Related (777 | 7.5%).
Sales and Office Occupations by Sex
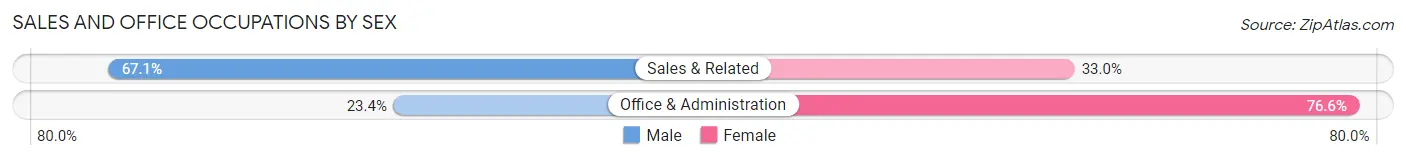
| Occupation | Male | Female |
| Sales & Related | 521 (67.0%) | 256 (33.0%) |
| Office & Administration | 314 (23.4%) | 1,030 (76.6%) |
| Total (Category) | 835 (39.4%) | 1,286 (60.6%) |
| Total (Overall) | 5,989 (57.9%) | 4,361 (42.1%) |
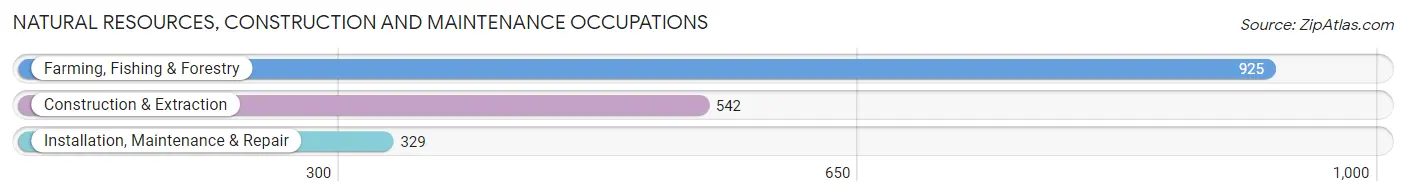
Natural Resources, Construction and Maintenance Occupations
The most common Natural Resources, Construction and Maintenance occupations in Selma are Farming, Fishing & Forestry (925 | 8.9%), Construction & Extraction (542 | 5.2%), and Installation, Maintenance & Repair (329 | 3.2%).
Natural Resources, Construction and Maintenance Occupations by Sex
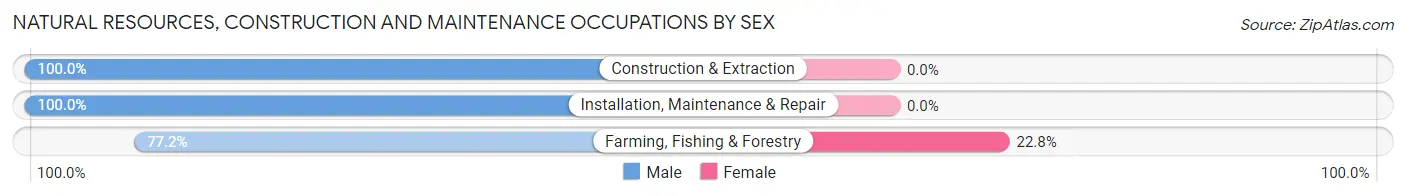
| Occupation | Male | Female |
| Farming, Fishing & Forestry | 714 (77.2%) | 211 (22.8%) |
| Construction & Extraction | 542 (100.0%) | 0 (0.0%) |
| Installation, Maintenance & Repair | 329 (100.0%) | 0 (0.0%) |
| Total (Category) | 1,585 (88.2%) | 211 (11.7%) |
| Total (Overall) | 5,989 (57.9%) | 4,361 (42.1%) |
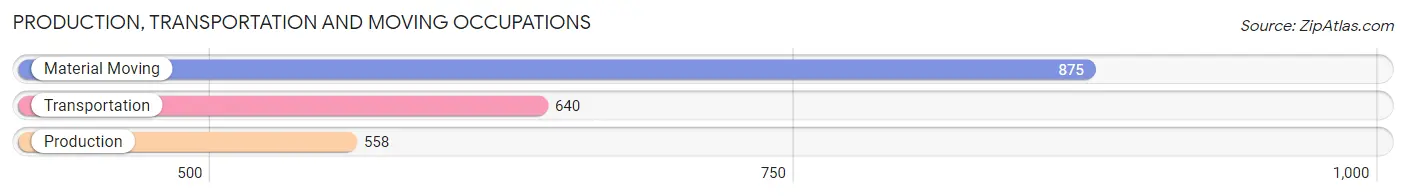
Production, Transportation and Moving Occupations
The most common Production, Transportation and Moving occupations in Selma are Material Moving (875 | 8.5%), Transportation (640 | 6.2%), and Production (558 | 5.4%).
Production, Transportation and Moving Occupations by Sex
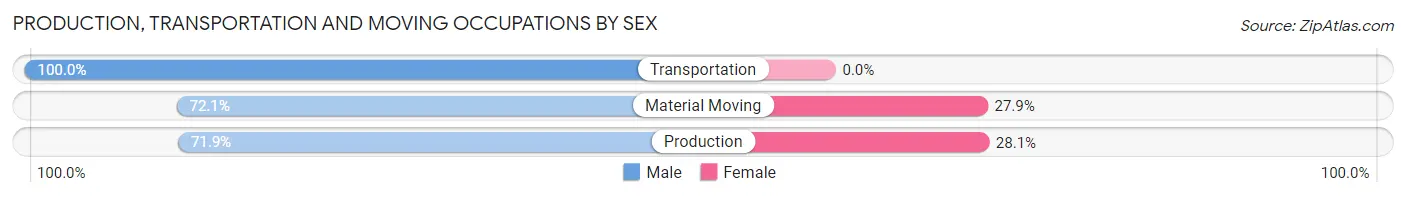
| Occupation | Male | Female |
| Production | 401 (71.9%) | 157 (28.1%) |
| Transportation | 640 (100.0%) | 0 (0.0%) |
| Material Moving | 631 (72.1%) | 244 (27.9%) |
| Total (Category) | 1,672 (80.7%) | 401 (19.3%) |
| Total (Overall) | 5,989 (57.9%) | 4,361 (42.1%) |
Employment Industries by Sex in Selma
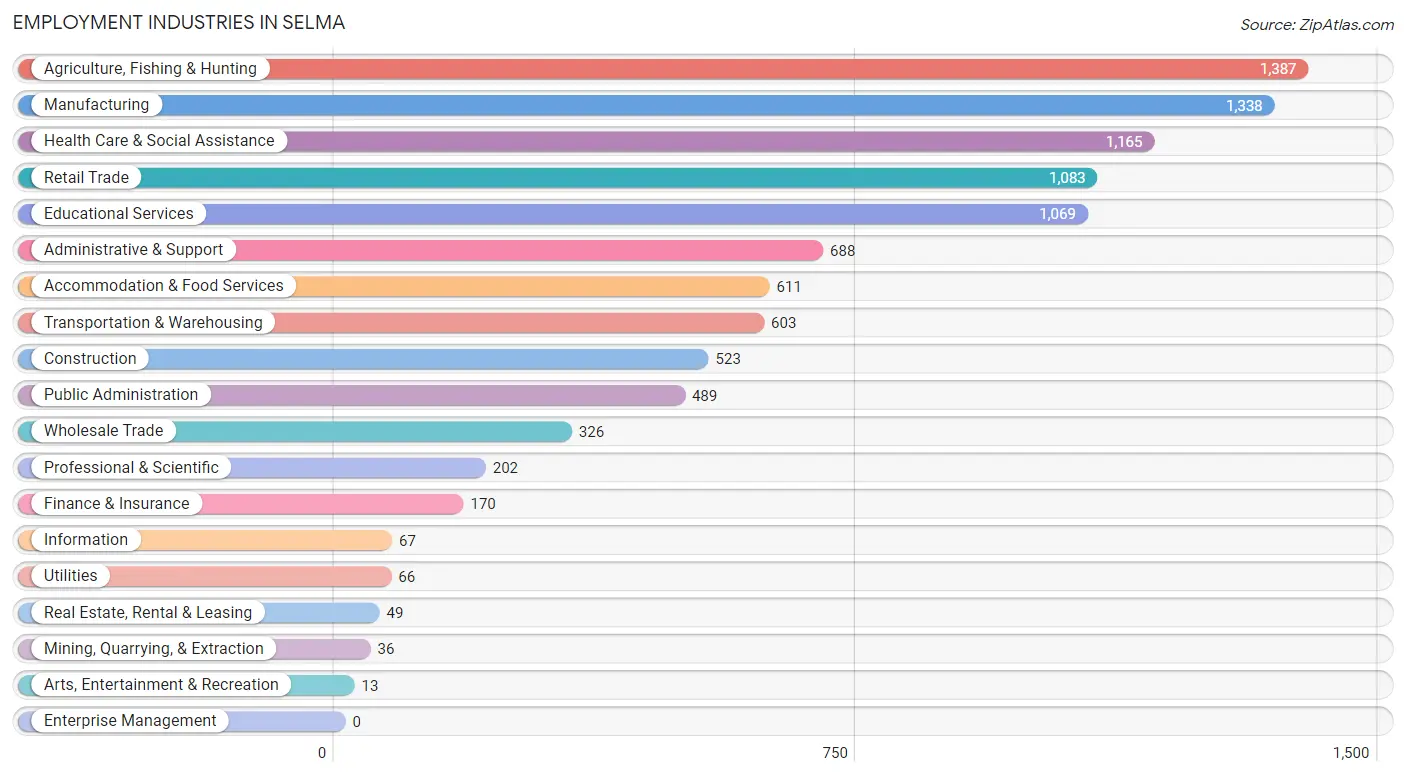
Employment Industries in Selma
The major employment industries in Selma include Agriculture, Fishing & Hunting (1,387 | 13.4%), Manufacturing (1,338 | 12.9%), Health Care & Social Assistance (1,165 | 11.3%), Retail Trade (1,083 | 10.5%), and Educational Services (1,069 | 10.3%).
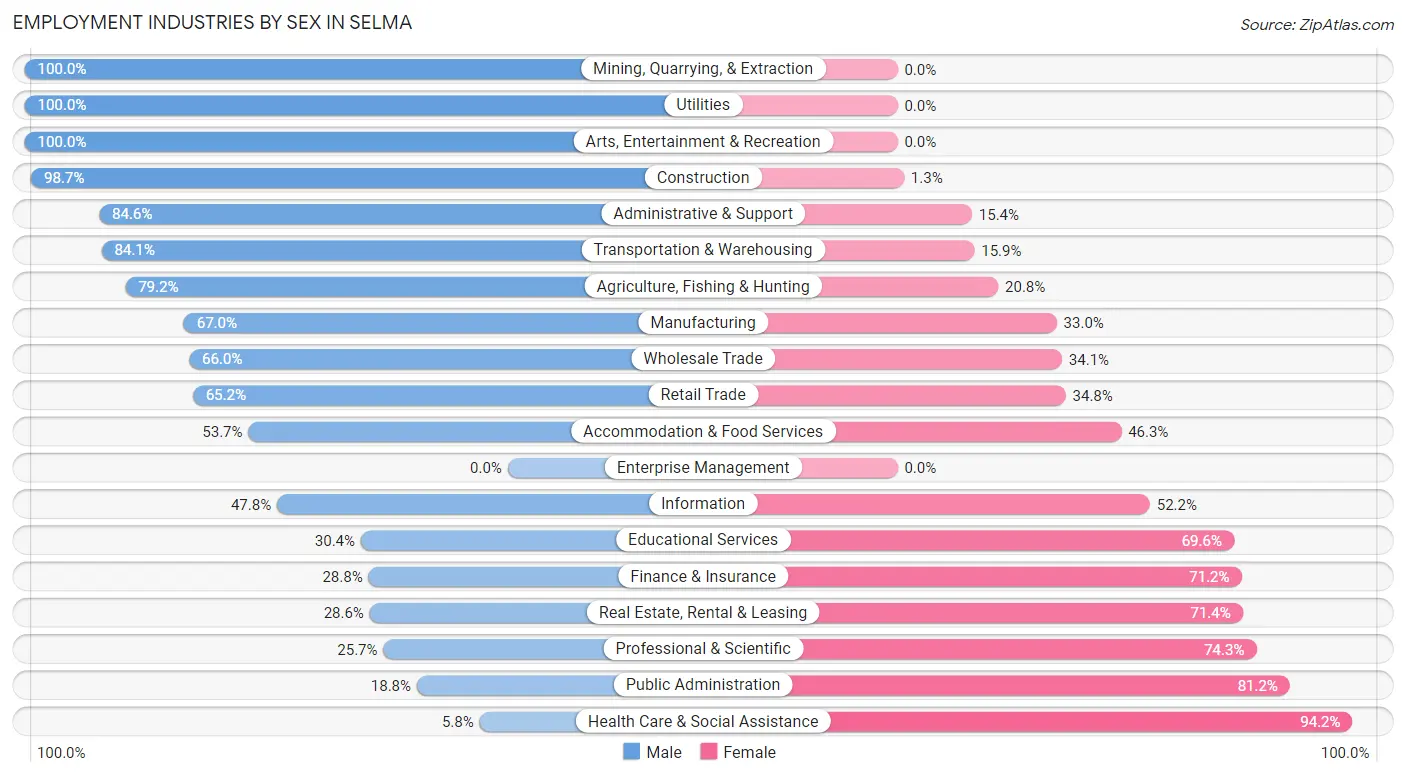
Employment Industries by Sex in Selma
The Selma industries that see more men than women are Mining, Quarrying, & Extraction (100.0%), Utilities (100.0%), and Arts, Entertainment & Recreation (100.0%), whereas the industries that tend to have a higher number of women are Health Care & Social Assistance (94.2%), Public Administration (81.2%), and Professional & Scientific (74.3%).
| Industry | Male | Female |
| Agriculture, Fishing & Hunting | 1,098 (79.2%) | 289 (20.8%) |
| Mining, Quarrying, & Extraction | 36 (100.0%) | 0 (0.0%) |
| Construction | 516 (98.7%) | 7 (1.3%) |
| Manufacturing | 897 (67.0%) | 441 (33.0%) |
| Wholesale Trade | 215 (65.9%) | 111 (34.1%) |
| Retail Trade | 706 (65.2%) | 377 (34.8%) |
| Transportation & Warehousing | 507 (84.1%) | 96 (15.9%) |
| Utilities | 66 (100.0%) | 0 (0.0%) |
| Information | 32 (47.8%) | 35 (52.2%) |
| Finance & Insurance | 49 (28.8%) | 121 (71.2%) |
| Real Estate, Rental & Leasing | 14 (28.6%) | 35 (71.4%) |
| Professional & Scientific | 52 (25.7%) | 150 (74.3%) |
| Enterprise Management | 0 (0.0%) | 0 (0.0%) |
| Administrative & Support | 582 (84.6%) | 106 (15.4%) |
| Educational Services | 325 (30.4%) | 744 (69.6%) |
| Health Care & Social Assistance | 68 (5.8%) | 1,097 (94.2%) |
| Arts, Entertainment & Recreation | 13 (100.0%) | 0 (0.0%) |
| Accommodation & Food Services | 328 (53.7%) | 283 (46.3%) |
| Public Administration | 92 (18.8%) | 397 (81.2%) |
| Total | 5,989 (57.9%) | 4,361 (42.1%) |
Education in Selma
School Enrollment in Selma
The most common levels of schooling among the 7,120 students in Selma are college / undergraduate (1,759 | 24.7%), middle school (1,607 | 22.6%), and elementary school (1,405 | 19.7%).
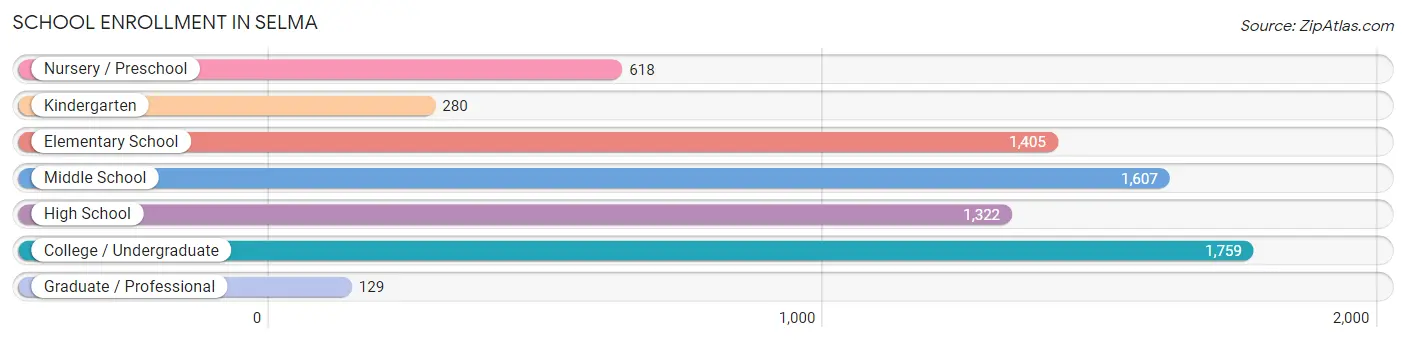
| School Level | # Students | % Students |
| Nursery / Preschool | 618 | 8.7% |
| Kindergarten | 280 | 3.9% |
| Elementary School | 1,405 | 19.7% |
| Middle School | 1,607 | 22.6% |
| High School | 1,322 | 18.6% |
| College / Undergraduate | 1,759 | 24.7% |
| Graduate / Professional | 129 | 1.8% |
| Total | 7,120 | 100.0% |
School Enrollment by Age by Funding Source in Selma
Out of a total of 7,120 students who are enrolled in schools in Selma, 548 (7.7%) attend a private institution, while the remaining 6,572 (92.3%) are enrolled in public schools. The age group of 25 to 34 year olds has the highest likelihood of being enrolled in private schools, with 343 (51.3% in the age bracket) enrolled. Conversely, the age group of 18 to 19 year olds has the lowest likelihood of being enrolled in a private school, with 487 (100.0% in the age bracket) attending a public institution.
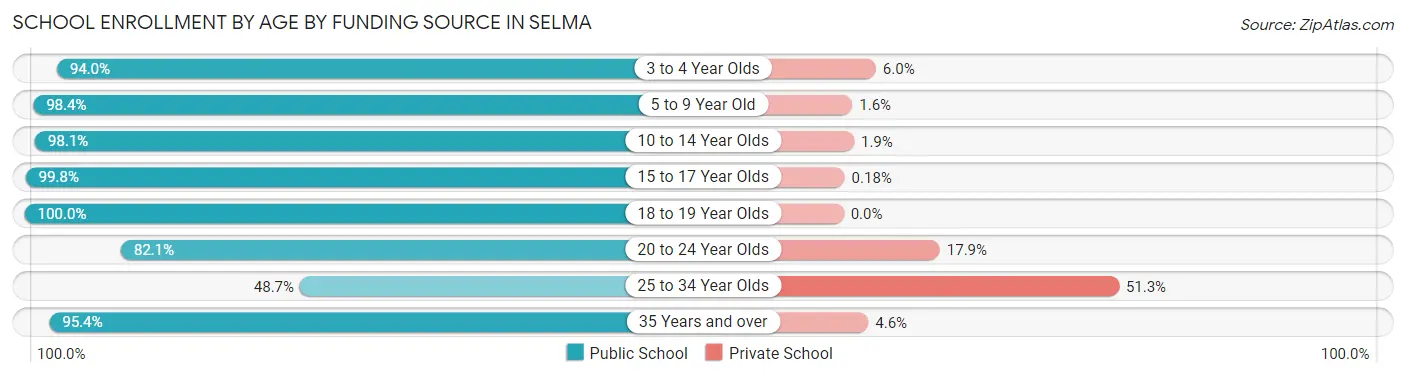
| Age Bracket | Public School | Private School |
| 3 to 4 Year Olds | 501 (94.0%) | 32 (6.0%) |
| 5 to 9 Year Old | 1,650 (98.4%) | 27 (1.6%) |
| 10 to 14 Year Olds | 1,778 (98.1%) | 35 (1.9%) |
| 15 to 17 Year Olds | 1,094 (99.8%) | 2 (0.2%) |
| 18 to 19 Year Olds | 487 (100.0%) | 0 (0.0%) |
| 20 to 24 Year Olds | 426 (82.1%) | 93 (17.9%) |
| 25 to 34 Year Olds | 326 (48.7%) | 343 (51.3%) |
| 35 Years and over | 311 (95.4%) | 15 (4.6%) |
| Total | 6,572 (92.3%) | 548 (7.7%) |
Educational Attainment by Field of Study in Selma
Education (316 | 17.8%), business (284 | 16.0%), liberal arts & history (276 | 15.5%), arts & humanities (194 | 10.9%), and bio, nature & agricultural (166 | 9.3%) are the most common fields of study among 1,778 individuals in Selma who have obtained a bachelor's degree or higher.
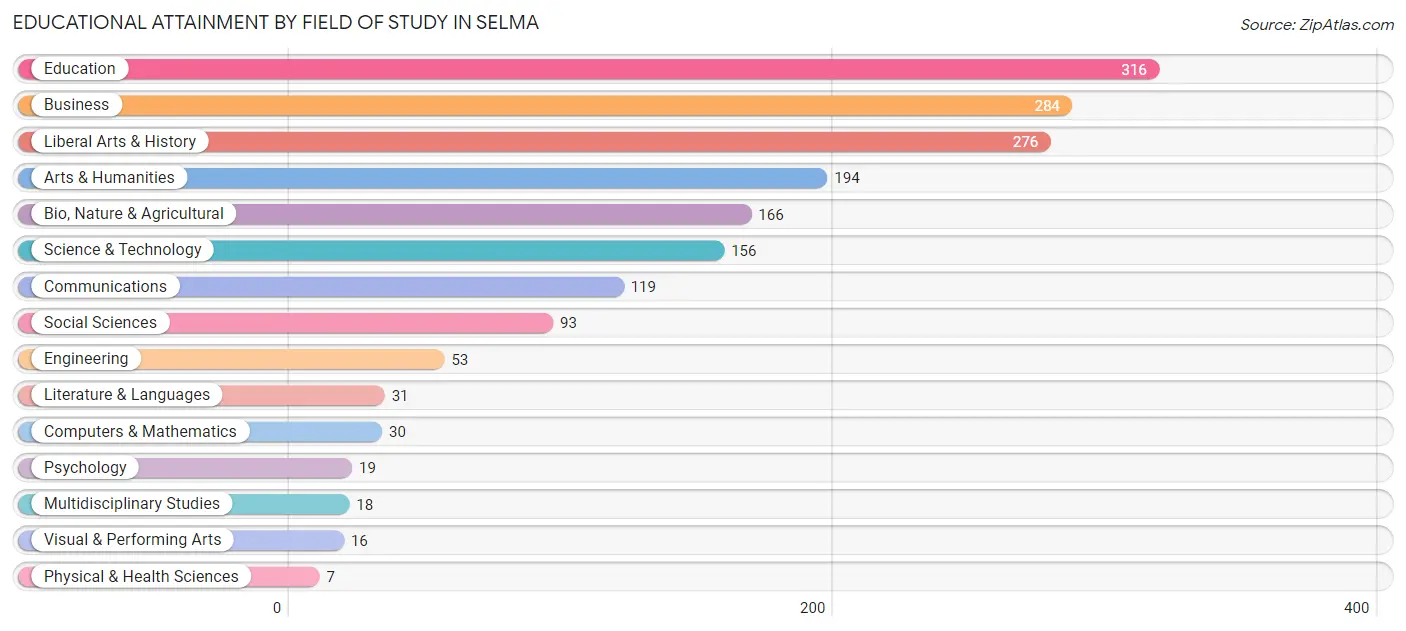
| Field of Study | # Graduates | % Graduates |
| Computers & Mathematics | 30 | 1.7% |
| Bio, Nature & Agricultural | 166 | 9.3% |
| Physical & Health Sciences | 7 | 0.4% |
| Psychology | 19 | 1.1% |
| Social Sciences | 93 | 5.2% |
| Engineering | 53 | 3.0% |
| Multidisciplinary Studies | 18 | 1.0% |
| Science & Technology | 156 | 8.8% |
| Business | 284 | 16.0% |
| Education | 316 | 17.8% |
| Literature & Languages | 31 | 1.7% |
| Liberal Arts & History | 276 | 15.5% |
| Visual & Performing Arts | 16 | 0.9% |
| Communications | 119 | 6.7% |
| Arts & Humanities | 194 | 10.9% |
| Total | 1,778 | 100.0% |
Transportation & Commute in Selma
Vehicle Availability by Sex in Selma
The most prevalent vehicle ownership categories in Selma are males with 2 vehicles (2,264, accounting for 38.2%) and females with 2 vehicles (1,424, making up 55.7%).
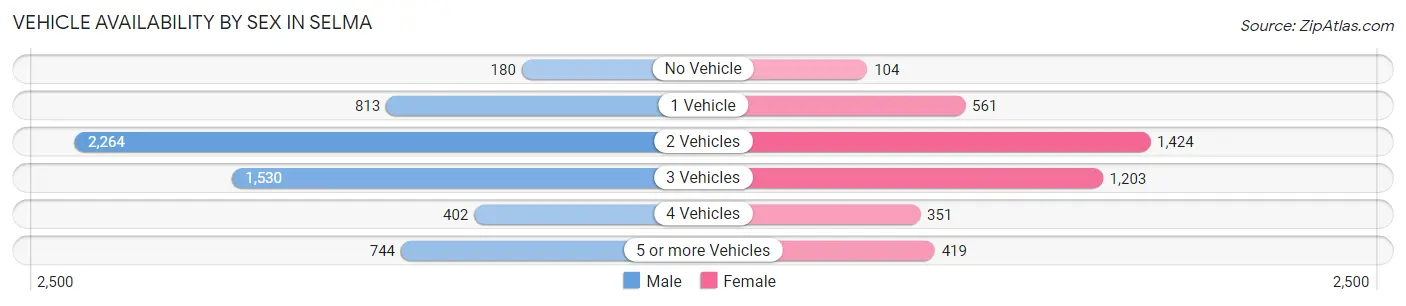
| Vehicles Available | Male | Female |
| No Vehicle | 180 (3.0%) | 104 (2.6%) |
| 1 Vehicle | 813 (13.7%) | 561 (13.8%) |
| 2 Vehicles | 2,264 (38.2%) | 1,424 (35.1%) |
| 3 Vehicles | 1,530 (25.8%) | 1,203 (29.6%) |
| 4 Vehicles | 402 (6.8%) | 351 (8.6%) |
| 5 or more Vehicles | 744 (12.5%) | 419 (10.3%) |
| Total | 5,933 (100.0%) | 4,062 (100.0%) |
Commute Time in Selma
The most frequently occuring commute durations in Selma are 30 to 34 minutes (1,786 commuters, 18.5%), 15 to 19 minutes (1,583 commuters, 16.4%), and 10 to 14 minutes (1,403 commuters, 14.6%).
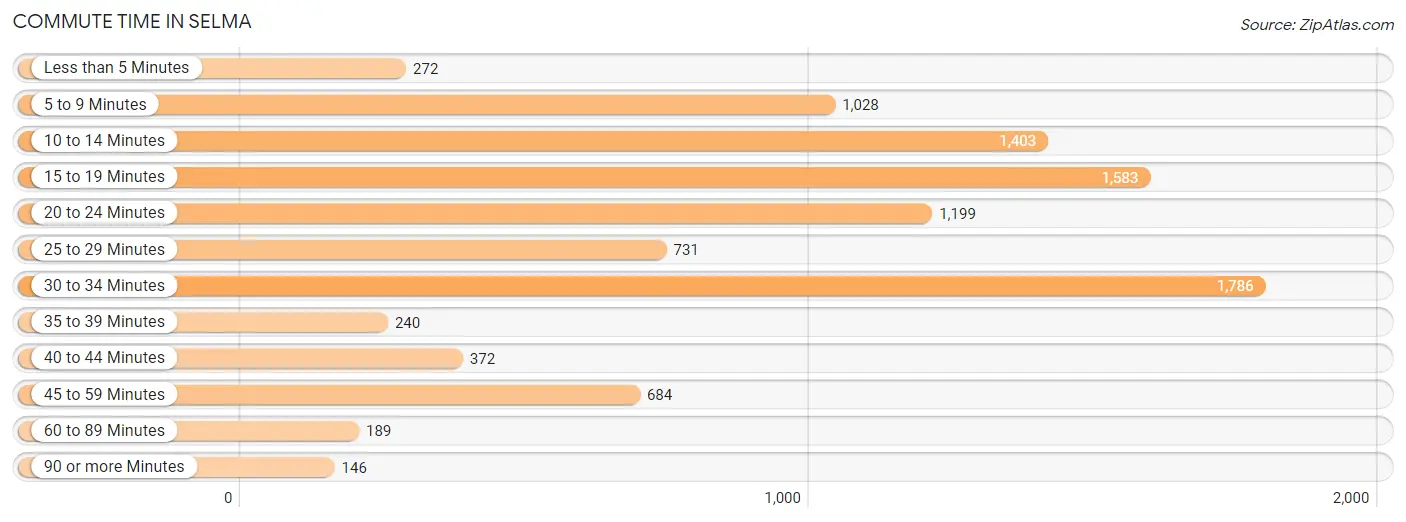
| Commute Time | # Commuters | % Commuters |
| Less than 5 Minutes | 272 | 2.8% |
| 5 to 9 Minutes | 1,028 | 10.7% |
| 10 to 14 Minutes | 1,403 | 14.6% |
| 15 to 19 Minutes | 1,583 | 16.4% |
| 20 to 24 Minutes | 1,199 | 12.4% |
| 25 to 29 Minutes | 731 | 7.6% |
| 30 to 34 Minutes | 1,786 | 18.5% |
| 35 to 39 Minutes | 240 | 2.5% |
| 40 to 44 Minutes | 372 | 3.9% |
| 45 to 59 Minutes | 684 | 7.1% |
| 60 to 89 Minutes | 189 | 2.0% |
| 90 or more Minutes | 146 | 1.5% |
Commute Time by Sex in Selma
The most common commute times in Selma are 30 to 34 minutes (1,353 commuters, 23.1%) for males and 5 to 9 minutes (655 commuters, 17.3%) for females.
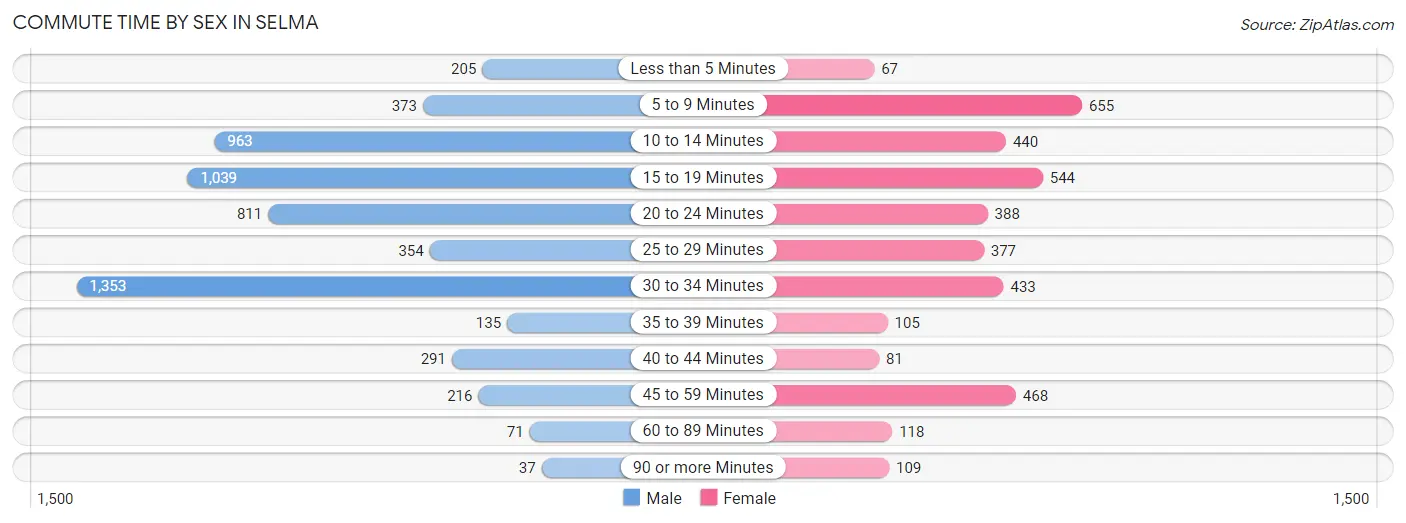
| Commute Time | Male | Female |
| Less than 5 Minutes | 205 (3.5%) | 67 (1.8%) |
| 5 to 9 Minutes | 373 (6.4%) | 655 (17.3%) |
| 10 to 14 Minutes | 963 (16.5%) | 440 (11.6%) |
| 15 to 19 Minutes | 1,039 (17.8%) | 544 (14.4%) |
| 20 to 24 Minutes | 811 (13.9%) | 388 (10.2%) |
| 25 to 29 Minutes | 354 (6.0%) | 377 (10.0%) |
| 30 to 34 Minutes | 1,353 (23.1%) | 433 (11.4%) |
| 35 to 39 Minutes | 135 (2.3%) | 105 (2.8%) |
| 40 to 44 Minutes | 291 (5.0%) | 81 (2.1%) |
| 45 to 59 Minutes | 216 (3.7%) | 468 (12.4%) |
| 60 to 89 Minutes | 71 (1.2%) | 118 (3.1%) |
| 90 or more Minutes | 37 (0.6%) | 109 (2.9%) |
Time of Departure to Work by Sex in Selma
The most frequent times of departure to work in Selma are 12:00 AM to 4:59 AM (1,170, 20.0%) for males and 8:00 AM to 8:29 AM (866, 22.9%) for females.
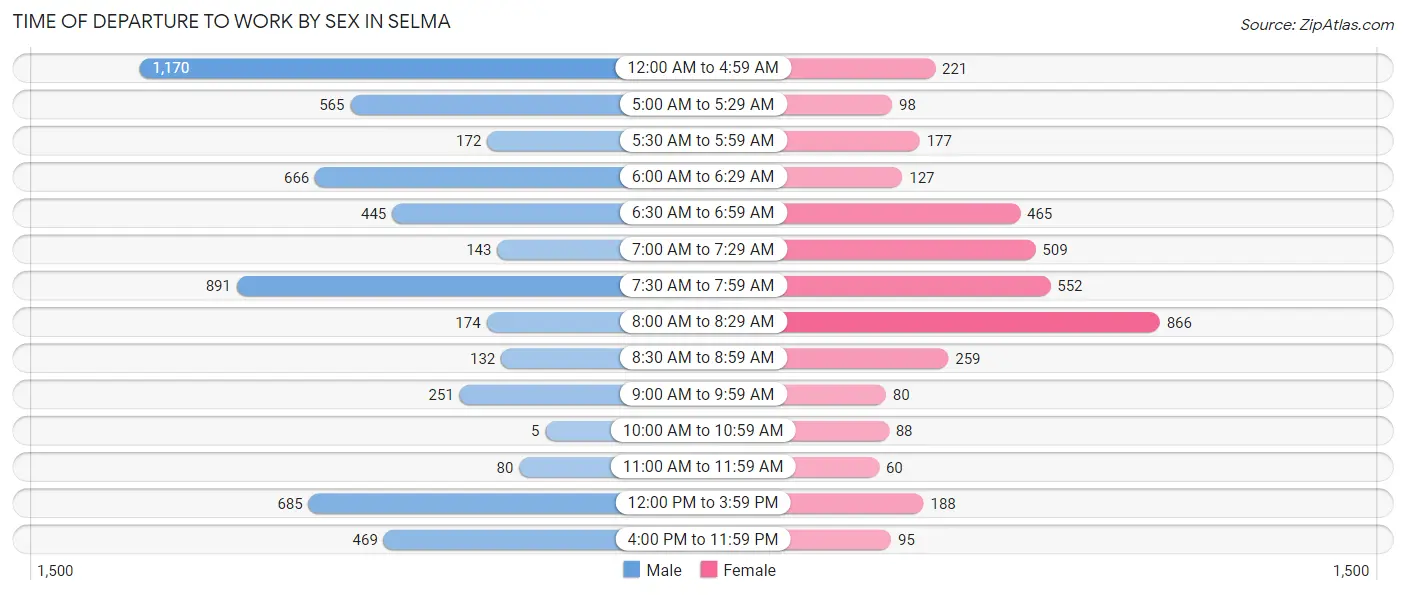
| Time of Departure | Male | Female |
| 12:00 AM to 4:59 AM | 1,170 (20.0%) | 221 (5.8%) |
| 5:00 AM to 5:29 AM | 565 (9.7%) | 98 (2.6%) |
| 5:30 AM to 5:59 AM | 172 (2.9%) | 177 (4.7%) |
| 6:00 AM to 6:29 AM | 666 (11.4%) | 127 (3.4%) |
| 6:30 AM to 6:59 AM | 445 (7.6%) | 465 (12.3%) |
| 7:00 AM to 7:29 AM | 143 (2.5%) | 509 (13.5%) |
| 7:30 AM to 7:59 AM | 891 (15.2%) | 552 (14.6%) |
| 8:00 AM to 8:29 AM | 174 (3.0%) | 866 (22.9%) |
| 8:30 AM to 8:59 AM | 132 (2.3%) | 259 (6.8%) |
| 9:00 AM to 9:59 AM | 251 (4.3%) | 80 (2.1%) |
| 10:00 AM to 10:59 AM | 5 (0.1%) | 88 (2.3%) |
| 11:00 AM to 11:59 AM | 80 (1.4%) | 60 (1.6%) |
| 12:00 PM to 3:59 PM | 685 (11.7%) | 188 (5.0%) |
| 4:00 PM to 11:59 PM | 469 (8.0%) | 95 (2.5%) |
| Total | 5,848 (100.0%) | 3,785 (100.0%) |
Housing Occupancy in Selma
Occupancy by Ownership in Selma
Of the total 7,272 dwellings in Selma, owner-occupied units account for 3,950 (54.3%), while renter-occupied units make up 3,322 (45.7%).
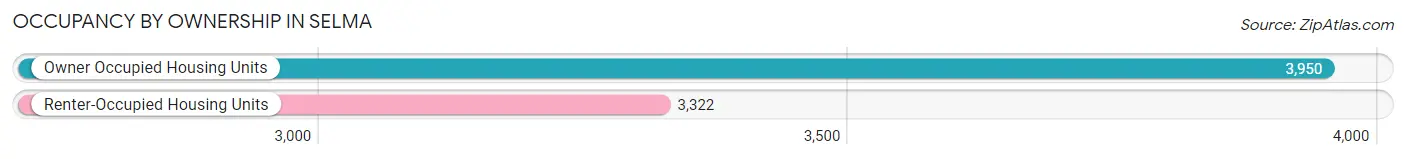
| Occupancy | # Housing Units | % Housing Units |
| Owner Occupied Housing Units | 3,950 | 54.3% |
| Renter-Occupied Housing Units | 3,322 | 45.7% |
| Total Occupied Housing Units | 7,272 | 100.0% |
Occupancy by Household Size in Selma
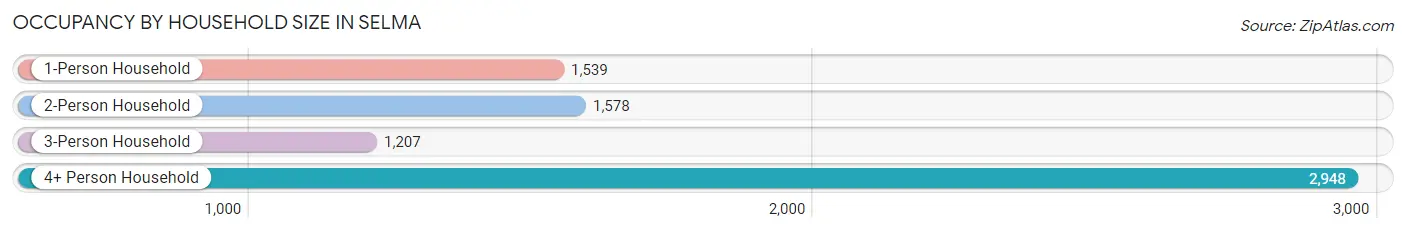
| Household Size | # Housing Units | % Housing Units |
| 1-Person Household | 1,539 | 21.2% |
| 2-Person Household | 1,578 | 21.7% |
| 3-Person Household | 1,207 | 16.6% |
| 4+ Person Household | 2,948 | 40.5% |
| Total Housing Units | 7,272 | 100.0% |
Occupancy by Ownership by Household Size in Selma
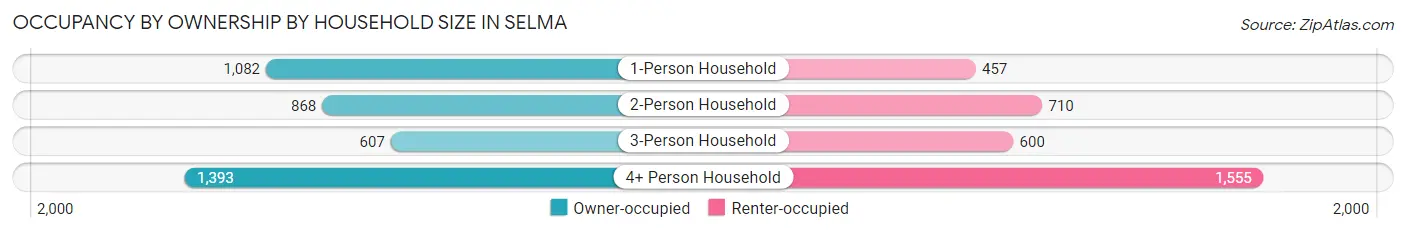
| Household Size | Owner-occupied | Renter-occupied |
| 1-Person Household | 1,082 (70.3%) | 457 (29.7%) |
| 2-Person Household | 868 (55.0%) | 710 (45.0%) |
| 3-Person Household | 607 (50.3%) | 600 (49.7%) |
| 4+ Person Household | 1,393 (47.2%) | 1,555 (52.7%) |
| Total Housing Units | 3,950 (54.3%) | 3,322 (45.7%) |
Occupancy by Educational Attainment in Selma
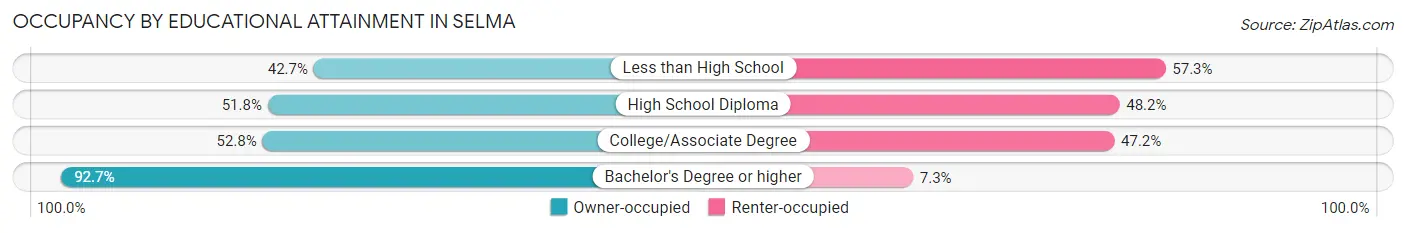
| Household Size | Owner-occupied | Renter-occupied |
| Less than High School | 787 (42.7%) | 1,058 (57.3%) |
| High School Diploma | 1,110 (51.8%) | 1,033 (48.2%) |
| College/Associate Degree | 1,313 (52.8%) | 1,173 (47.2%) |
| Bachelor's Degree or higher | 740 (92.7%) | 58 (7.3%) |
Occupancy by Age of Householder in Selma
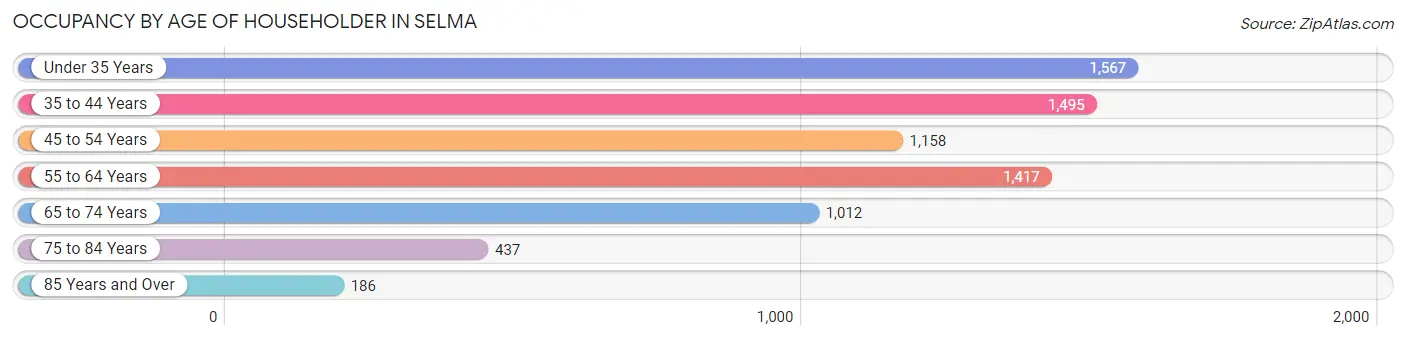
| Age Bracket | # Households | % Households |
| Under 35 Years | 1,567 | 21.5% |
| 35 to 44 Years | 1,495 | 20.6% |
| 45 to 54 Years | 1,158 | 15.9% |
| 55 to 64 Years | 1,417 | 19.5% |
| 65 to 74 Years | 1,012 | 13.9% |
| 75 to 84 Years | 437 | 6.0% |
| 85 Years and Over | 186 | 2.6% |
| Total | 7,272 | 100.0% |
Housing Finances in Selma
Median Income by Occupancy in Selma
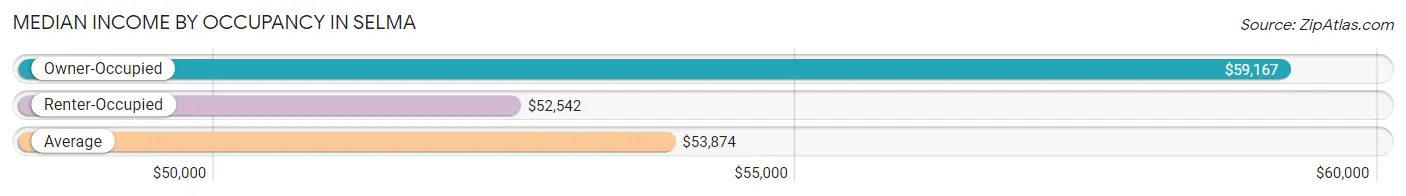
| Occupancy Type | # Households | Median Income |
| Owner-Occupied | 3,950 (54.3%) | $59,167 |
| Renter-Occupied | 3,322 (45.7%) | $52,542 |
| Average | 7,272 (100.0%) | $53,874 |
Occupancy by Householder Income Bracket in Selma
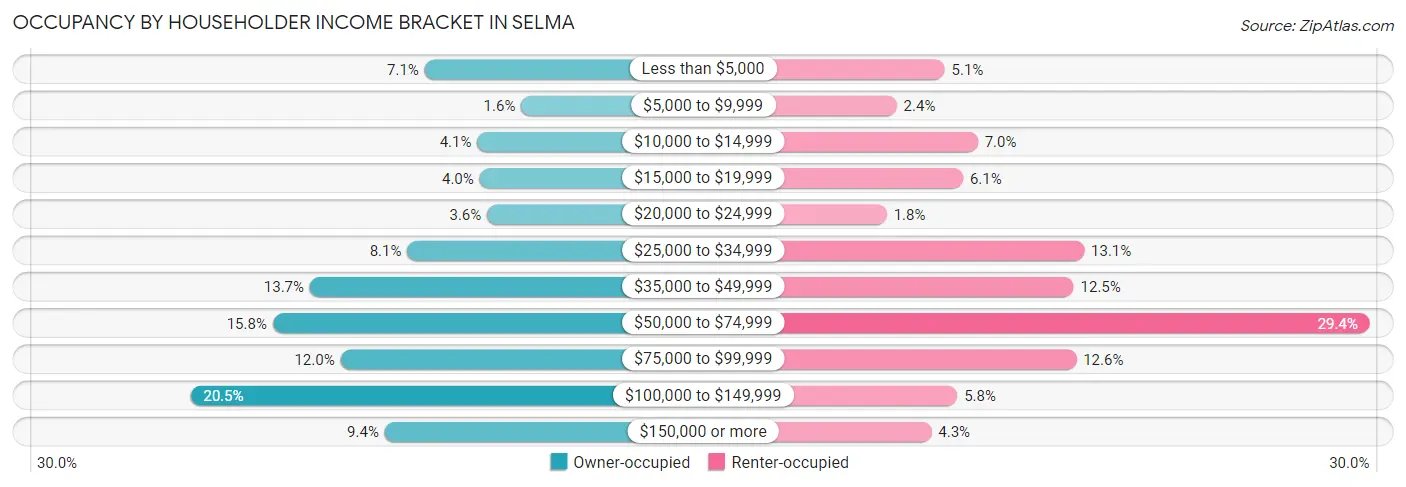
| Income Bracket | Owner-occupied | Renter-occupied |
| Less than $5,000 | 282 (7.1%) | 169 (5.1%) |
| $5,000 to $9,999 | 64 (1.6%) | 78 (2.4%) |
| $10,000 to $14,999 | 163 (4.1%) | 232 (7.0%) |
| $15,000 to $19,999 | 158 (4.0%) | 204 (6.1%) |
| $20,000 to $24,999 | 141 (3.6%) | 59 (1.8%) |
| $25,000 to $34,999 | 321 (8.1%) | 434 (13.1%) |
| $35,000 to $49,999 | 541 (13.7%) | 414 (12.5%) |
| $50,000 to $74,999 | 625 (15.8%) | 976 (29.4%) |
| $75,000 to $99,999 | 472 (11.9%) | 419 (12.6%) |
| $100,000 to $149,999 | 811 (20.5%) | 193 (5.8%) |
| $150,000 or more | 372 (9.4%) | 144 (4.3%) |
| Total | 3,950 (100.0%) | 3,322 (100.0%) |
Monthly Housing Cost Tiers in Selma
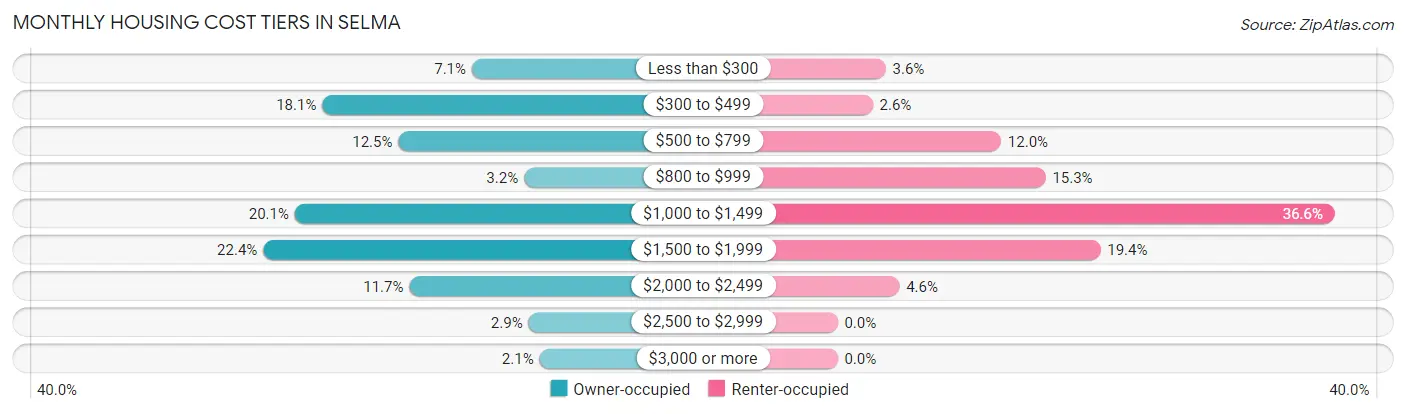
| Monthly Cost | Owner-occupied | Renter-occupied |
| Less than $300 | 279 (7.1%) | 118 (3.5%) |
| $300 to $499 | 714 (18.1%) | 86 (2.6%) |
| $500 to $799 | 493 (12.5%) | 400 (12.0%) |
| $800 to $999 | 127 (3.2%) | 509 (15.3%) |
| $1,000 to $1,499 | 794 (20.1%) | 1,217 (36.6%) |
| $1,500 to $1,999 | 886 (22.4%) | 643 (19.4%) |
| $2,000 to $2,499 | 461 (11.7%) | 151 (4.5%) |
| $2,500 to $2,999 | 114 (2.9%) | 0 (0.0%) |
| $3,000 or more | 82 (2.1%) | 0 (0.0%) |
| Total | 3,950 (100.0%) | 3,322 (100.0%) |
Physical Housing Characteristics in Selma
Housing Structures in Selma
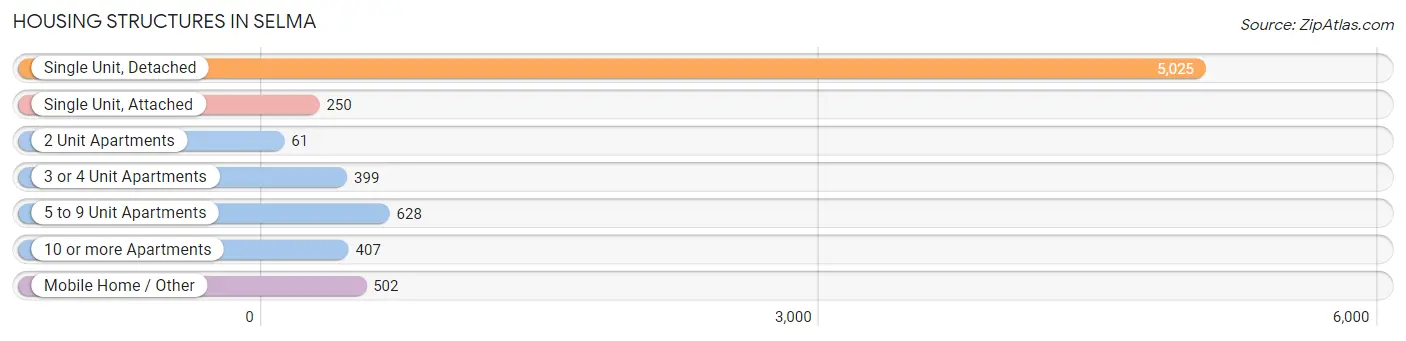
| Structure Type | # Housing Units | % Housing Units |
| Single Unit, Detached | 5,025 | 69.1% |
| Single Unit, Attached | 250 | 3.4% |
| 2 Unit Apartments | 61 | 0.8% |
| 3 or 4 Unit Apartments | 399 | 5.5% |
| 5 to 9 Unit Apartments | 628 | 8.6% |
| 10 or more Apartments | 407 | 5.6% |
| Mobile Home / Other | 502 | 6.9% |
| Total | 7,272 | 100.0% |
Housing Structures by Occupancy in Selma
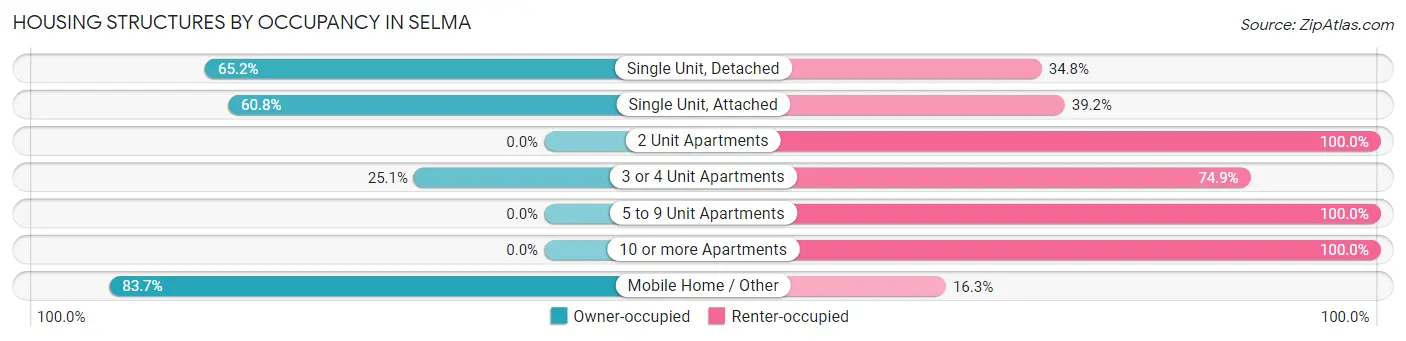
| Structure Type | Owner-occupied | Renter-occupied |
| Single Unit, Detached | 3,278 (65.2%) | 1,747 (34.8%) |
| Single Unit, Attached | 152 (60.8%) | 98 (39.2%) |
| 2 Unit Apartments | 0 (0.0%) | 61 (100.0%) |
| 3 or 4 Unit Apartments | 100 (25.1%) | 299 (74.9%) |
| 5 to 9 Unit Apartments | 0 (0.0%) | 628 (100.0%) |
| 10 or more Apartments | 0 (0.0%) | 407 (100.0%) |
| Mobile Home / Other | 420 (83.7%) | 82 (16.3%) |
| Total | 3,950 (54.3%) | 3,322 (45.7%) |
Housing Structures by Number of Rooms in Selma
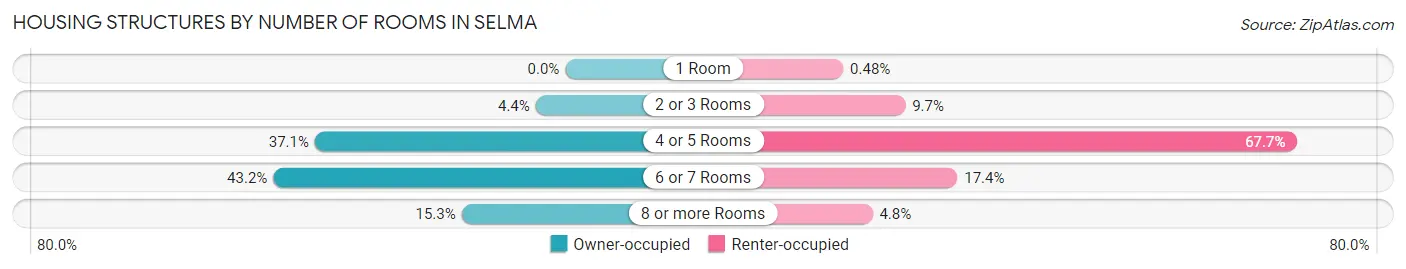
| Number of Rooms | Owner-occupied | Renter-occupied |
| 1 Room | 0 (0.0%) | 16 (0.5%) |
| 2 or 3 Rooms | 173 (4.4%) | 321 (9.7%) |
| 4 or 5 Rooms | 1,464 (37.1%) | 2,248 (67.7%) |
| 6 or 7 Rooms | 1,707 (43.2%) | 577 (17.4%) |
| 8 or more Rooms | 606 (15.3%) | 160 (4.8%) |
| Total | 3,950 (100.0%) | 3,322 (100.0%) |
Housing Structure by Heating Type in Selma
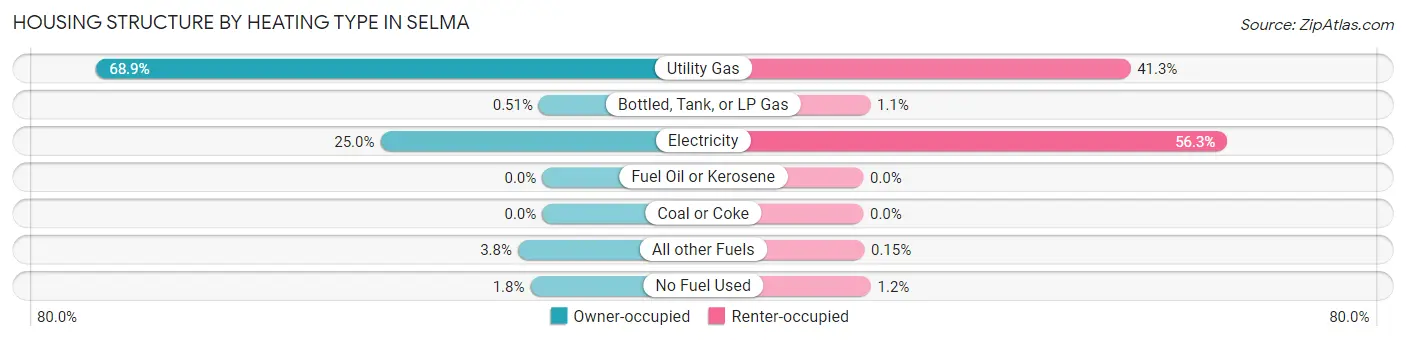
| Heating Type | Owner-occupied | Renter-occupied |
| Utility Gas | 2,722 (68.9%) | 1,372 (41.3%) |
| Bottled, Tank, or LP Gas | 20 (0.5%) | 36 (1.1%) |
| Electricity | 988 (25.0%) | 1,870 (56.3%) |
| Fuel Oil or Kerosene | 0 (0.0%) | 0 (0.0%) |
| Coal or Coke | 0 (0.0%) | 0 (0.0%) |
| All other Fuels | 148 (3.7%) | 5 (0.2%) |
| No Fuel Used | 72 (1.8%) | 39 (1.2%) |
| Total | 3,950 (100.0%) | 3,322 (100.0%) |
Household Vehicle Usage in Selma
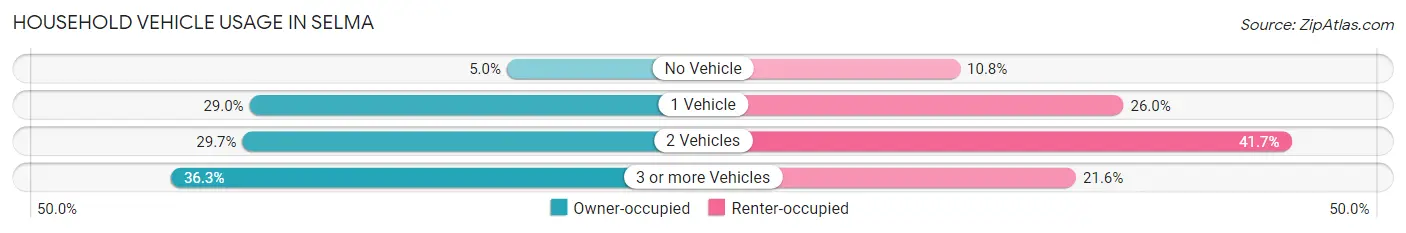
| Vehicles per Household | Owner-occupied | Renter-occupied |
| No Vehicle | 197 (5.0%) | 357 (10.7%) |
| 1 Vehicle | 1,146 (29.0%) | 864 (26.0%) |
| 2 Vehicles | 1,172 (29.7%) | 1,384 (41.7%) |
| 3 or more Vehicles | 1,435 (36.3%) | 717 (21.6%) |
| Total | 3,950 (100.0%) | 3,322 (100.0%) |
Real Estate & Mortgages in Selma
Real Estate and Mortgage Overview in Selma
| Characteristic | Without Mortgage | With Mortgage |
| Housing Units | 1,466 | 2,484 |
| Median Property Value | $164,000 | $277,900 |
| Median Household Income | $39,185 | $294 |
| Monthly Housing Costs | $389 | $82 |
| Real Estate Taxes | $1,573 | $72 |
Property Value by Mortgage Status in Selma
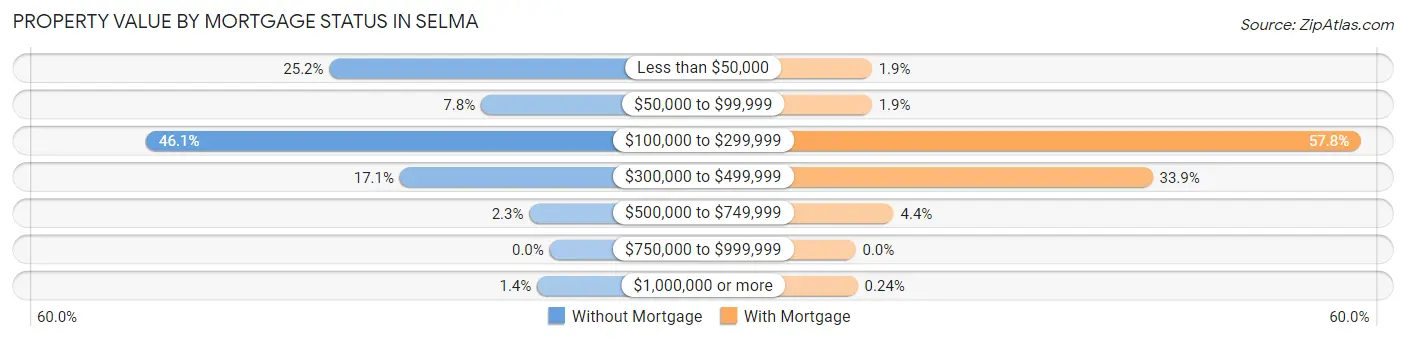
| Property Value | Without Mortgage | With Mortgage |
| Less than $50,000 | 369 (25.2%) | 46 (1.8%) |
| $50,000 to $99,999 | 115 (7.8%) | 46 (1.8%) |
| $100,000 to $299,999 | 676 (46.1%) | 1,435 (57.8%) |
| $300,000 to $499,999 | 251 (17.1%) | 843 (33.9%) |
| $500,000 to $749,999 | 34 (2.3%) | 108 (4.3%) |
| $750,000 to $999,999 | 0 (0.0%) | 0 (0.0%) |
| $1,000,000 or more | 21 (1.4%) | 6 (0.2%) |
| Total | 1,466 (100.0%) | 2,484 (100.0%) |
Household Income by Mortgage Status in Selma
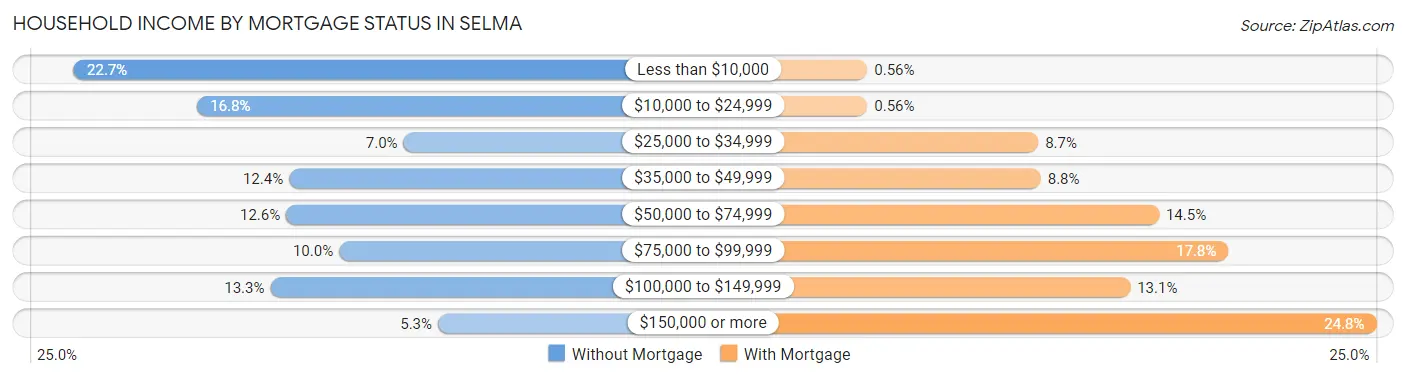
| Household Income | Without Mortgage | With Mortgage |
| Less than $10,000 | 332 (22.7%) | 14 (0.6%) |
| $10,000 to $24,999 | 246 (16.8%) | 14 (0.6%) |
| $25,000 to $34,999 | 102 (7.0%) | 216 (8.7%) |
| $35,000 to $49,999 | 182 (12.4%) | 219 (8.8%) |
| $50,000 to $74,999 | 184 (12.6%) | 359 (14.4%) |
| $75,000 to $99,999 | 147 (10.0%) | 441 (17.7%) |
| $100,000 to $149,999 | 195 (13.3%) | 325 (13.1%) |
| $150,000 or more | 78 (5.3%) | 616 (24.8%) |
| Total | 1,466 (100.0%) | 2,484 (100.0%) |
Property Value to Household Income Ratio in Selma
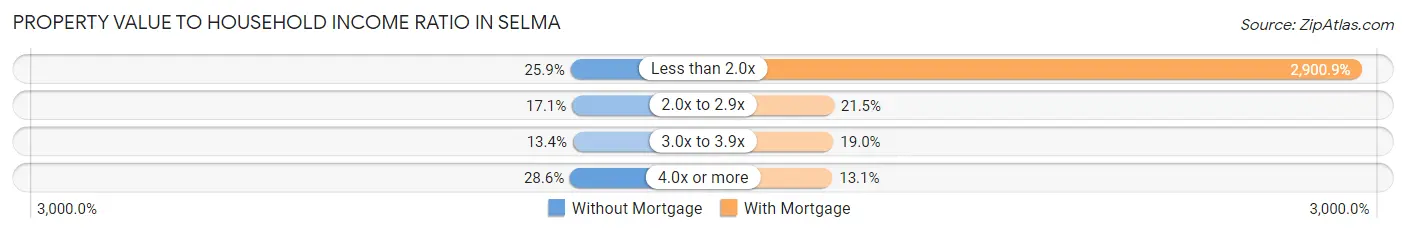
| Value-to-Income Ratio | Without Mortgage | With Mortgage |
| Less than 2.0x | 380 (25.9%) | 72,059 (2,900.9%) |
| 2.0x to 2.9x | 250 (17.1%) | 534 (21.5%) |
| 3.0x to 3.9x | 197 (13.4%) | 472 (19.0%) |
| 4.0x or more | 419 (28.6%) | 325 (13.1%) |
| Total | 1,466 (100.0%) | 2,484 (100.0%) |
Real Estate Taxes by Mortgage Status in Selma
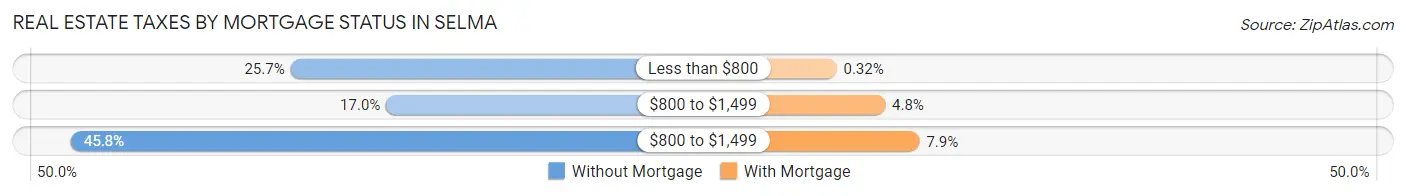
| Property Taxes | Without Mortgage | With Mortgage |
| Less than $800 | 377 (25.7%) | 8 (0.3%) |
| $800 to $1,499 | 249 (17.0%) | 118 (4.8%) |
| $800 to $1,499 | 671 (45.8%) | 196 (7.9%) |
| Total | 1,466 (100.0%) | 2,484 (100.0%) |
Health & Disability in Selma
Health Insurance Coverage by Age in Selma
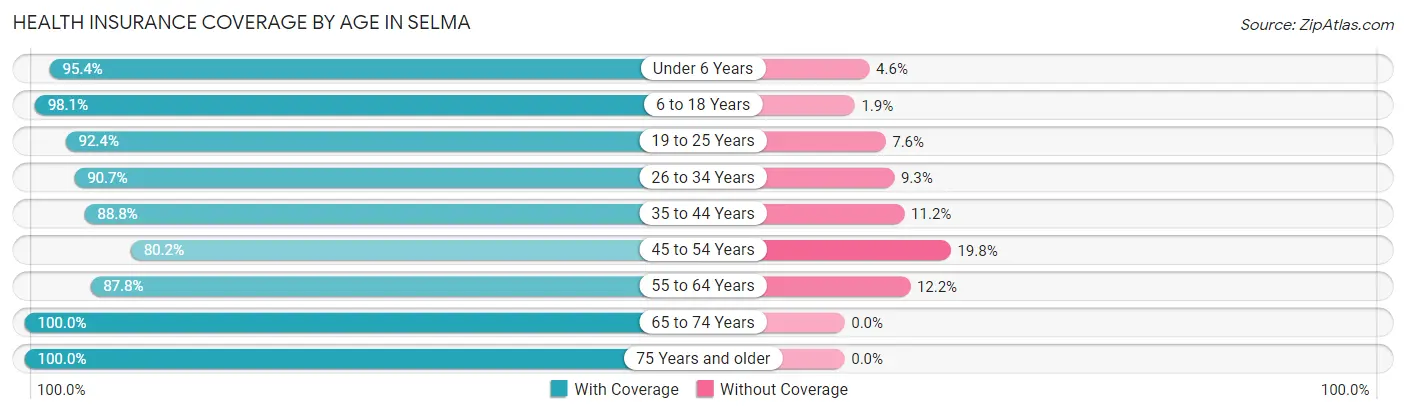
| Age Bracket | With Coverage | Without Coverage |
| Under 6 Years | 1,810 (95.4%) | 88 (4.6%) |
| 6 to 18 Years | 5,012 (98.1%) | 97 (1.9%) |
| 19 to 25 Years | 2,855 (92.4%) | 236 (7.6%) |
| 26 to 34 Years | 2,811 (90.7%) | 287 (9.3%) |
| 35 to 44 Years | 2,936 (88.8%) | 369 (11.2%) |
| 45 to 54 Years | 2,009 (80.2%) | 496 (19.8%) |
| 55 to 64 Years | 2,279 (87.8%) | 318 (12.2%) |
| 65 to 74 Years | 1,819 (100.0%) | 0 (0.0%) |
| 75 Years and older | 921 (100.0%) | 0 (0.0%) |
| Total | 22,452 (92.2%) | 1,891 (7.8%) |
Health Insurance Coverage by Citizenship Status in Selma
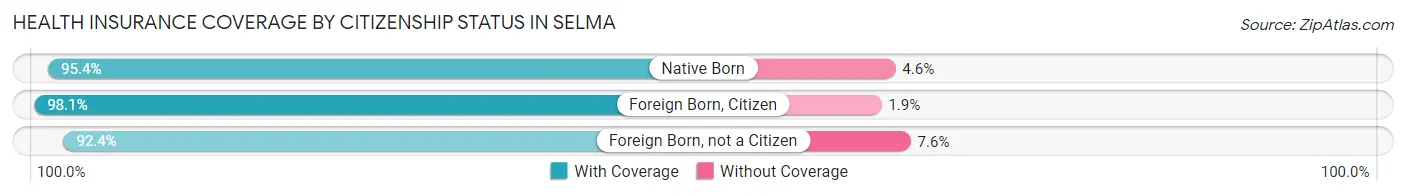
| Citizenship Status | With Coverage | Without Coverage |
| Native Born | 1,810 (95.4%) | 88 (4.6%) |
| Foreign Born, Citizen | 5,012 (98.1%) | 97 (1.9%) |
| Foreign Born, not a Citizen | 2,855 (92.4%) | 236 (7.6%) |
Health Insurance Coverage by Household Income in Selma
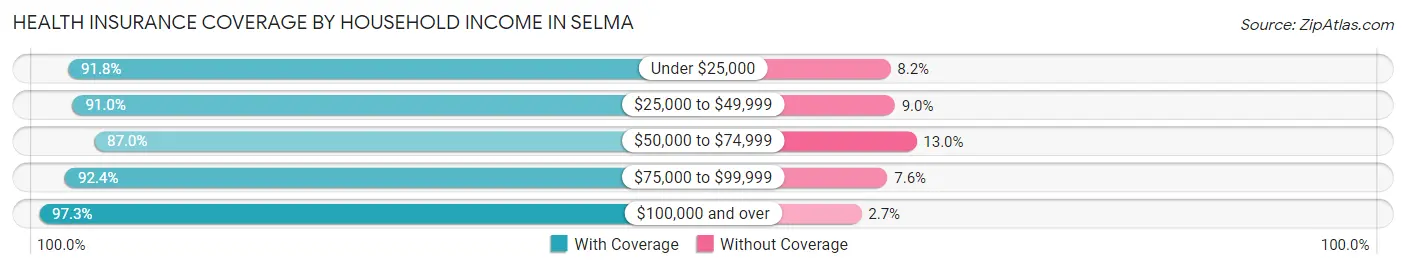
| Household Income | With Coverage | Without Coverage |
| Under $25,000 | 2,894 (91.8%) | 257 (8.2%) |
| $25,000 to $49,999 | 4,716 (91.0%) | 465 (9.0%) |
| $50,000 to $74,999 | 4,664 (87.0%) | 699 (13.0%) |
| $75,000 to $99,999 | 3,333 (92.4%) | 274 (7.6%) |
| $100,000 and over | 6,808 (97.3%) | 191 (2.7%) |
Public vs Private Health Insurance Coverage by Age in Selma
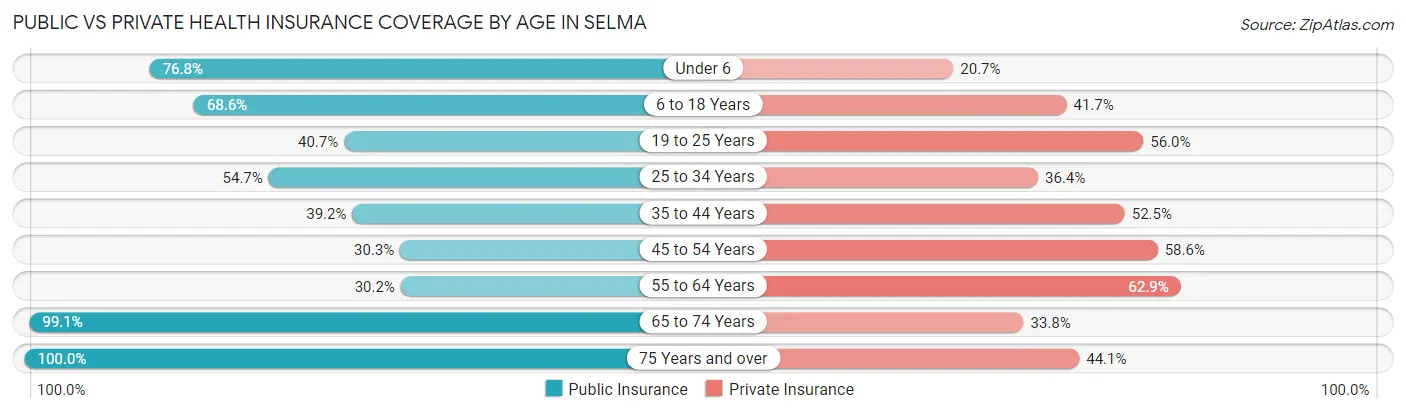
| Age Bracket | Public Insurance | Private Insurance |
| Under 6 | 1,457 (76.8%) | 393 (20.7%) |
| 6 to 18 Years | 3,503 (68.6%) | 2,131 (41.7%) |
| 19 to 25 Years | 1,258 (40.7%) | 1,730 (56.0%) |
| 25 to 34 Years | 1,695 (54.7%) | 1,129 (36.4%) |
| 35 to 44 Years | 1,295 (39.2%) | 1,736 (52.5%) |
| 45 to 54 Years | 759 (30.3%) | 1,469 (58.6%) |
| 55 to 64 Years | 784 (30.2%) | 1,633 (62.9%) |
| 65 to 74 Years | 1,803 (99.1%) | 614 (33.8%) |
| 75 Years and over | 921 (100.0%) | 406 (44.1%) |
| Total | 13,475 (55.3%) | 11,241 (46.2%) |
Disability Status by Sex by Age in Selma
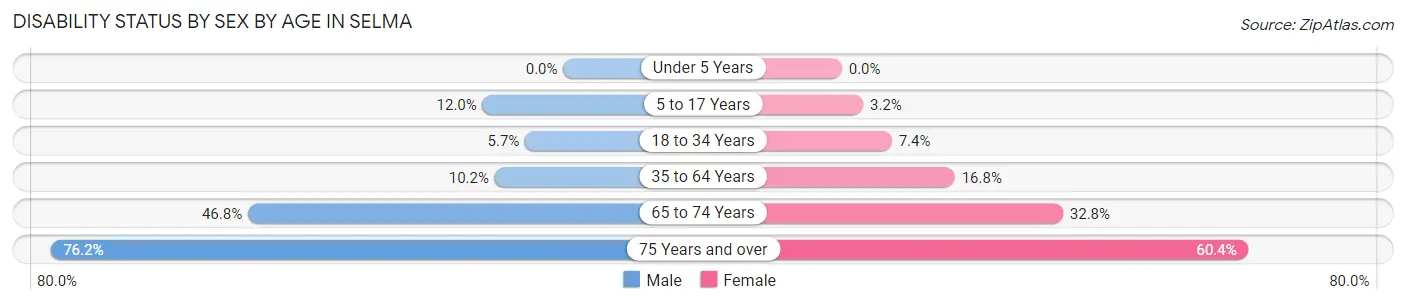
| Age Bracket | Male | Female |
| Under 5 Years | 0 (0.0%) | 0 (0.0%) |
| 5 to 17 Years | 284 (12.0%) | 81 (3.2%) |
| 18 to 34 Years | 224 (5.7%) | 197 (7.4%) |
| 35 to 64 Years | 439 (10.2%) | 687 (16.8%) |
| 65 to 74 Years | 354 (46.8%) | 349 (32.8%) |
| 75 Years and over | 240 (76.2%) | 366 (60.4%) |
Disability Class by Sex by Age in Selma
Disability Class: Hearing Difficulty
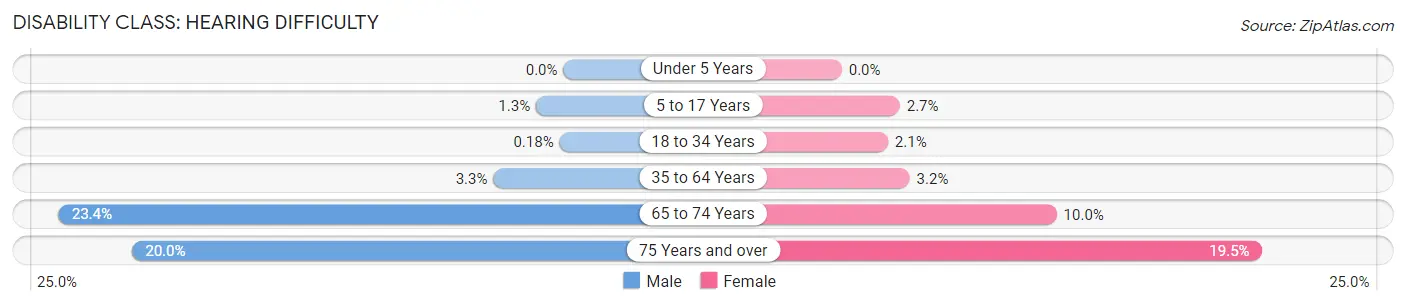
| Age Bracket | Male | Female |
| Under 5 Years | 0 (0.0%) | 0 (0.0%) |
| 5 to 17 Years | 30 (1.3%) | 69 (2.7%) |
| 18 to 34 Years | 7 (0.2%) | 57 (2.1%) |
| 35 to 64 Years | 140 (3.3%) | 129 (3.2%) |
| 65 to 74 Years | 177 (23.4%) | 106 (10.0%) |
| 75 Years and over | 63 (20.0%) | 118 (19.5%) |
Disability Class: Vision Difficulty
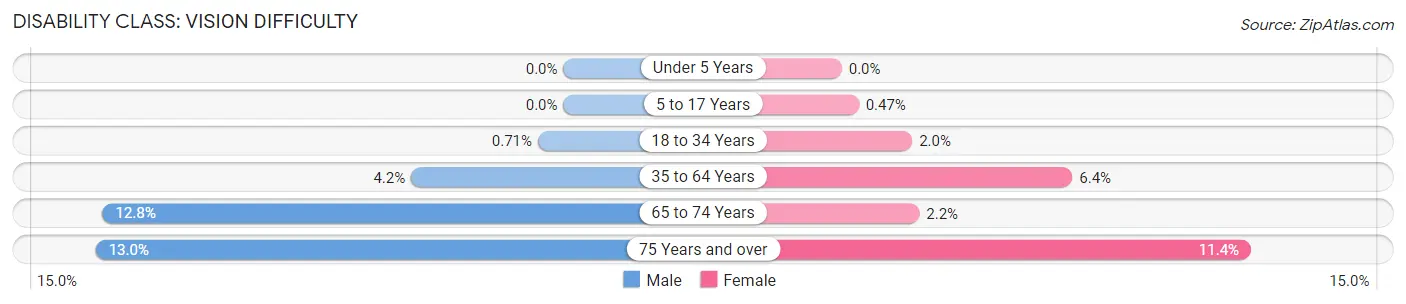
| Age Bracket | Male | Female |
| Under 5 Years | 0 (0.0%) | 0 (0.0%) |
| 5 to 17 Years | 0 (0.0%) | 12 (0.5%) |
| 18 to 34 Years | 28 (0.7%) | 52 (2.0%) |
| 35 to 64 Years | 183 (4.2%) | 263 (6.4%) |
| 65 to 74 Years | 97 (12.8%) | 23 (2.2%) |
| 75 Years and over | 41 (13.0%) | 69 (11.4%) |
Disability Class: Cognitive Difficulty
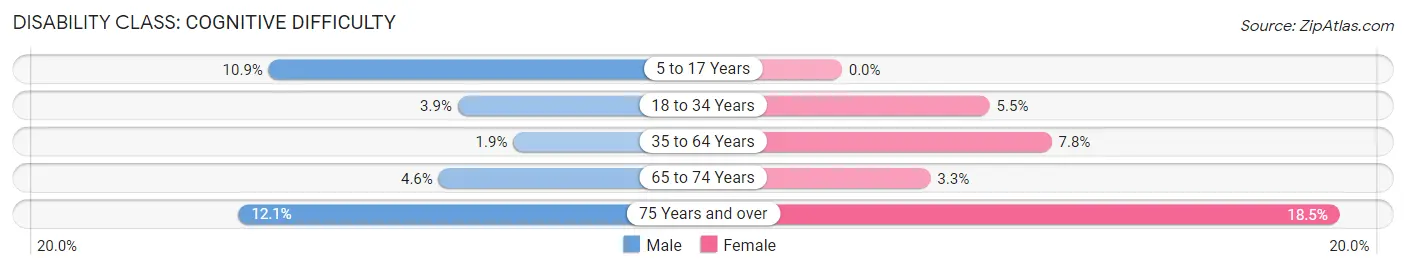
| Age Bracket | Male | Female |
| 5 to 17 Years | 259 (10.9%) | 0 (0.0%) |
| 18 to 34 Years | 155 (3.9%) | 146 (5.5%) |
| 35 to 64 Years | 80 (1.9%) | 319 (7.8%) |
| 65 to 74 Years | 35 (4.6%) | 35 (3.3%) |
| 75 Years and over | 38 (12.1%) | 112 (18.5%) |
Disability Class: Ambulatory Difficulty
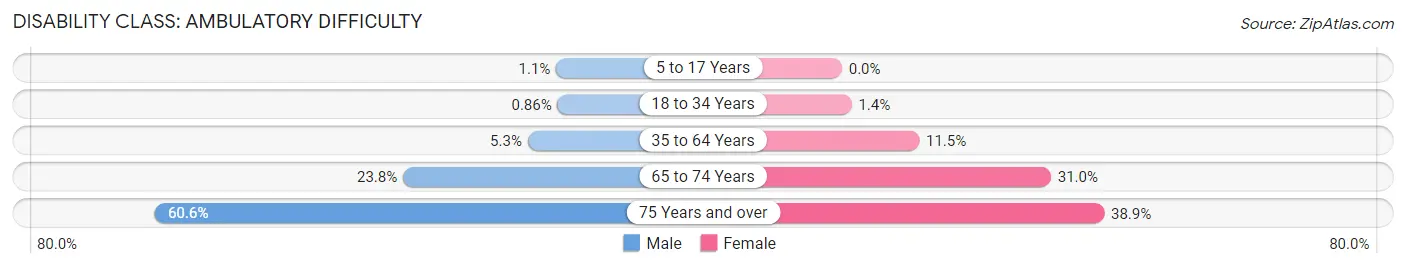
| Age Bracket | Male | Female |
| 5 to 17 Years | 25 (1.1%) | 0 (0.0%) |
| 18 to 34 Years | 34 (0.9%) | 38 (1.4%) |
| 35 to 64 Years | 228 (5.3%) | 470 (11.5%) |
| 65 to 74 Years | 180 (23.8%) | 330 (31.0%) |
| 75 Years and over | 191 (60.6%) | 236 (38.9%) |
Disability Class: Self-Care Difficulty
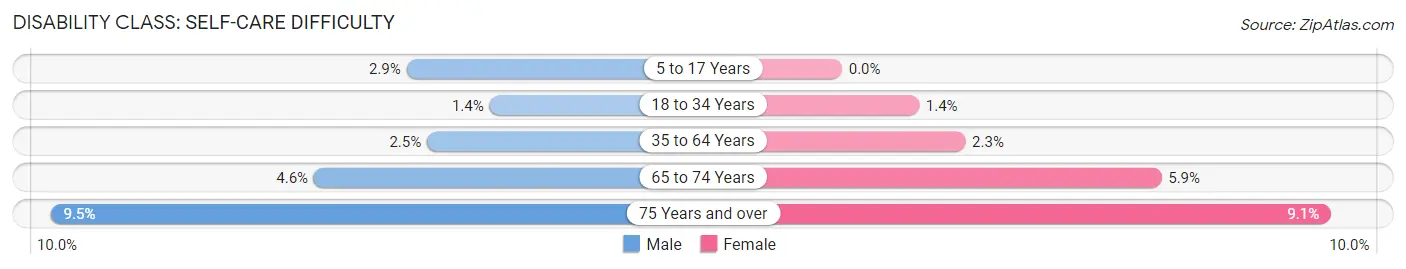
| Age Bracket | Male | Female |
| 5 to 17 Years | 69 (2.9%) | 0 (0.0%) |
| 18 to 34 Years | 54 (1.4%) | 38 (1.4%) |
| 35 to 64 Years | 109 (2.5%) | 94 (2.3%) |
| 65 to 74 Years | 35 (4.6%) | 63 (5.9%) |
| 75 Years and over | 30 (9.5%) | 55 (9.1%) |
Technology Access in Selma
Computing Device Access in Selma
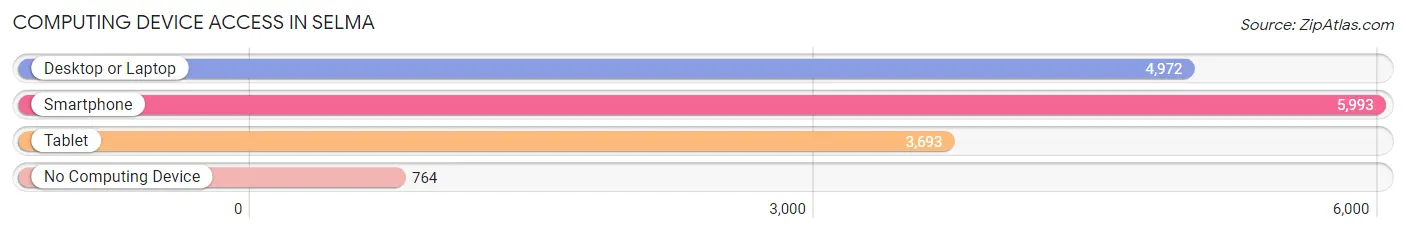
| Device Type | # Households | % Households |
| Desktop or Laptop | 4,972 | 68.4% |
| Smartphone | 5,993 | 82.4% |
| Tablet | 3,693 | 50.8% |
| No Computing Device | 764 | 10.5% |
| Total | 7,272 | 100.0% |
Internet Access in Selma
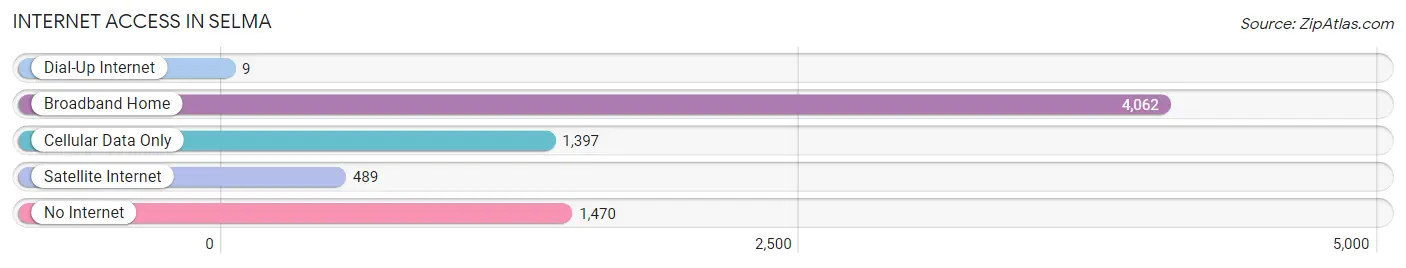
| Internet Type | # Households | % Households |
| Dial-Up Internet | 9 | 0.1% |
| Broadband Home | 4,062 | 55.9% |
| Cellular Data Only | 1,397 | 19.2% |
| Satellite Internet | 489 | 6.7% |
| No Internet | 1,470 | 20.2% |
| Total | 7,272 | 100.0% |
Selma Summary
Selma, California is a small city located in Fresno County, California. It is situated in the San Joaquin Valley, approximately 10 miles southeast of Fresno. The city has a population of approximately 24,000 people, making it the second-largest city in Fresno County.
History
The area that is now Selma was originally inhabited by the Yokuts people. The first European settlers arrived in the area in the late 1800s, and the city was officially incorporated in 1908. The city was named after Selma, Alabama, which was the site of a major civil rights march in 1965.
Geography
Selma is located in the San Joaquin Valley, approximately 10 miles southeast of Fresno. The city is situated at an elevation of approximately 300 feet above sea level. The city covers an area of approximately 5.5 square miles, and is bordered by the cities of Kingsburg, Fowler, and Parlier.
Climate
Selma has a Mediterranean climate, with hot, dry summers and mild, wet winters. The average high temperature in the summer is around 95°F, and the average low temperature in the winter is around 40°F. The city receives an average of 10 inches of precipitation per year.
Economy
Selma’s economy is largely based on agriculture. The city is home to a number of large agricultural companies, including Sun-Maid Raisins, Del Monte Foods, and Foster Farms. The city is also home to a number of manufacturing companies, including a Nestle plant and a Tyson Foods plant.
Demographics
As of the 2010 census, Selma had a population of 24,039 people. The racial makeup of the city was 57.2% White, 2.2% African American, 0.7% Native American, 1.2% Asian, 0.1% Pacific Islander, and 37.6% from other races. The median household income in the city was $37,945, and the median family income was $41,945.
Selma is a small city with a rich history and a diverse population. The city’s economy is largely based on agriculture, and the city is home to a number of large agricultural and manufacturing companies. The city has a Mediterranean climate, with hot, dry summers and mild, wet winters. Selma is a great place to live, work, and raise a family.
Common Questions
What is Per Capita Income in Selma?
Per Capita income in Selma is $21,714.
What is the Median Family Income in Selma?
Median Family Income in Selma is $58,562.
What is the Median Household income in Selma?
Median Household Income in Selma is $53,874.
What is Income or Wage Gap in Selma?
Income or Wage Gap in Selma is 14.9%.
Women in Selma earn 85.1 cents for every dollar earned by a man.
What is Family Income Deficit in Selma?
Family Income Deficit in Selma is $8,699.
Families that are below poverty line in Selma earn $8,699 less on average than the poverty threshold level.
What is Inequality or Gini Index in Selma?
Inequality or Gini Index in Selma is 0.46.
What is the Total Population of Selma?
Total Population of Selma is 24,576.
What is the Total Male Population of Selma?
Total Male Population of Selma is 12,649.
What is the Total Female Population of Selma?
Total Female Population of Selma is 11,927.
What is the Ratio of Males per 100 Females in Selma?
There are 106.05 Males per 100 Females in Selma.
What is the Ratio of Females per 100 Males in Selma?
There are 94.29 Females per 100 Males in Selma.
What is the Median Population Age in Selma?
Median Population Age in Selma is 31.3 Years.
What is the Average Family Size in Selma
Average Family Size in Selma is 3.8 People.
What is the Average Household Size in Selma
Average Household Size in Selma is 3.4 People.
How Large is the Labor Force in Selma?
There are 11,665 People in the Labor Forcein in Selma.
What is the Percentage of People in the Labor Force in Selma?
61.6% of People are in the Labor Force in Selma.
What is the Unemployment Rate in Selma?
Unemployment Rate in Selma is 10.3%.