Cities with the Fewest Births per 1,000 Women Over the Age of 35 in Michigan
RELATED REPORTS & OPTIONS
Lowest Birth Rate | Women 35+
Michigan
Compare Cities
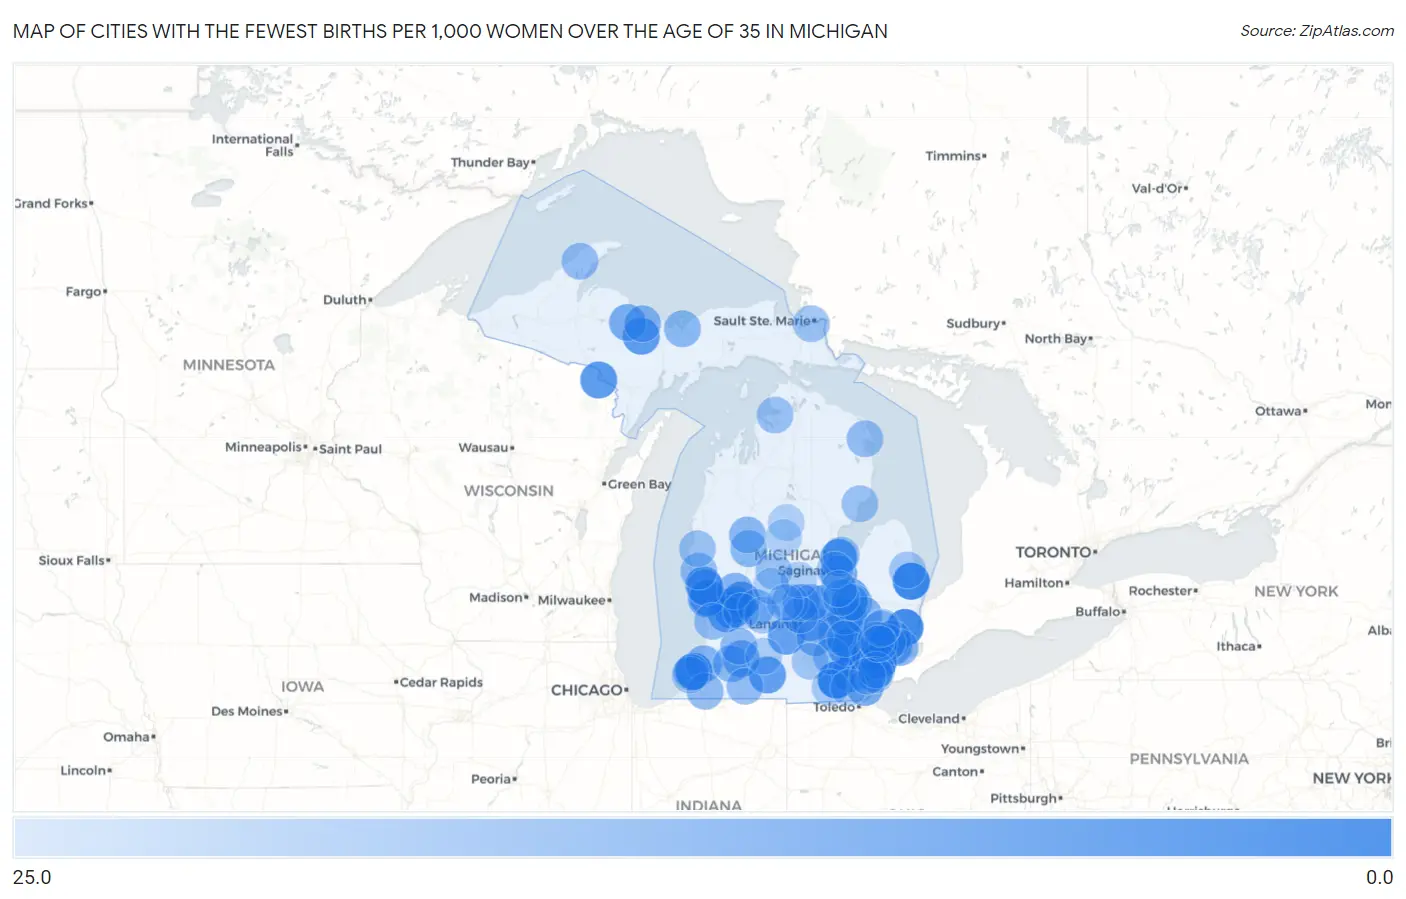
Map of Cities with the Fewest Births per 1,000 Women Over the Age of 35 in Michigan
25.0
0.0
Cities with the Fewest Births per 1,000 Women Over the Age of 35 in Michigan
| City | Births / 1,000 Women | vs State | vs National | |
| 1. | Tecumseh | 2.0 | 28.0(-26.0)#1 | 32.0(-30.0)#22 |
| 2. | Southgate | 3.0 | 28.0(-25.0)#2 | 32.0(-29.0)#35 |
| 3. | Romulus | 3.0 | 28.0(-25.0)#3 | 32.0(-29.0)#38 |
| 4. | Hazel Park | 3.0 | 28.0(-25.0)#4 | 32.0(-29.0)#47 |
| 5. | Croswell | 3.0 | 28.0(-25.0)#5 | 32.0(-29.0)#77 |
| 6. | New Baltimore | 4.0 | 28.0(-24.0)#6 | 32.0(-28.0)#103 |
| 7. | Benton Harbor | 4.0 | 28.0(-24.0)#7 | 32.0(-28.0)#107 |
| 8. | Inkster | 7.0 | 28.0(-21.0)#8 | 32.0(-25.0)#253 |
| 9. | Grandville | 7.0 | 28.0(-21.0)#9 | 32.0(-25.0)#268 |
| 10. | South Lyon | 7.0 | 28.0(-21.0)#10 | 32.0(-25.0)#283 |
| 11. | Bay City | 8.0 | 28.0(-20.0)#11 | 32.0(-24.0)#342 |
| 12. | Wayne | 8.0 | 28.0(-20.0)#12 | 32.0(-24.0)#366 |
| 13. | Kingsford | 8.0 | 28.0(-20.0)#13 | 32.0(-24.0)#404 |
| 14. | Muskegon | 9.0 | 28.0(-19.0)#14 | 32.0(-23.0)#428 |
| 15. | Walker | 9.0 | 28.0(-19.0)#15 | 32.0(-23.0)#436 |
| 16. | K I Sawyer | 9.0 | 28.0(-19.0)#16 | 32.0(-23.0)#509 |
| 17. | Northview | 10.0 | 28.0(-18.0)#17 | 32.0(-22.0)#562 |
| 18. | Fenton | 10.0 | 28.0(-18.0)#18 | 32.0(-22.0)#576 |
| 19. | Grand Haven | 10.0 | 28.0(-18.0)#19 | 32.0(-22.0)#585 |
| 20. | Charlotte | 10.0 | 28.0(-18.0)#20 | 32.0(-22.0)#598 |
| 21. | Union City | 10.0 | 28.0(-18.0)#21 | 32.0(-22.0)#644 |
| 22. | Flat Rock | 11.0 | 28.0(-17.0)#22 | 32.0(-21.0)#711 |
| 23. | Milan | 11.0 | 28.0(-17.0)#23 | 32.0(-21.0)#744 |
| 24. | Harper Woods | 12.0 | 28.0(-16.0)#24 | 32.0(-20.0)#843 |
| 25. | Whitmore Lake | 12.0 | 28.0(-16.0)#25 | 32.0(-20.0)#867 |
| 26. | Hudsonville | 12.0 | 28.0(-16.0)#26 | 32.0(-20.0)#869 |
| 27. | Taylor | 13.0 | 28.0(-15.0)#27 | 32.0(-19.0)#919 |
| 28. | Haslett | 13.0 | 28.0(-15.0)#28 | 32.0(-19.0)#948 |
| 29. | Owosso | 13.0 | 28.0(-15.0)#29 | 32.0(-19.0)#961 |
| 30. | Beecher | 13.0 | 28.0(-15.0)#30 | 32.0(-19.0)#988 |
| 31. | Kalamazoo | 14.0 | 28.0(-14.0)#31 | 32.0(-18.0)#1,046 |
| 32. | Fraser | 14.0 | 28.0(-14.0)#32 | 32.0(-18.0)#1,091 |
| 33. | St Johns | 14.0 | 28.0(-14.0)#33 | 32.0(-18.0)#1,120 |
| 34. | South Monroe | 14.0 | 28.0(-14.0)#34 | 32.0(-18.0)#1,128 |
| 35. | Bridgeport | 14.0 | 28.0(-14.0)#35 | 32.0(-18.0)#1,131 |
| 36. | Negaunee | 14.0 | 28.0(-14.0)#36 | 32.0(-18.0)#1,138 |
| 37. | Howell | 15.0 | 28.0(-13.0)#37 | 32.0(-17.0)#1,237 |
| 38. | Linden | 15.0 | 28.0(-13.0)#38 | 32.0(-17.0)#1,272 |
| 39. | Spring Lake | 15.0 | 28.0(-13.0)#39 | 32.0(-17.0)#1,282 |
| 40. | Dansville | 15.0 | 28.0(-13.0)#40 | 32.0(-17.0)#1,307 |
| 41. | Burton | 16.0 | 28.0(-12.0)#41 | 32.0(-16.0)#1,332 |
| 42. | Madison Heights | 16.0 | 28.0(-12.0)#42 | 32.0(-16.0)#1,333 |
| 43. | Sparta | 16.0 | 28.0(-12.0)#43 | 32.0(-16.0)#1,408 |
| 44. | Paw Paw Lake | 16.0 | 28.0(-12.0)#44 | 32.0(-16.0)#1,411 |
| 45. | Harvey | 16.0 | 28.0(-12.0)#45 | 32.0(-16.0)#1,416 |
| 46. | Village Of Grosse Pointe Shores | 16.0 | 28.0(-12.0)#46 | 32.0(-16.0)#1,422 |
| 47. | Ortonville | 16.0 | 28.0(-12.0)#47 | 32.0(-16.0)#1,446 |
| 48. | Big Rapids | 17.0 | 28.0(-11.0)#48 | 32.0(-15.0)#1,544 |
| 49. | Mattawan | 17.0 | 28.0(-11.0)#49 | 32.0(-15.0)#1,582 |
| 50. | Reed City | 17.0 | 28.0(-11.0)#50 | 32.0(-15.0)#1,583 |
| 51. | Munising | 17.0 | 28.0(-11.0)#51 | 32.0(-15.0)#1,593 |
| 52. | Niles | 18.0 | 28.0(-10.00)#52 | 32.0(-14.0)#1,691 |
| 53. | Muskegon Heights | 18.0 | 28.0(-10.00)#53 | 32.0(-14.0)#1,702 |
| 54. | Lowell | 18.0 | 28.0(-10.00)#54 | 32.0(-14.0)#1,734 |
| 55. | Plainwell | 18.0 | 28.0(-10.00)#55 | 32.0(-14.0)#1,740 |
| 56. | Ovid | 18.0 | 28.0(-10.00)#56 | 32.0(-14.0)#1,778 |
| 57. | Holland | 19.0 | 28.0(-9.00)#57 | 32.0(-13.0)#1,828 |
| 58. | Alpena | 19.0 | 28.0(-9.00)#58 | 32.0(-13.0)#1,876 |
| 59. | Chelsea | 19.0 | 28.0(-9.00)#59 | 32.0(-13.0)#1,901 |
| 60. | Montague | 19.0 | 28.0(-9.00)#60 | 32.0(-13.0)#1,923 |
| 61. | Laurium | 19.0 | 28.0(-9.00)#61 | 32.0(-13.0)#1,944 |
| 62. | Centreville | 19.0 | 28.0(-9.00)#62 | 32.0(-13.0)#1,953 |
| 63. | Fowler | 19.0 | 28.0(-9.00)#63 | 32.0(-13.0)#1,954 |
| 64. | Flint | 20.0 | 28.0(-8.00)#64 | 32.0(-12.0)#1,981 |
| 65. | Southfield | 20.0 | 28.0(-8.00)#65 | 32.0(-12.0)#1,983 |
| 66. | Garden City | 20.0 | 28.0(-8.00)#66 | 32.0(-12.0)#2,004 |
| 67. | Sault Ste Marie | 20.0 | 28.0(-8.00)#67 | 32.0(-12.0)#2,031 |
| 68. | Flushing | 20.0 | 28.0(-8.00)#68 | 32.0(-12.0)#2,053 |
| 69. | Brighton | 20.0 | 28.0(-8.00)#69 | 32.0(-12.0)#2,059 |
| 70. | Petoskey | 20.0 | 28.0(-8.00)#70 | 32.0(-12.0)#2,066 |
| 71. | Essexville | 20.0 | 28.0(-8.00)#71 | 32.0(-12.0)#2,084 |
| 72. | Hart | 20.0 | 28.0(-8.00)#72 | 32.0(-12.0)#2,100 |
| 73. | Tawas City | 20.0 | 28.0(-8.00)#73 | 32.0(-12.0)#2,110 |
| 74. | Edmore | 20.0 | 28.0(-8.00)#74 | 32.0(-12.0)#2,116 |
| 75. | Warren | 21.0 | 28.0(-7.00)#75 | 32.0(-11.0)#2,139 |
| 76. | Lincoln Park | 21.0 | 28.0(-7.00)#76 | 32.0(-11.0)#2,162 |
| 77. | Jackson | 21.0 | 28.0(-7.00)#77 | 32.0(-11.0)#2,171 |
| 78. | Rochester | 21.0 | 28.0(-7.00)#78 | 32.0(-11.0)#2,206 |
| 79. | Beverly Hills | 21.0 | 28.0(-7.00)#79 | 32.0(-11.0)#2,217 |
| 80. | Shoreham | 21.0 | 28.0(-7.00)#80 | 32.0(-11.0)#2,296 |
| 81. | Carsonville | 21.0 | 28.0(-7.00)#81 | 32.0(-11.0)#2,305 |
| 82. | Saginaw | 22.0 | 28.0(-6.00)#82 | 32.0(-10.00)#2,333 |
| 83. | Adrian | 22.0 | 28.0(-6.00)#83 | 32.0(-10.00)#2,359 |
| 84. | Clarksville | 22.0 | 28.0(-6.00)#84 | 32.0(-10.00)#2,485 |
| 85. | Battle Creek | 23.0 | 28.0(-5.00)#85 | 32.0(-9.00)#2,504 |
| 86. | Rockwood | 23.0 | 28.0(-5.00)#86 | 32.0(-9.00)#2,600 |
| 87. | Montrose | 23.0 | 28.0(-5.00)#87 | 32.0(-9.00)#2,627 |
| 88. | Petersburg | 23.0 | 28.0(-5.00)#88 | 32.0(-9.00)#2,648 |
| 89. | Rochester Hills | 24.0 | 28.0(-4.00)#89 | 32.0(-8.00)#2,688 |
| 90. | Woodhaven | 24.0 | 28.0(-4.00)#90 | 32.0(-8.00)#2,752 |
| 91. | St Joseph | 24.0 | 28.0(-4.00)#91 | 32.0(-8.00)#2,778 |
| 92. | Dewitt | 24.0 | 28.0(-4.00)#92 | 32.0(-8.00)#2,792 |
| 93. | Ithaca | 24.0 | 28.0(-4.00)#93 | 32.0(-8.00)#2,798 |
| 94. | Carleton | 24.0 | 28.0(-4.00)#94 | 32.0(-8.00)#2,801 |
| 95. | Harrison | 24.0 | 28.0(-4.00)#95 | 32.0(-8.00)#2,811 |
| 96. | Farwell | 24.0 | 28.0(-4.00)#96 | 32.0(-8.00)#2,842 |
| 97. | Sheridan | 24.0 | 28.0(-4.00)#97 | 32.0(-8.00)#2,846 |
| 98. | Pewamo | 24.0 | 28.0(-4.00)#98 | 32.0(-8.00)#2,849 |
| 99. | Kentwood | 25.0 | 28.0(-3.00)#99 | 32.0(-7.00)#2,880 |
| 100. | Oak Park | 25.0 | 28.0(-3.00)#100 | 32.0(-7.00)#2,898 |
Common Questions
What are the Top 10 Cities with the Fewest Births per 1,000 Women Over the Age of 35 in Michigan?
Top 10 Cities with the Fewest Births per 1,000 Women Over the Age of 35 in Michigan are:
#1
2.0
#2
3.0
#3
3.0
#4
3.0
#5
3.0
#6
4.0
#7
4.0
#8
7.0
#9
7.0
#10
7.0
What city has the Fewest Births per 1,000 Women Over the Age of 35 in Michigan?
Tecumseh has the Fewest Births per 1,000 Women Over the Age of 35 in Michigan with 2.0.
What is the Number of Births per 1,000 Women Over the Age of 35 in the State of Michigan?
Number of Births per 1,000 Women Over the Age of 35 in Michigan is 28.0.
What is the Number of Births per 1,000 Women Over the Age of 35 in the United States?
Number of Births per 1,000 Women Over the Age of 35 in the United States is 32.0.