North Auburn, CA Map & Demographics
North Auburn Map
North Auburn Overview
$41,393
PER CAPITA INCOME
$102,704
AVG FAMILY INCOME
$74,315
AVG HOUSEHOLD INCOME
20.5%
WAGE / INCOME GAP [ % ]
79.5¢/ $1
WAGE / INCOME GAP [ $ ]
0.47
INEQUALITY / GINI INDEX
14,403
TOTAL POPULATION
7,200
MALE POPULATION
7,203
FEMALE POPULATION
99.96
MALES / 100 FEMALES
100.04
FEMALES / 100 MALES
43.8
MEDIAN AGE
3.1
AVG FAMILY SIZE
2.4
AVG HOUSEHOLD SIZE
6,344
LABOR FORCE [ PEOPLE ]
54.0%
PERCENT IN LABOR FORCE
2.5%
UNEMPLOYMENT RATE
Income in North Auburn
Income Overview in North Auburn
Per Capita Income in North Auburn is $41,393, while median incomes of families and households are $102,704 and $74,315 respectively.
| Characteristic | Number | Measure |
| Per Capita Income | 14,403 | $41,393 |
| Median Family Income | 3,460 | $102,704 |
| Mean Family Income | 3,460 | $129,559 |
| Median Household Income | 5,522 | $74,315 |
| Mean Household Income | 5,522 | $103,749 |
| Income Deficit | 3,460 | $0 |
| Wage / Income Gap (%) | 14,403 | 20.49% |
| Wage / Income Gap ($) | 14,403 | 79.51¢ per $1 |
| Gini / Inequality Index | 14,403 | 0.47 |
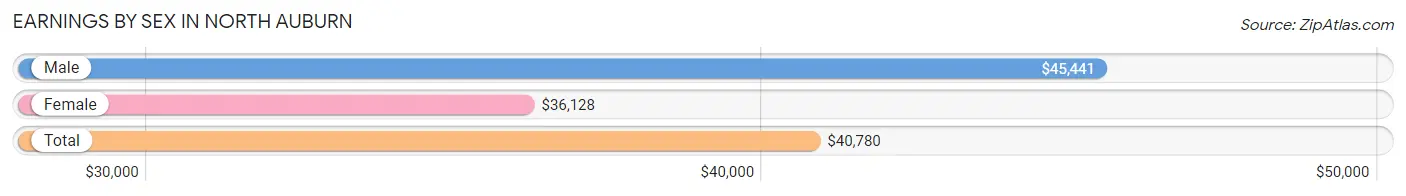
Earnings by Sex in North Auburn
Average Earnings in North Auburn are $40,780, $45,441 for men and $36,128 for women, a difference of 20.5%.
| Sex | Number | Average Earnings |
| Male | 3,824 (56.9%) | $45,441 |
| Female | 2,895 (43.1%) | $36,128 |
| Total | 6,719 (100.0%) | $40,780 |
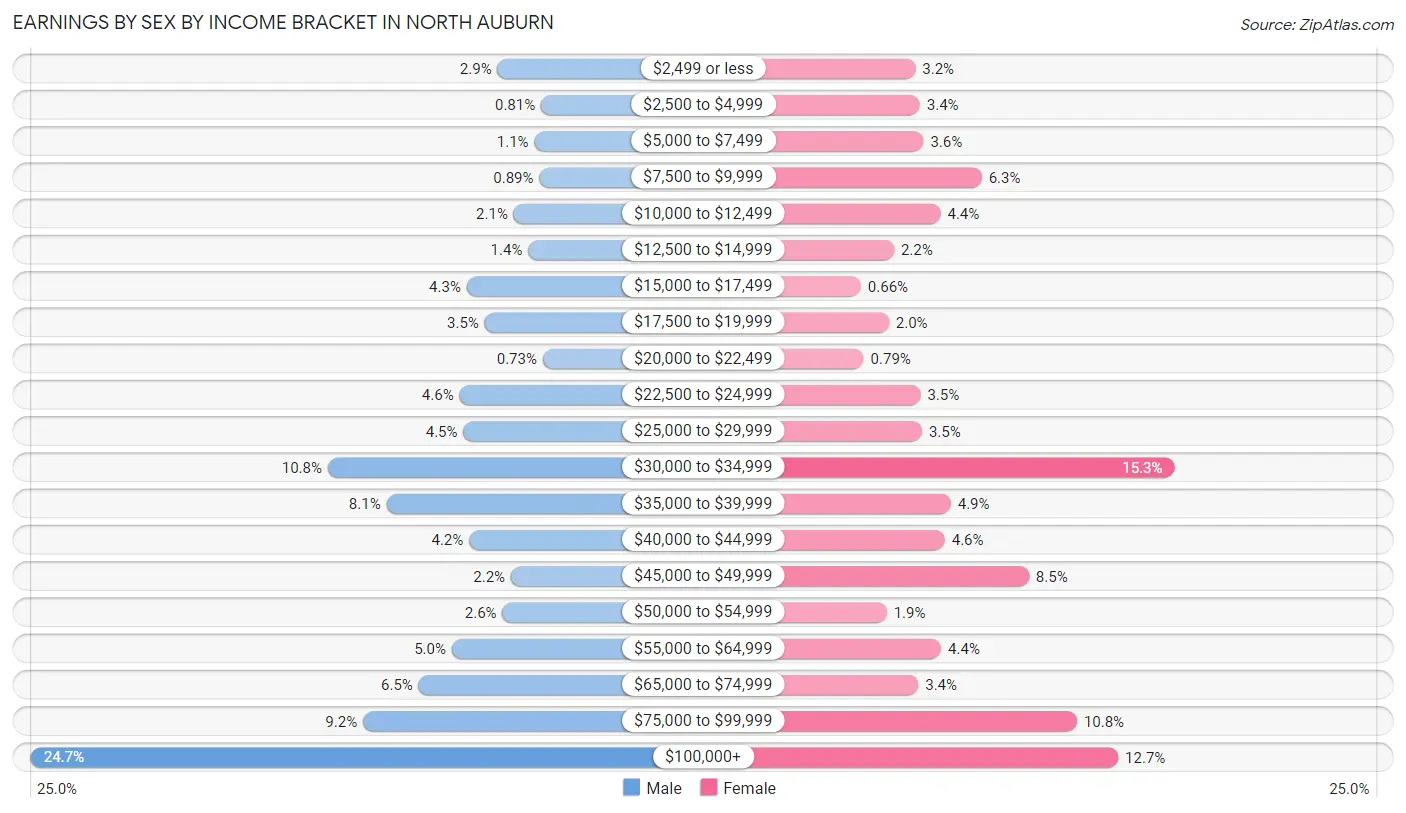
Earnings by Sex by Income Bracket in North Auburn
The most common earnings brackets in North Auburn are $100,000+ for men (945 | 24.7%) and $30,000 to $34,999 for women (444 | 15.3%).
| Income | Male | Female |
| $2,499 or less | 109 (2.9%) | 93 (3.2%) |
| $2,500 to $4,999 | 31 (0.8%) | 99 (3.4%) |
| $5,000 to $7,499 | 43 (1.1%) | 104 (3.6%) |
| $7,500 to $9,999 | 34 (0.9%) | 183 (6.3%) |
| $10,000 to $12,499 | 80 (2.1%) | 127 (4.4%) |
| $12,500 to $14,999 | 54 (1.4%) | 64 (2.2%) |
| $15,000 to $17,499 | 164 (4.3%) | 19 (0.7%) |
| $17,500 to $19,999 | 132 (3.5%) | 57 (2.0%) |
| $20,000 to $22,499 | 28 (0.7%) | 23 (0.8%) |
| $22,500 to $24,999 | 177 (4.6%) | 100 (3.5%) |
| $25,000 to $29,999 | 170 (4.4%) | 102 (3.5%) |
| $30,000 to $34,999 | 413 (10.8%) | 444 (15.3%) |
| $35,000 to $39,999 | 308 (8.1%) | 141 (4.9%) |
| $40,000 to $44,999 | 160 (4.2%) | 133 (4.6%) |
| $45,000 to $49,999 | 85 (2.2%) | 247 (8.5%) |
| $50,000 to $54,999 | 100 (2.6%) | 54 (1.9%) |
| $55,000 to $64,999 | 191 (5.0%) | 128 (4.4%) |
| $65,000 to $74,999 | 250 (6.5%) | 97 (3.4%) |
| $75,000 to $99,999 | 350 (9.1%) | 312 (10.8%) |
| $100,000+ | 945 (24.7%) | 368 (12.7%) |
| Total | 3,824 (100.0%) | 2,895 (100.0%) |
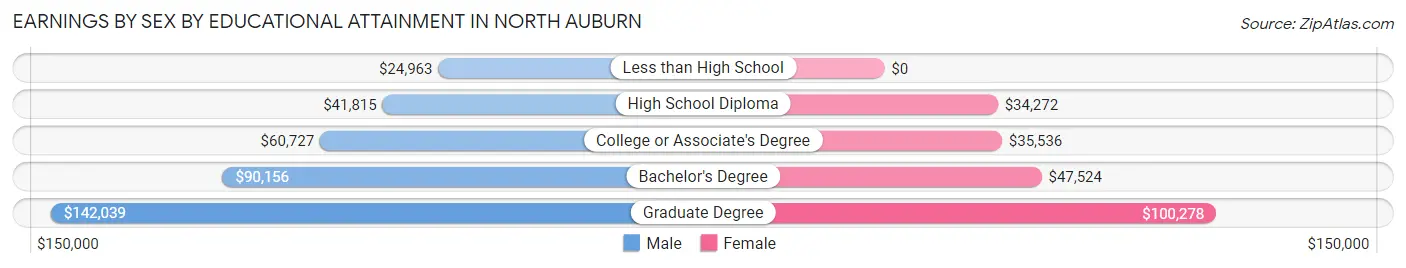
Earnings by Sex by Educational Attainment in North Auburn
Average earnings in North Auburn are $57,520 for men and $40,550 for women, a difference of 29.5%. Men with an educational attainment of graduate degree enjoy the highest average annual earnings of $142,039, while those with less than high school education earn the least with $24,963. Women with an educational attainment of graduate degree earn the most with the average annual earnings of $100,278, while those with high school diploma education have the smallest earnings of $34,272.
| Educational Attainment | Male Income | Female Income |
| Less than High School | $24,963 | $0 |
| High School Diploma | $41,815 | $34,272 |
| College or Associate's Degree | $60,727 | $35,536 |
| Bachelor's Degree | $90,156 | $47,524 |
| Graduate Degree | $142,039 | $100,278 |
| Total | $57,520 | $40,550 |
Family Income in North Auburn
Family Income Brackets in North Auburn
According to the North Auburn family income data, there are 702 families falling into the $100,000 to $149,999 income range, which is the most common income bracket and makes up 20.3% of all families. Conversely, the $15,000 to $24,999 income bracket is the least frequent group with only 59 families (1.7%) belonging to this category.
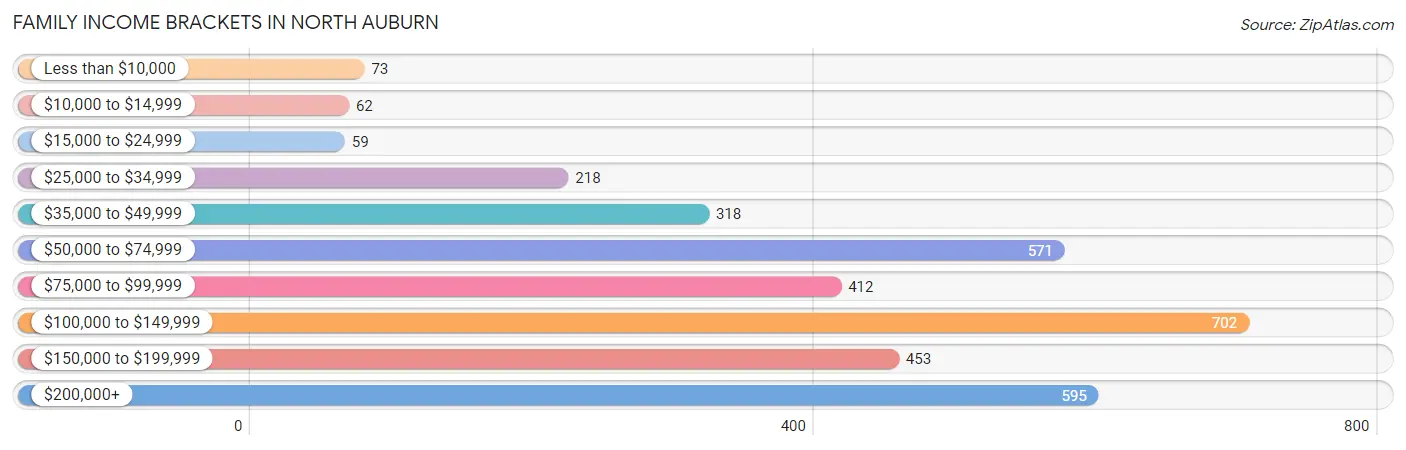
| Income Bracket | # Families | % Families |
| Less than $10,000 | 73 | 2.1% |
| $10,000 to $14,999 | 62 | 1.8% |
| $15,000 to $24,999 | 59 | 1.7% |
| $25,000 to $34,999 | 218 | 6.3% |
| $35,000 to $49,999 | 318 | 9.2% |
| $50,000 to $74,999 | 571 | 16.5% |
| $75,000 to $99,999 | 412 | 11.9% |
| $100,000 to $149,999 | 702 | 20.3% |
| $150,000 to $199,999 | 453 | 13.1% |
| $200,000+ | 595 | 17.2% |
Family Income by Famaliy Size in North Auburn
5-person families (350 | 10.1%) account for the highest median family income in North Auburn with $155,278 per family, while 2-person families (1,634 | 47.2%) have the highest median income of $43,349 per family member.
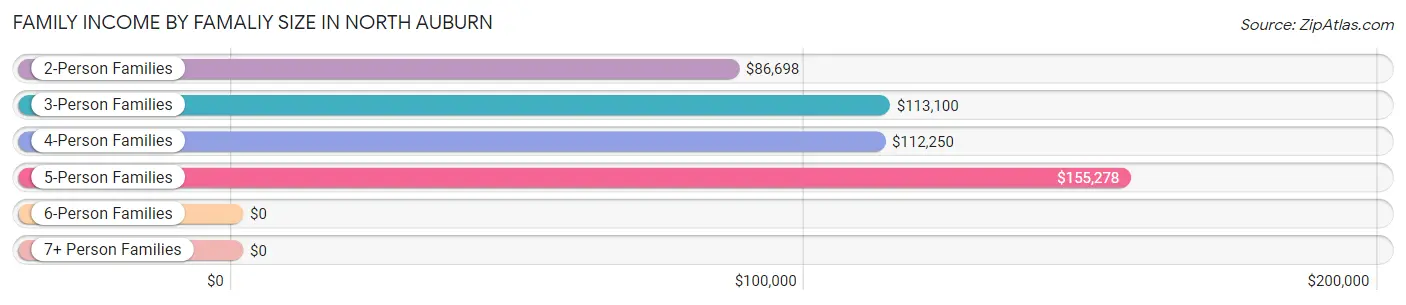
| Income Bracket | # Families | Median Income |
| 2-Person Families | 1,634 (47.2%) | $86,698 |
| 3-Person Families | 610 (17.6%) | $113,100 |
| 4-Person Families | 822 (23.8%) | $112,250 |
| 5-Person Families | 350 (10.1%) | $155,278 |
| 6-Person Families | 0 (0.0%) | $0 |
| 7+ Person Families | 44 (1.3%) | $0 |
| Total | 3,460 (100.0%) | $102,704 |
Family Income by Number of Earners in North Auburn
The median family income in North Auburn is $102,704, with families comprising 3+ earners (397) having the highest median family income of $156,458, while families with no earners (620) have the lowest median family income of $52,857, accounting for 11.5% and 17.9% of families, respectively.
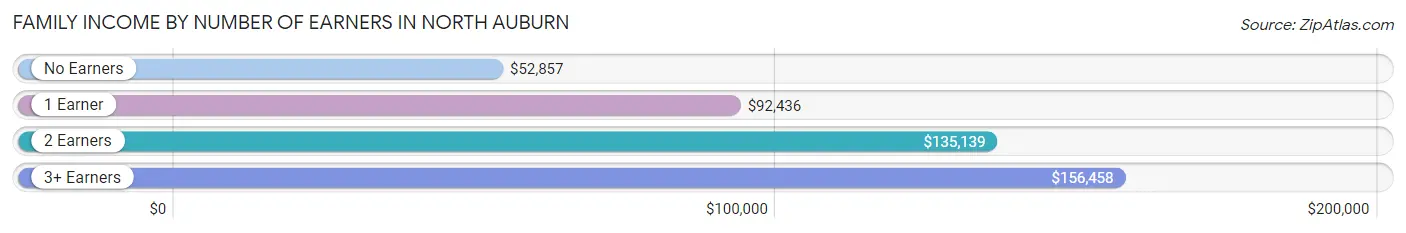
| Number of Earners | # Families | Median Income |
| No Earners | 620 (17.9%) | $52,857 |
| 1 Earner | 1,096 (31.7%) | $92,436 |
| 2 Earners | 1,347 (38.9%) | $135,139 |
| 3+ Earners | 397 (11.5%) | $156,458 |
| Total | 3,460 (100.0%) | $102,704 |
Household Income in North Auburn
Household Income Brackets in North Auburn
With 988 households falling in the category, the $100,000 to $149,999 income range is the most frequent in North Auburn, accounting for 17.9% of all households. In contrast, only 215 households (3.9%) fall into the $10,000 to $14,999 income bracket, making it the least populous group.
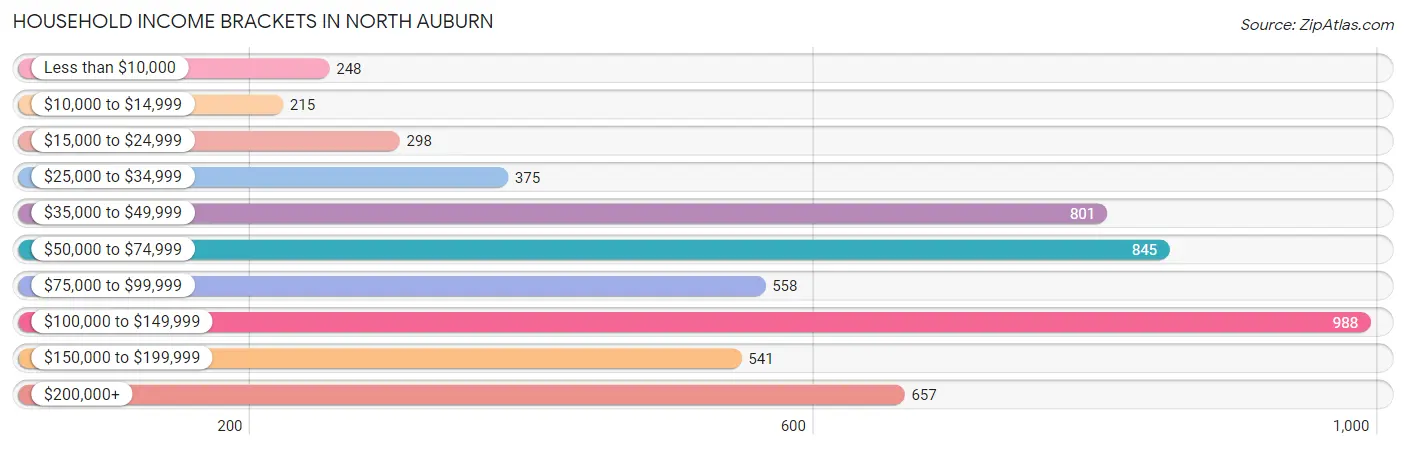
| Income Bracket | # Households | % Households |
| Less than $10,000 | 248 | 4.5% |
| $10,000 to $14,999 | 215 | 3.9% |
| $15,000 to $24,999 | 298 | 5.4% |
| $25,000 to $34,999 | 375 | 6.8% |
| $35,000 to $49,999 | 801 | 14.5% |
| $50,000 to $74,999 | 845 | 15.3% |
| $75,000 to $99,999 | 558 | 10.1% |
| $100,000 to $149,999 | 988 | 17.9% |
| $150,000 to $199,999 | 541 | 9.8% |
| $200,000+ | 657 | 11.9% |
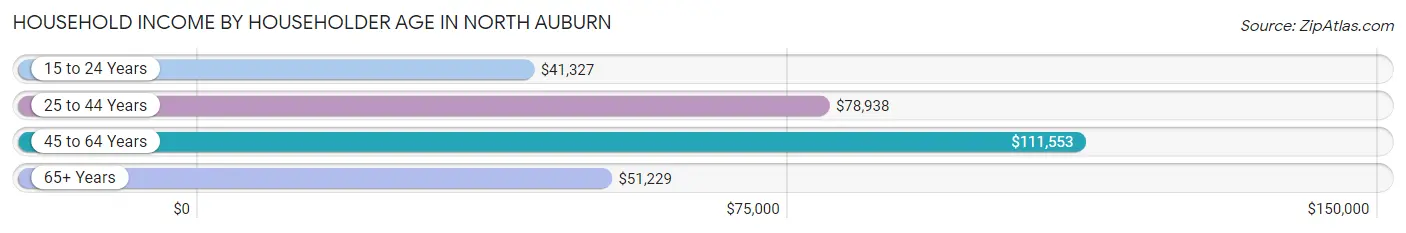
Household Income by Householder Age in North Auburn
The median household income in North Auburn is $74,315, with the highest median household income of $111,553 found in the 45 to 64 years age bracket for the primary householder. A total of 1,820 households (33.0%) fall into this category. Meanwhile, the 15 to 24 years age bracket for the primary householder has the lowest median household income of $41,327, with 157 households (2.8%) in this group.
| Income Bracket | # Households | Median Income |
| 15 to 24 Years | 157 (2.8%) | $41,327 |
| 25 to 44 Years | 1,415 (25.6%) | $78,938 |
| 45 to 64 Years | 1,820 (33.0%) | $111,553 |
| 65+ Years | 2,130 (38.6%) | $51,229 |
| Total | 5,522 (100.0%) | $74,315 |
Poverty in North Auburn
Income Below Poverty by Sex and Age in North Auburn
With 10.4% poverty level for males and 13.7% for females among the residents of North Auburn, 5 year old males and 12 to 14 year old females are the most vulnerable to poverty, with 62 males (69.7%) and 77 females (27.6%) in their respective age groups living below the poverty level.
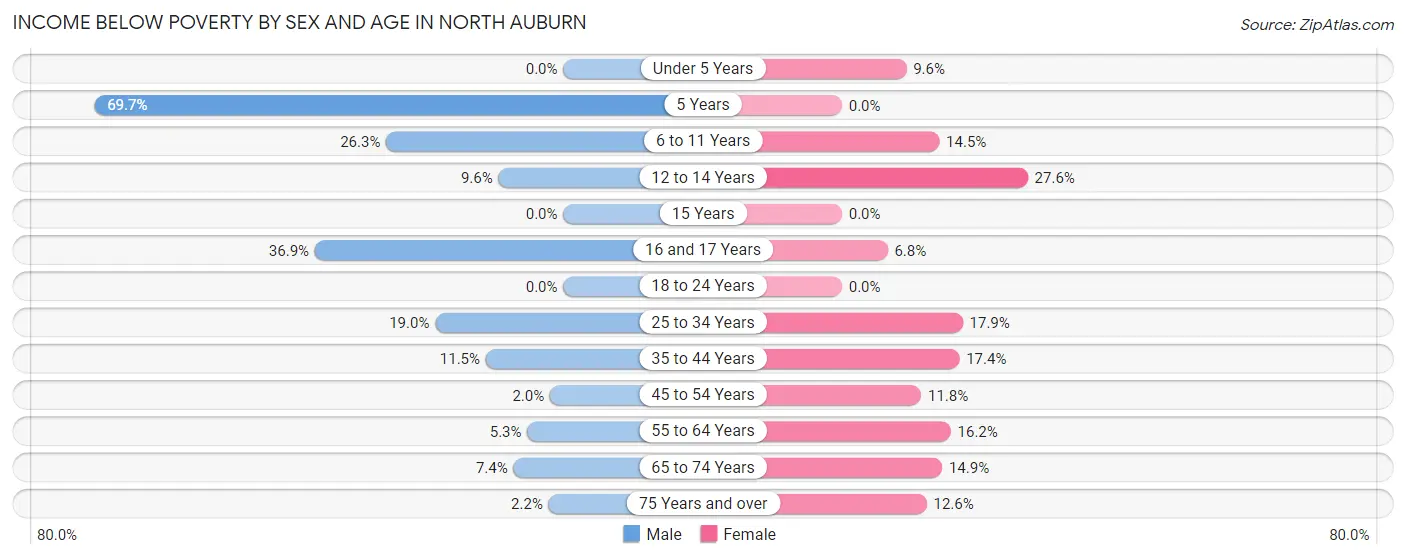
| Age Bracket | Male | Female |
| Under 5 Years | 0 (0.0%) | 38 (9.6%) |
| 5 Years | 62 (69.7%) | 0 (0.0%) |
| 6 to 11 Years | 172 (26.3%) | 58 (14.5%) |
| 12 to 14 Years | 25 (9.6%) | 77 (27.6%) |
| 15 Years | 0 (0.0%) | 0 (0.0%) |
| 16 and 17 Years | 45 (36.9%) | 12 (6.8%) |
| 18 to 24 Years | 0 (0.0%) | 0 (0.0%) |
| 25 to 34 Years | 170 (19.0%) | 127 (17.9%) |
| 35 to 44 Years | 100 (11.5%) | 128 (17.4%) |
| 45 to 54 Years | 17 (2.0%) | 109 (11.8%) |
| 55 to 64 Years | 47 (5.3%) | 143 (16.2%) |
| 65 to 74 Years | 56 (7.4%) | 129 (14.9%) |
| 75 Years and over | 11 (2.2%) | 139 (12.6%) |
| Total | 705 (10.4%) | 960 (13.7%) |
Income Above Poverty by Sex and Age in North Auburn
According to the poverty statistics in North Auburn, males aged under 5 years and females aged 5 years are the age groups that are most secure financially, with 100.0% of males and 100.0% of females in these age groups living above the poverty line.
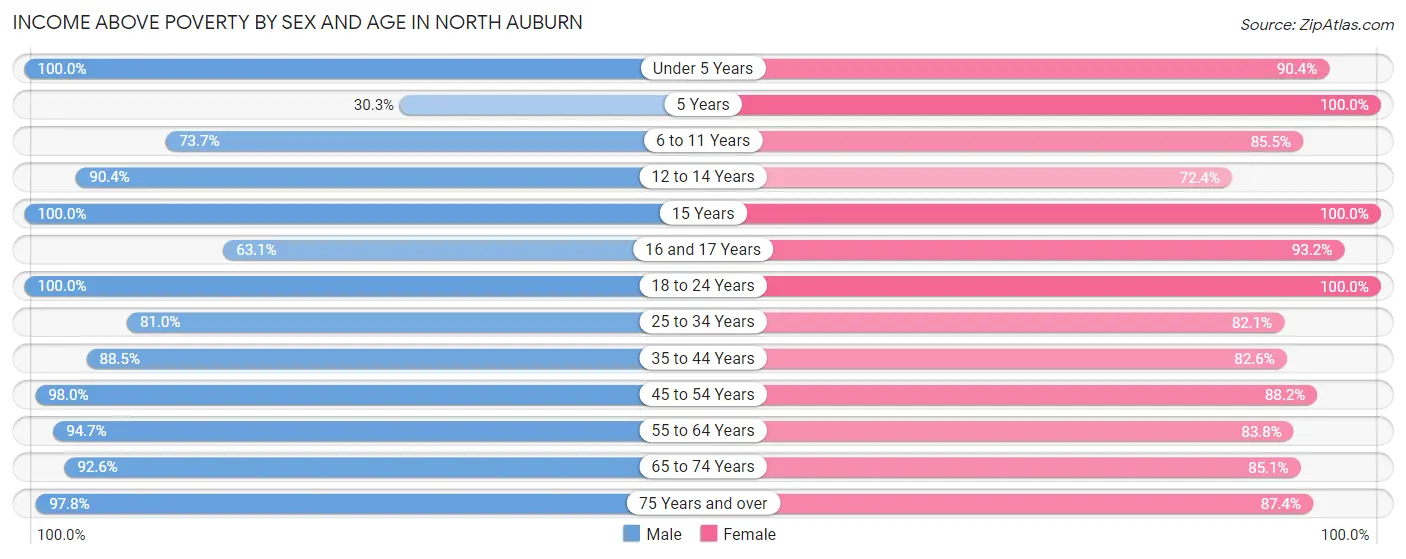
| Age Bracket | Male | Female |
| Under 5 Years | 369 (100.0%) | 359 (90.4%) |
| 5 Years | 27 (30.3%) | 75 (100.0%) |
| 6 to 11 Years | 482 (73.7%) | 343 (85.5%) |
| 12 to 14 Years | 235 (90.4%) | 202 (72.4%) |
| 15 Years | 21 (100.0%) | 97 (100.0%) |
| 16 and 17 Years | 77 (63.1%) | 165 (93.2%) |
| 18 to 24 Years | 478 (100.0%) | 351 (100.0%) |
| 25 to 34 Years | 724 (81.0%) | 581 (82.1%) |
| 35 to 44 Years | 769 (88.5%) | 606 (82.6%) |
| 45 to 54 Years | 847 (98.0%) | 817 (88.2%) |
| 55 to 64 Years | 833 (94.7%) | 742 (83.8%) |
| 65 to 74 Years | 701 (92.6%) | 738 (85.1%) |
| 75 Years and over | 495 (97.8%) | 966 (87.4%) |
| Total | 6,058 (89.6%) | 6,042 (86.3%) |
Income Below Poverty Among Married-Couple Families in North Auburn
The poverty statistics for married-couple families in North Auburn show that 6.2% or 169 of the total 2,704 families live below the poverty line. Families with 3 or 4 children have the highest poverty rate of 26.7%, comprising of 23 families. On the other hand, families with 5 or more children have the lowest poverty rate of 0.0%, which includes 0 families.
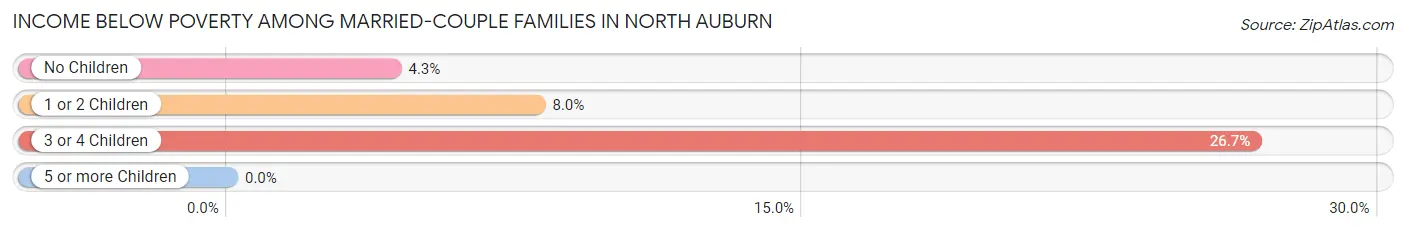
| Children | Above Poverty | Below Poverty |
| No Children | 1,546 (95.7%) | 69 (4.3%) |
| 1 or 2 Children | 882 (92.0%) | 77 (8.0%) |
| 3 or 4 Children | 63 (73.3%) | 23 (26.7%) |
| 5 or more Children | 44 (100.0%) | 0 (0.0%) |
| Total | 2,535 (93.8%) | 169 (6.2%) |
Income Below Poverty Among Single-Parent Households in North Auburn
According to the poverty data in North Auburn, 1.4% or 4 single-father households and 20.8% or 98 single-mother households are living below the poverty line. Among single-father households, those with 1 or 2 children have the highest poverty rate, with 4 households (2.6%) experiencing poverty. Likewise, among single-mother households, those with 3 or 4 children have the highest poverty rate, with 68 households (44.2%) falling below the poverty line.
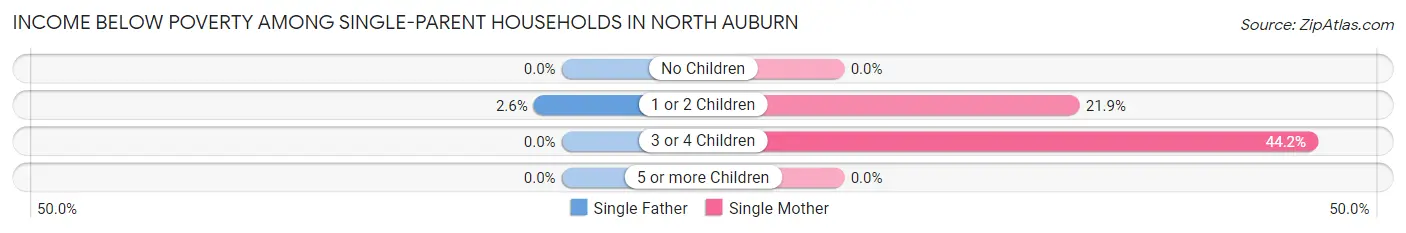
| Children | Single Father | Single Mother |
| No Children | 0 (0.0%) | 0 (0.0%) |
| 1 or 2 Children | 4 (2.6%) | 30 (21.9%) |
| 3 or 4 Children | 0 (0.0%) | 68 (44.2%) |
| 5 or more Children | 0 (0.0%) | 0 (0.0%) |
| Total | 4 (1.4%) | 98 (20.8%) |
Income Below Poverty Among Married-Couple vs Single-Parent Households in North Auburn
The poverty data for North Auburn shows that 169 of the married-couple family households (6.2%) and 102 of the single-parent households (13.5%) are living below the poverty level. Within the married-couple family households, those with 3 or 4 children have the highest poverty rate, with 23 households (26.7%) falling below the poverty line. Among the single-parent households, those with 3 or 4 children have the highest poverty rate, with 68 household (44.2%) living below poverty.
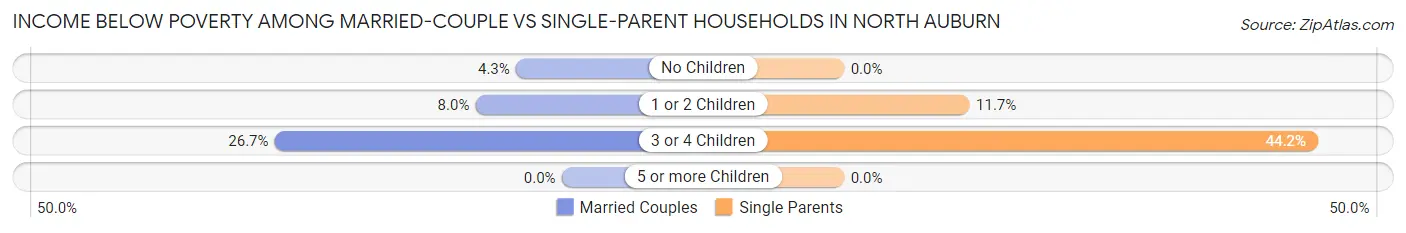
| Children | Married-Couple Families | Single-Parent Households |
| No Children | 69 (4.3%) | 0 (0.0%) |
| 1 or 2 Children | 77 (8.0%) | 34 (11.7%) |
| 3 or 4 Children | 23 (26.7%) | 68 (44.2%) |
| 5 or more Children | 0 (0.0%) | 0 (0.0%) |
| Total | 169 (6.2%) | 102 (13.5%) |
Race in North Auburn
The most populous races in North Auburn are White / Caucasian (11,175 | 77.6%), Hispanic or Latino (3,245 | 22.5%), and Two or more Races (1,394 | 9.7%).
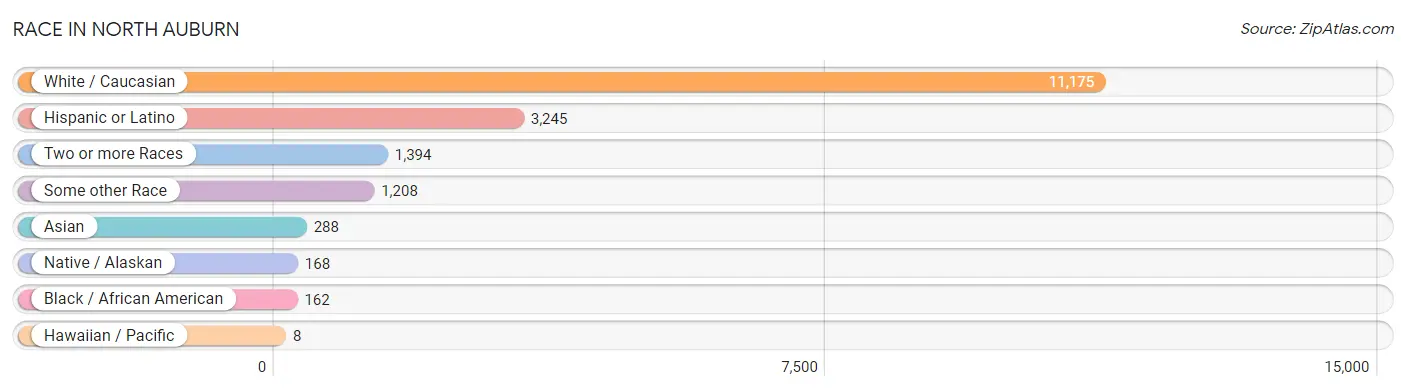
| Race | # Population | % Population |
| Asian | 288 | 2.0% |
| Black / African American | 162 | 1.1% |
| Hawaiian / Pacific | 8 | 0.1% |
| Hispanic or Latino | 3,245 | 22.5% |
| Native / Alaskan | 168 | 1.2% |
| White / Caucasian | 11,175 | 77.6% |
| Two or more Races | 1,394 | 9.7% |
| Some other Race | 1,208 | 8.4% |
| Total | 14,403 | 100.0% |
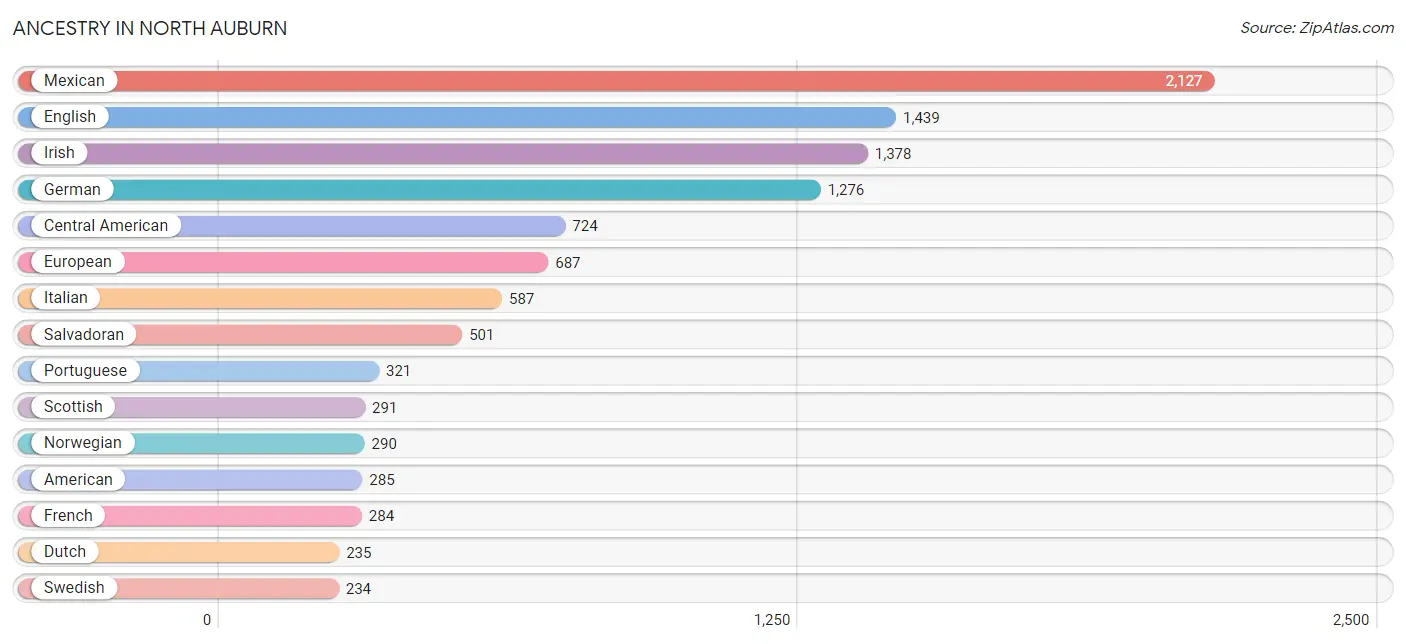
Ancestry in North Auburn
The most populous ancestries reported in North Auburn are Mexican (2,127 | 14.8%), English (1,439 | 10.0%), Irish (1,378 | 9.6%), German (1,276 | 8.9%), and Central American (724 | 5.0%), together accounting for 48.2% of all North Auburn residents.
| Ancestry | # Population | % Population |
| American | 285 | 2.0% |
| Apache | 12 | 0.1% |
| Arab | 26 | 0.2% |
| Austrian | 17 | 0.1% |
| Basque | 10 | 0.1% |
| Bhutanese | 192 | 1.3% |
| British | 132 | 0.9% |
| Burmese | 96 | 0.7% |
| Canadian | 77 | 0.5% |
| Central American | 724 | 5.0% |
| Cherokee | 175 | 1.2% |
| Colombian | 201 | 1.4% |
| Costa Rican | 5 | 0.0% |
| Croatian | 17 | 0.1% |
| Czech | 14 | 0.1% |
| Danish | 188 | 1.3% |
| Dutch | 235 | 1.6% |
| English | 1,439 | 10.0% |
| European | 687 | 4.8% |
| Finnish | 17 | 0.1% |
| French | 284 | 2.0% |
| French Canadian | 95 | 0.7% |
| German | 1,276 | 8.9% |
| Greek | 17 | 0.1% |
| Guatemalan | 13 | 0.1% |
| Honduran | 75 | 0.5% |
| Hungarian | 66 | 0.5% |
| Indian (Asian) | 104 | 0.7% |
| Irish | 1,378 | 9.6% |
| Italian | 587 | 4.1% |
| Jordanian | 15 | 0.1% |
| Korean | 173 | 1.2% |
| Lebanese | 11 | 0.1% |
| Lithuanian | 4 | 0.0% |
| Luxembourger | 14 | 0.1% |
| Mexican | 2,127 | 14.8% |
| Mongolian | 8 | 0.1% |
| Native Hawaiian | 42 | 0.3% |
| Navajo | 1 | 0.0% |
| Northern European | 12 | 0.1% |
| Norwegian | 290 | 2.0% |
| Paiute | 2 | 0.0% |
| Pakistani | 43 | 0.3% |
| Pennsylvania German | 24 | 0.2% |
| Polish | 93 | 0.6% |
| Portuguese | 321 | 2.2% |
| Pueblo | 18 | 0.1% |
| Puerto Rican | 43 | 0.3% |
| Romanian | 21 | 0.2% |
| Russian | 134 | 0.9% |
| Salvadoran | 501 | 3.5% |
| Scandinavian | 57 | 0.4% |
| Scotch-Irish | 91 | 0.6% |
| Scottish | 291 | 2.0% |
| Slovak | 9 | 0.1% |
| Slovene | 28 | 0.2% |
| South American | 201 | 1.4% |
| Spanish | 117 | 0.8% |
| Spanish American | 13 | 0.1% |
| Sri Lankan | 18 | 0.1% |
| Swedish | 234 | 1.6% |
| Swiss | 61 | 0.4% |
| Welsh | 162 | 1.1% | View All 63 Rows |
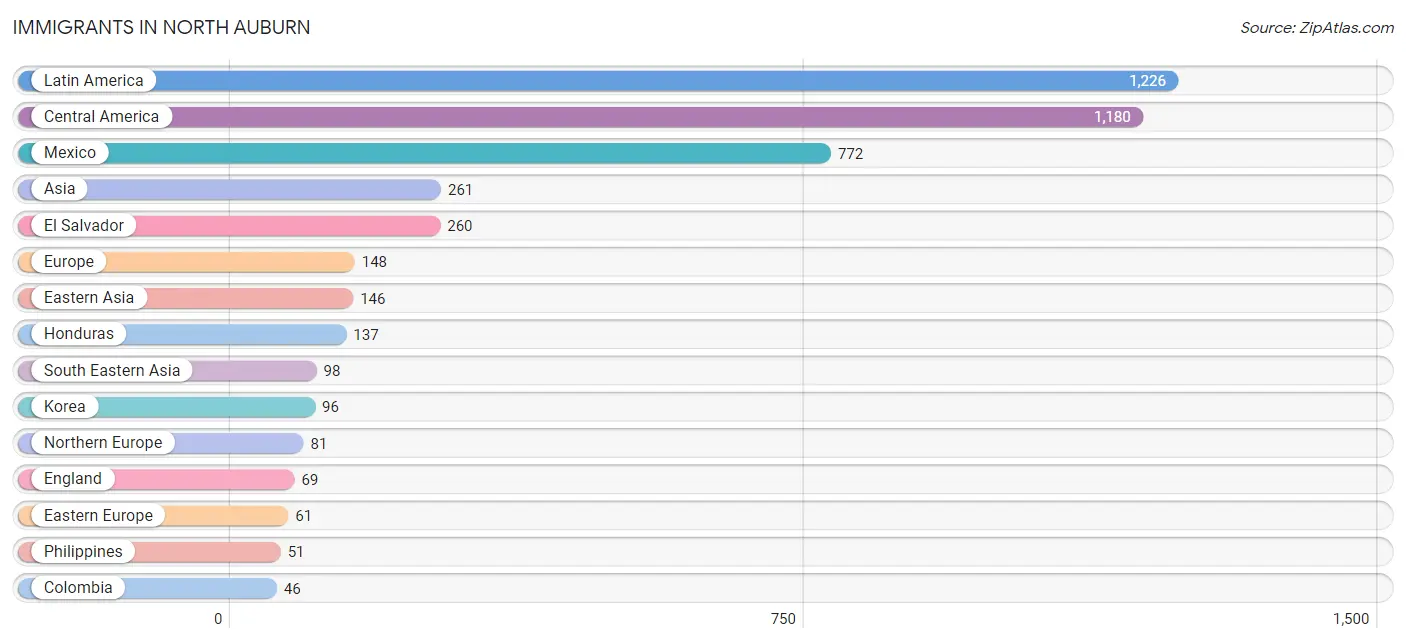
Immigrants in North Auburn
The most numerous immigrant groups reported in North Auburn came from Latin America (1,226 | 8.5%), Central America (1,180 | 8.2%), Mexico (772 | 5.4%), Asia (261 | 1.8%), and El Salvador (260 | 1.8%), together accounting for 25.7% of all North Auburn residents.
| Immigration Origin | # Population | % Population |
| Asia | 261 | 1.8% |
| Australia | 13 | 0.1% |
| Canada | 8 | 0.1% |
| Central America | 1,180 | 8.2% |
| China | 44 | 0.3% |
| Colombia | 46 | 0.3% |
| Costa Rica | 5 | 0.0% |
| Czechoslovakia | 9 | 0.1% |
| Denmark | 8 | 0.1% |
| Eastern Asia | 146 | 1.0% |
| Eastern Europe | 61 | 0.4% |
| El Salvador | 260 | 1.8% |
| England | 69 | 0.5% |
| Europe | 148 | 1.0% |
| Germany | 6 | 0.0% |
| Guatemala | 6 | 0.0% |
| Honduras | 137 | 0.9% |
| Hong Kong | 32 | 0.2% |
| Iran | 17 | 0.1% |
| Japan | 6 | 0.0% |
| Korea | 96 | 0.7% |
| Latin America | 1,226 | 8.5% |
| Malaysia | 8 | 0.1% |
| Mexico | 772 | 5.4% |
| Northern Europe | 81 | 0.6% |
| Oceania | 13 | 0.1% |
| Philippines | 51 | 0.4% |
| Romania | 18 | 0.1% |
| Russia | 34 | 0.2% |
| South America | 46 | 0.3% |
| South Central Asia | 17 | 0.1% |
| South Eastern Asia | 98 | 0.7% |
| Sweden | 4 | 0.0% |
| Thailand | 21 | 0.2% |
| Vietnam | 18 | 0.1% |
| Western Europe | 6 | 0.0% | View All 36 Rows |
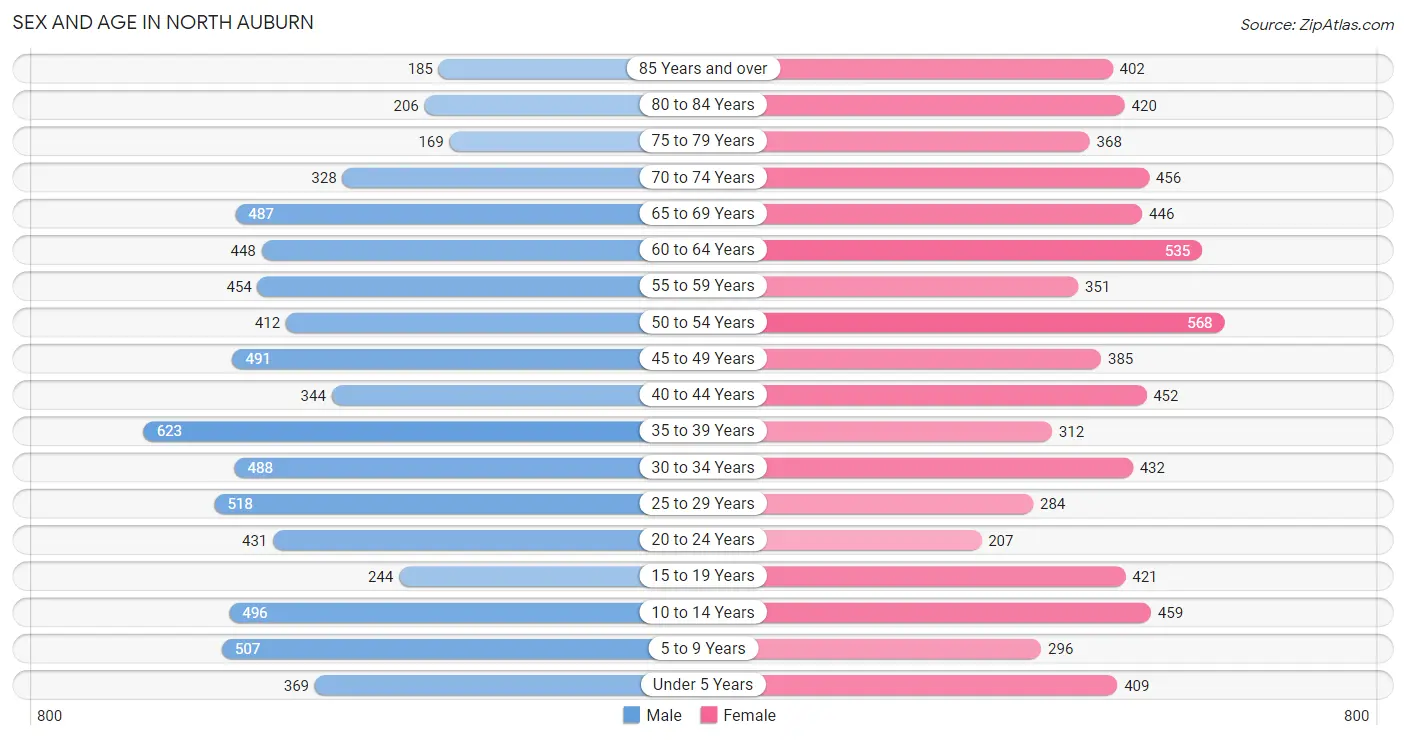
Sex and Age in North Auburn
Sex and Age in North Auburn
The most populous age groups in North Auburn are 35 to 39 Years (623 | 8.6%) for men and 50 to 54 Years (568 | 7.9%) for women.
| Age Bracket | Male | Female |
| Under 5 Years | 369 (5.1%) | 409 (5.7%) |
| 5 to 9 Years | 507 (7.0%) | 296 (4.1%) |
| 10 to 14 Years | 496 (6.9%) | 459 (6.4%) |
| 15 to 19 Years | 244 (3.4%) | 421 (5.8%) |
| 20 to 24 Years | 431 (6.0%) | 207 (2.9%) |
| 25 to 29 Years | 518 (7.2%) | 284 (3.9%) |
| 30 to 34 Years | 488 (6.8%) | 432 (6.0%) |
| 35 to 39 Years | 623 (8.6%) | 312 (4.3%) |
| 40 to 44 Years | 344 (4.8%) | 452 (6.3%) |
| 45 to 49 Years | 491 (6.8%) | 385 (5.3%) |
| 50 to 54 Years | 412 (5.7%) | 568 (7.9%) |
| 55 to 59 Years | 454 (6.3%) | 351 (4.9%) |
| 60 to 64 Years | 448 (6.2%) | 535 (7.4%) |
| 65 to 69 Years | 487 (6.8%) | 446 (6.2%) |
| 70 to 74 Years | 328 (4.6%) | 456 (6.3%) |
| 75 to 79 Years | 169 (2.4%) | 368 (5.1%) |
| 80 to 84 Years | 206 (2.9%) | 420 (5.8%) |
| 85 Years and over | 185 (2.6%) | 402 (5.6%) |
| Total | 7,200 (100.0%) | 7,203 (100.0%) |
Families and Households in North Auburn
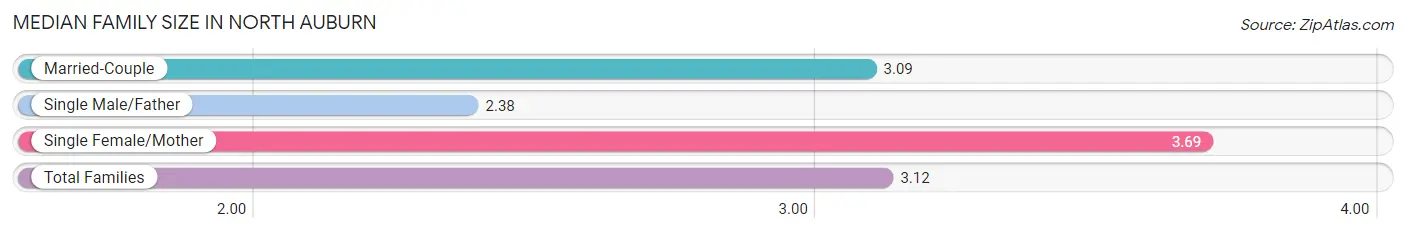
Median Family Size in North Auburn
The median family size in North Auburn is 3.12 persons per family, with single female/mother families (471 | 13.6%) accounting for the largest median family size of 3.69 persons per family. On the other hand, single male/father families (285 | 8.2%) represent the smallest median family size with 2.38 persons per family.
| Family Type | # Families | Family Size |
| Married-Couple | 2,704 (78.1%) | 3.09 |
| Single Male/Father | 285 (8.2%) | 2.38 |
| Single Female/Mother | 471 (13.6%) | 3.69 |
| Total Families | 3,460 (100.0%) | 3.12 |
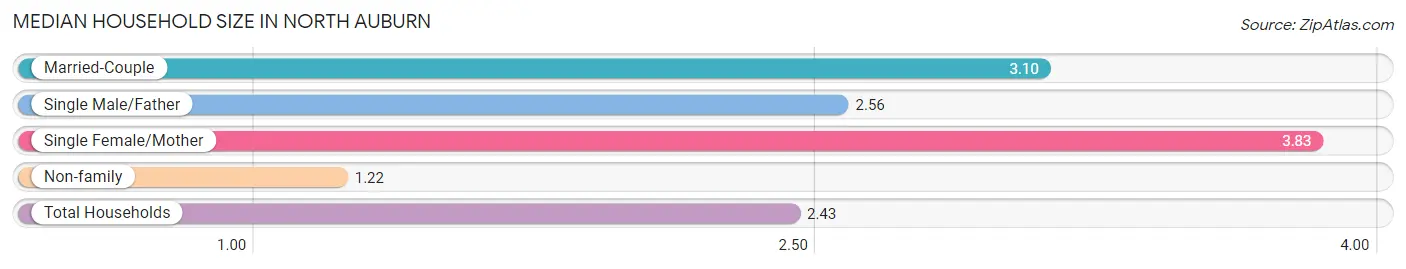
Median Household Size in North Auburn
The median household size in North Auburn is 2.43 persons per household, with single female/mother households (471 | 8.5%) accounting for the largest median household size of 3.83 persons per household. non-family households (2,062 | 37.3%) represent the smallest median household size with 1.22 persons per household.
| Household Type | # Households | Household Size |
| Married-Couple | 2,704 (49.0%) | 3.10 |
| Single Male/Father | 285 (5.2%) | 2.56 |
| Single Female/Mother | 471 (8.5%) | 3.83 |
| Non-family | 2,062 (37.3%) | 1.22 |
| Total Households | 5,522 (100.0%) | 2.43 |
Household Size by Marriage Status in North Auburn
Out of a total of 5,522 households in North Auburn, 3,460 (62.7%) are family households, while 2,062 (37.3%) are nonfamily households. The most numerous type of family households are 2-person households, comprising 1,578, and the most common type of nonfamily households are 1-person households, comprising 1,725.
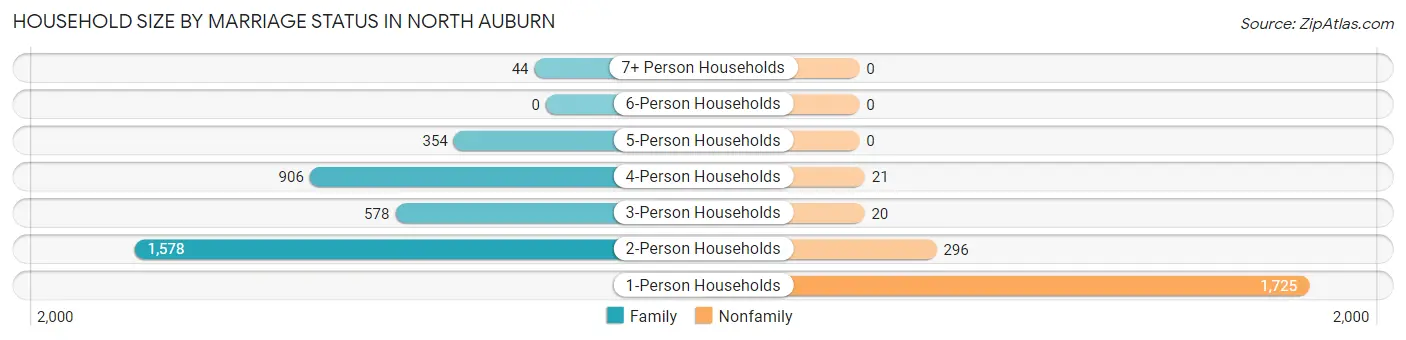
| Household Size | Family Households | Nonfamily Households |
| 1-Person Households | - | 1,725 (31.2%) |
| 2-Person Households | 1,578 (28.6%) | 296 (5.4%) |
| 3-Person Households | 578 (10.5%) | 20 (0.4%) |
| 4-Person Households | 906 (16.4%) | 21 (0.4%) |
| 5-Person Households | 354 (6.4%) | 0 (0.0%) |
| 6-Person Households | 0 (0.0%) | 0 (0.0%) |
| 7+ Person Households | 44 (0.8%) | 0 (0.0%) |
| Total | 3,460 (62.7%) | 2,062 (37.3%) |
Female Fertility in North Auburn
Fertility by Age in North Auburn
Average fertility rate in North Auburn is 35.0 births per 1,000 women. Women in the age bracket of 20 to 34 years have the highest fertility rate with 93.0 births per 1,000 women. Women in the age bracket of 20 to 34 years acount for 91.5% of all women with births.
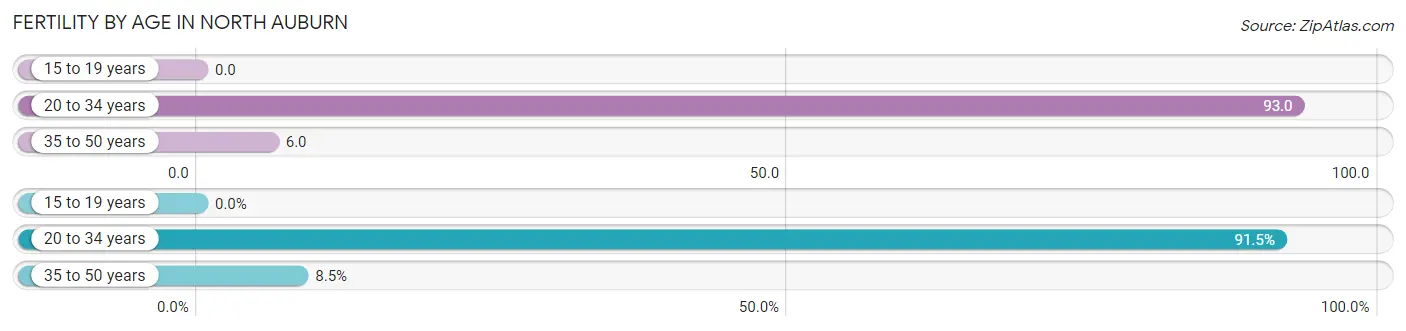
| Age Bracket | Women with Births | Births / 1,000 Women |
| 15 to 19 years | 0 (0.0%) | 0.0 |
| 20 to 34 years | 86 (91.5%) | 93.0 |
| 35 to 50 years | 8 (8.5%) | 6.0 |
| Total | 94 (100.0%) | 35.0 |
Fertility by Age by Marriage Status in North Auburn
48.9% of women with births (94) in North Auburn are married. The highest percentage of unmarried women with births falls into 20 to 34 years age bracket with 55.8% of them unmarried at the time of birth, while the lowest percentage of unmarried women with births belong to 35 to 50 years age bracket with 0.0% of them unmarried.
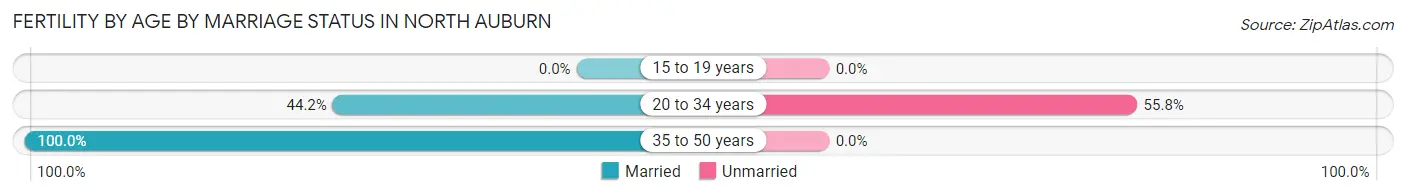
| Age Bracket | Married | Unmarried |
| 15 to 19 years | 0 (0.0%) | 0 (0.0%) |
| 20 to 34 years | 38 (44.2%) | 48 (55.8%) |
| 35 to 50 years | 8 (100.0%) | 0 (0.0%) |
| Total | 46 (48.9%) | 48 (51.1%) |
Fertility by Education in North Auburn
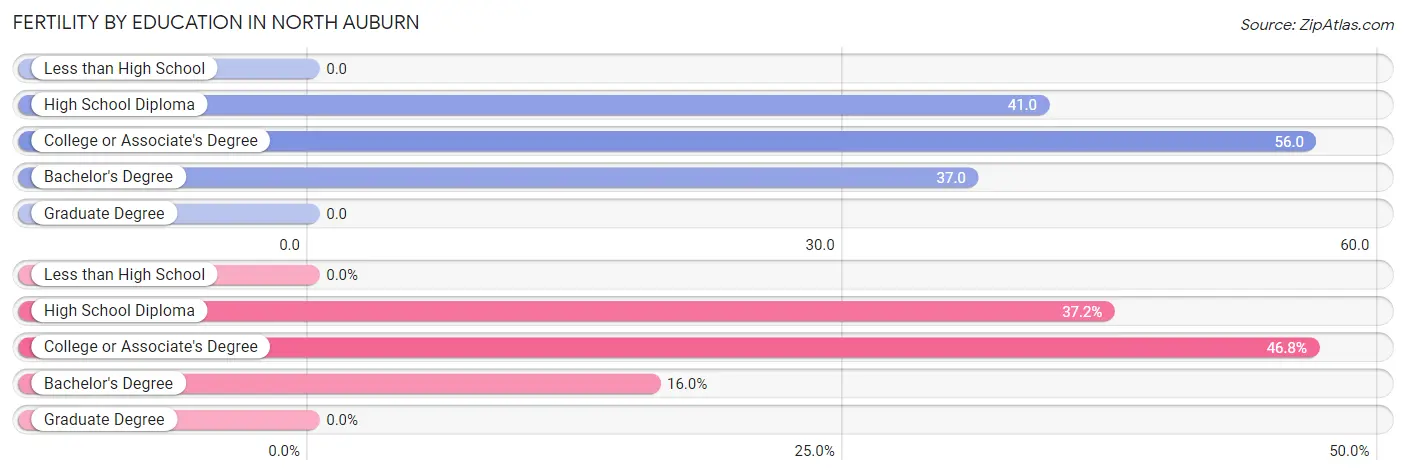
| Educational Attainment | Women with Births | Births / 1,000 Women |
| Less than High School | 0 (0.0%) | 0.0 |
| High School Diploma | 35 (37.2%) | 41.0 |
| College or Associate's Degree | 44 (46.8%) | 56.0 |
| Bachelor's Degree | 15 (16.0%) | 37.0 |
| Graduate Degree | 0 (0.0%) | 0.0 |
| Total | 94 (100.0%) | 35.0 |
Fertility by Education by Marriage Status in North Auburn
51.1% of women with births in North Auburn are unmarried. Women with the educational attainment of bachelor's degree are most likely to be married with 100.0% of them married at childbirth, while women with the educational attainment of college or associate's degree are least likely to be married with 90.9% of them unmarried at childbirth.
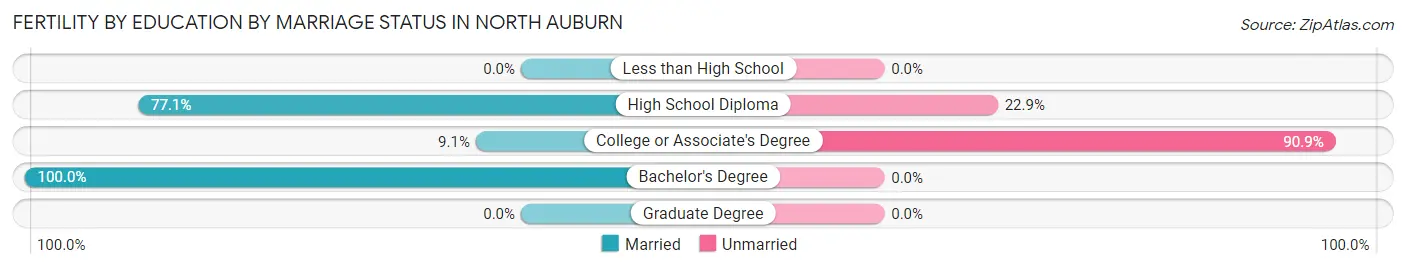
| Educational Attainment | Married | Unmarried |
| Less than High School | 0 (0.0%) | 0 (0.0%) |
| High School Diploma | 27 (77.1%) | 8 (22.9%) |
| College or Associate's Degree | 4 (9.1%) | 40 (90.9%) |
| Bachelor's Degree | 15 (100.0%) | 0 (0.0%) |
| Graduate Degree | 0 (0.0%) | 0 (0.0%) |
| Total | 46 (48.9%) | 48 (51.1%) |
Employment Characteristics in North Auburn
Employment by Class of Employer in North Auburn
Among the 6,071 employed individuals in North Auburn, private company employees (3,856 | 63.5%), local government employees (553 | 9.1%), and self-employed (not incorporated) (492 | 8.1%) make up the most common classes of employment.
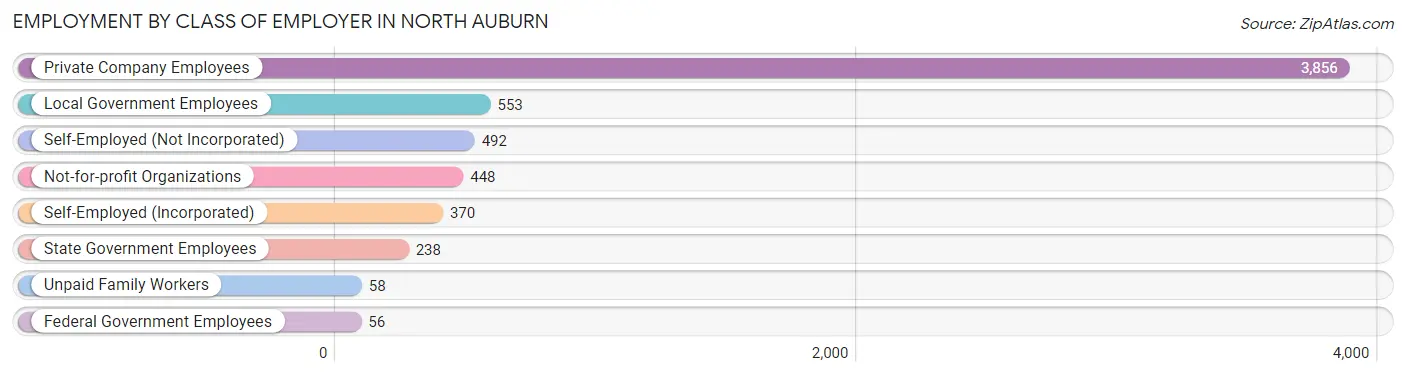
| Employer Class | # Employees | % Employees |
| Private Company Employees | 3,856 | 63.5% |
| Self-Employed (Incorporated) | 370 | 6.1% |
| Self-Employed (Not Incorporated) | 492 | 8.1% |
| Not-for-profit Organizations | 448 | 7.4% |
| Local Government Employees | 553 | 9.1% |
| State Government Employees | 238 | 3.9% |
| Federal Government Employees | 56 | 0.9% |
| Unpaid Family Workers | 58 | 1.0% |
| Total | 6,071 | 100.0% |
Employment Status by Age in North Auburn
According to the labor force statistics for North Auburn, out of the total population over 16 years of age (11,749), 54.0% or 6,344 individuals are in the labor force, with 2.5% or 159 of them unemployed. The age group with the highest labor force participation rate is 20 to 24 years, with 92.5% or 590 individuals in the labor force. Within the labor force, the 60 to 64 years age range has the highest percentage of unemployed individuals, with 9.0% or 46 of them being unemployed.
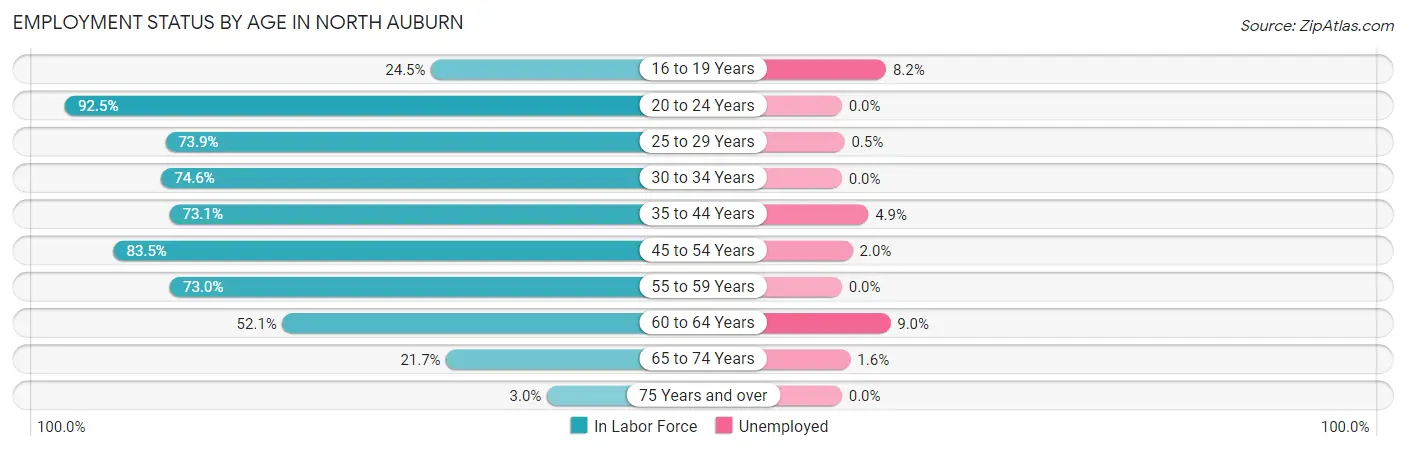
| Age Bracket | In Labor Force | Unemployed |
| 16 to 19 Years | 134 (24.5%) | 11 (8.2%) |
| 20 to 24 Years | 590 (92.5%) | 0 (0.0%) |
| 25 to 29 Years | 593 (73.9%) | 3 (0.5%) |
| 30 to 34 Years | 686 (74.6%) | 0 (0.0%) |
| 35 to 44 Years | 1,265 (73.1%) | 62 (4.9%) |
| 45 to 54 Years | 1,550 (83.5%) | 31 (2.0%) |
| 55 to 59 Years | 588 (73.0%) | 0 (0.0%) |
| 60 to 64 Years | 512 (52.1%) | 46 (9.0%) |
| 65 to 74 Years | 373 (21.7%) | 6 (1.6%) |
| 75 Years and over | 52 (3.0%) | 0 (0.0%) |
| Total | 6,344 (54.0%) | 159 (2.5%) |
Employment Status by Educational Attainment in North Auburn
According to labor force statistics for North Auburn, 73.2% of individuals (5,195) out of the total population between 25 and 64 years of age (7,097) are in the labor force, with 2.7% or 140 of them being unemployed. The group with the highest labor force participation rate are those with the educational attainment of bachelor's degree or higher, with 78.6% or 1,518 individuals in the labor force. Within the labor force, individuals with high school diploma education have the highest percentage of unemployment, with 6.3% or 80 of them being unemployed.
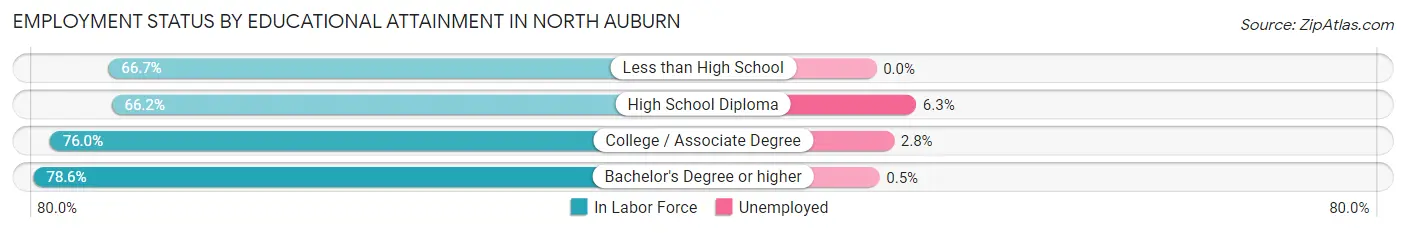
| Educational Attainment | In Labor Force | Unemployed |
| Less than High School | 444 (66.7%) | 0 (0.0%) |
| High School Diploma | 1,273 (66.2%) | 121 (6.3%) |
| College / Associate Degree | 1,959 (76.0%) | 72 (2.8%) |
| Bachelor's Degree or higher | 1,518 (78.6%) | 10 (0.5%) |
| Total | 5,195 (73.2%) | 192 (2.7%) |
Employment Occupations by Sex in North Auburn
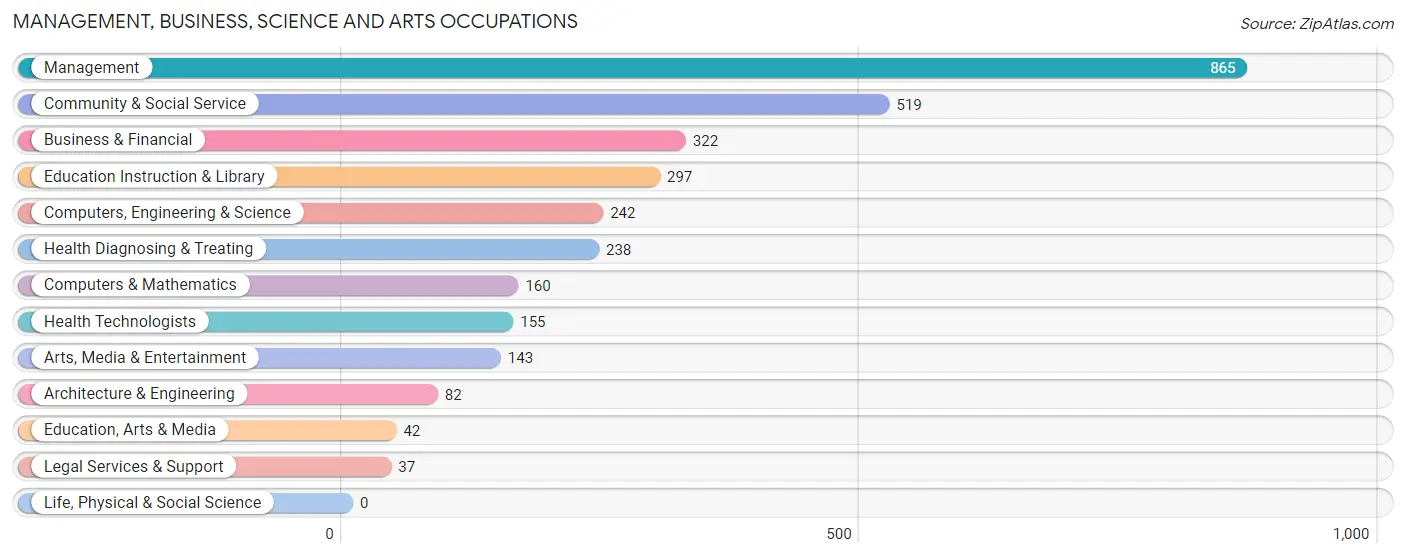
Management, Business, Science and Arts Occupations
The most common Management, Business, Science and Arts occupations in North Auburn are Management (865 | 14.1%), Community & Social Service (519 | 8.4%), Business & Financial (322 | 5.2%), Education Instruction & Library (297 | 4.8%), and Computers, Engineering & Science (242 | 3.9%).
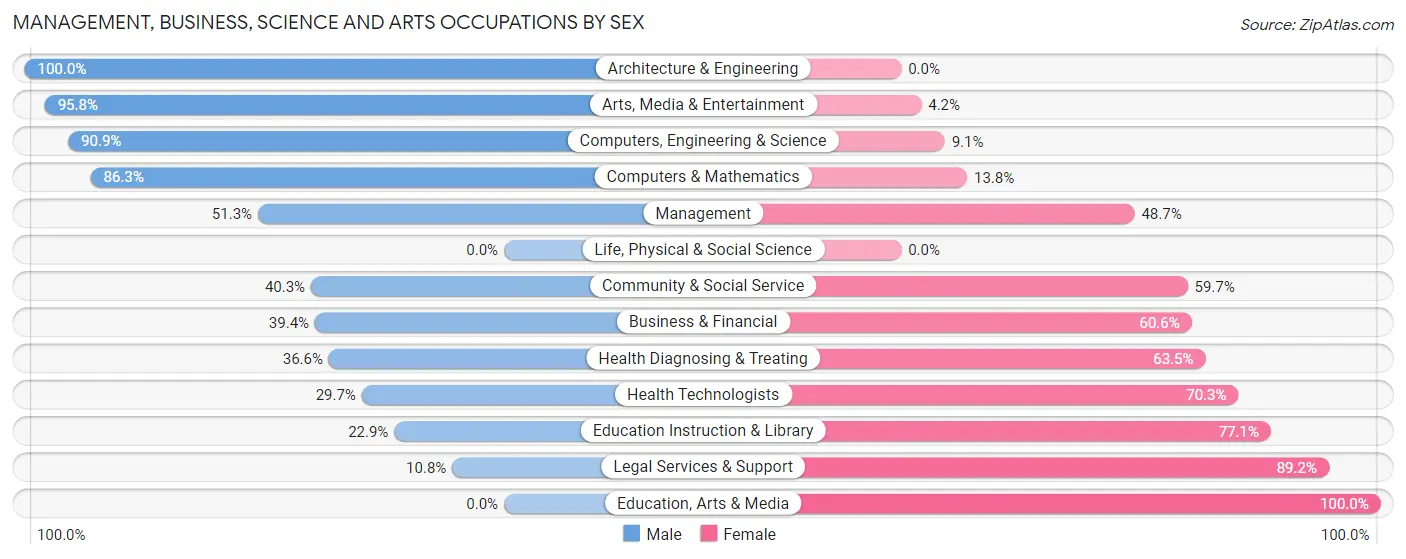
Management, Business, Science and Arts Occupations by Sex
Within the Management, Business, Science and Arts occupations in North Auburn, the most male-oriented occupations are Architecture & Engineering (100.0%), Arts, Media & Entertainment (95.8%), and Computers, Engineering & Science (90.9%), while the most female-oriented occupations are Education, Arts & Media (100.0%), Legal Services & Support (89.2%), and Education Instruction & Library (77.1%).
| Occupation | Male | Female |
| Management | 444 (51.3%) | 421 (48.7%) |
| Business & Financial | 127 (39.4%) | 195 (60.6%) |
| Computers, Engineering & Science | 220 (90.9%) | 22 (9.1%) |
| Computers & Mathematics | 138 (86.3%) | 22 (13.8%) |
| Architecture & Engineering | 82 (100.0%) | 0 (0.0%) |
| Life, Physical & Social Science | 0 (0.0%) | 0 (0.0%) |
| Community & Social Service | 209 (40.3%) | 310 (59.7%) |
| Education, Arts & Media | 0 (0.0%) | 42 (100.0%) |
| Legal Services & Support | 4 (10.8%) | 33 (89.2%) |
| Education Instruction & Library | 68 (22.9%) | 229 (77.1%) |
| Arts, Media & Entertainment | 137 (95.8%) | 6 (4.2%) |
| Health Diagnosing & Treating | 87 (36.5%) | 151 (63.4%) |
| Health Technologists | 46 (29.7%) | 109 (70.3%) |
| Total (Category) | 1,087 (49.7%) | 1,099 (50.3%) |
| Total (Overall) | 3,432 (55.7%) | 2,725 (44.3%) |
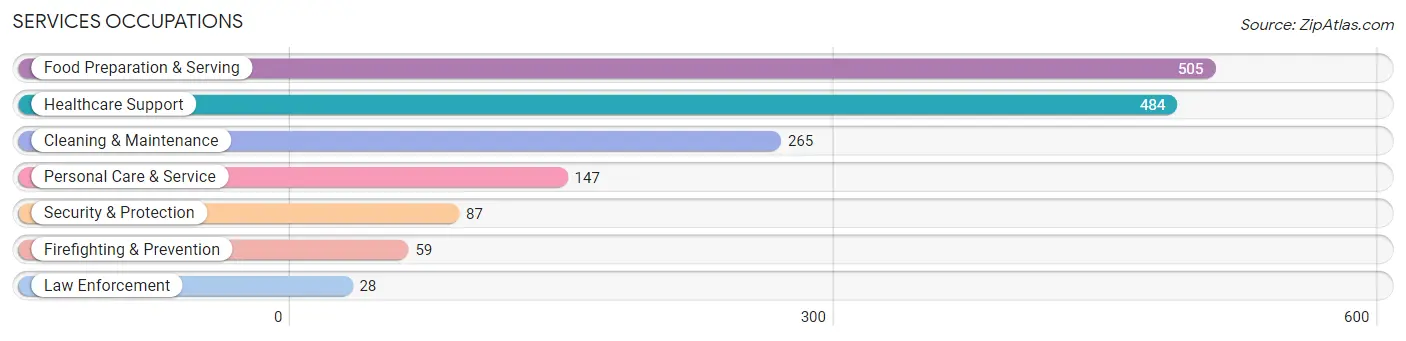
Services Occupations
The most common Services occupations in North Auburn are Food Preparation & Serving (505 | 8.2%), Healthcare Support (484 | 7.9%), Cleaning & Maintenance (265 | 4.3%), Personal Care & Service (147 | 2.4%), and Security & Protection (87 | 1.4%).
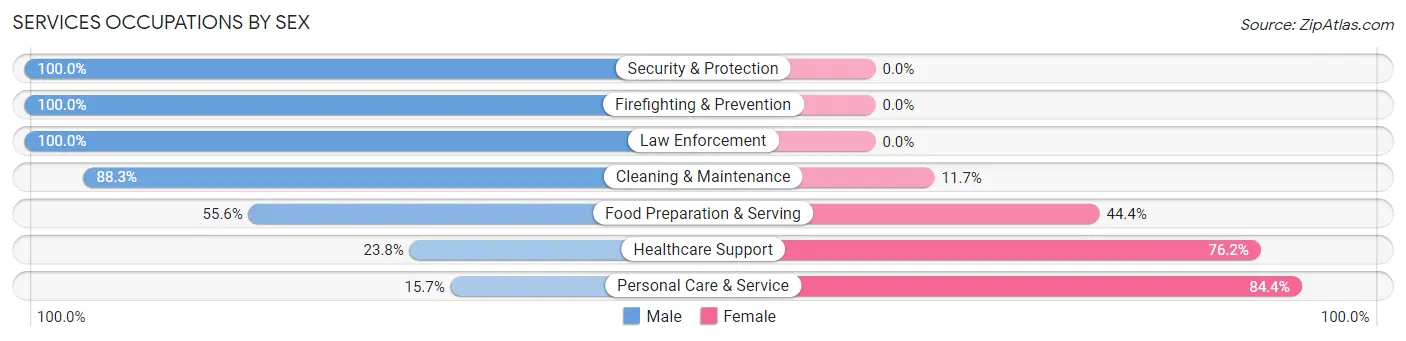
Services Occupations by Sex
Within the Services occupations in North Auburn, the most male-oriented occupations are Security & Protection (100.0%), Firefighting & Prevention (100.0%), and Law Enforcement (100.0%), while the most female-oriented occupations are Personal Care & Service (84.4%), Healthcare Support (76.2%), and Food Preparation & Serving (44.4%).
| Occupation | Male | Female |
| Healthcare Support | 115 (23.8%) | 369 (76.2%) |
| Security & Protection | 87 (100.0%) | 0 (0.0%) |
| Firefighting & Prevention | 59 (100.0%) | 0 (0.0%) |
| Law Enforcement | 28 (100.0%) | 0 (0.0%) |
| Food Preparation & Serving | 281 (55.6%) | 224 (44.4%) |
| Cleaning & Maintenance | 234 (88.3%) | 31 (11.7%) |
| Personal Care & Service | 23 (15.7%) | 124 (84.4%) |
| Total (Category) | 740 (49.7%) | 748 (50.3%) |
| Total (Overall) | 3,432 (55.7%) | 2,725 (44.3%) |
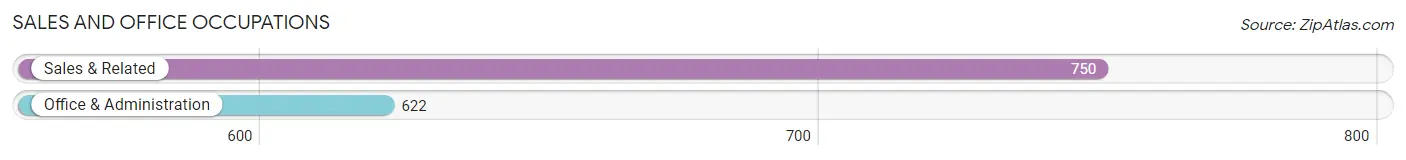
Sales and Office Occupations
The most common Sales and Office occupations in North Auburn are Sales & Related (750 | 12.2%), and Office & Administration (622 | 10.1%).
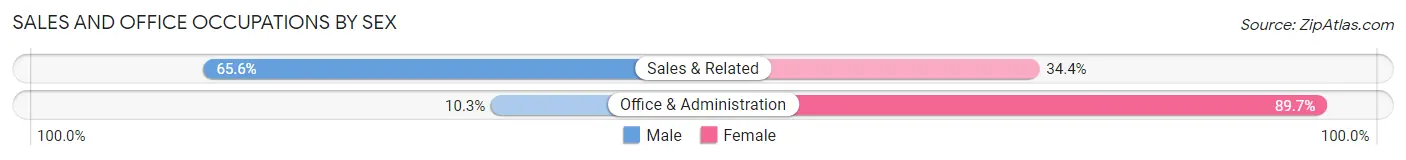
Sales and Office Occupations by Sex
| Occupation | Male | Female |
| Sales & Related | 492 (65.6%) | 258 (34.4%) |
| Office & Administration | 64 (10.3%) | 558 (89.7%) |
| Total (Category) | 556 (40.5%) | 816 (59.5%) |
| Total (Overall) | 3,432 (55.7%) | 2,725 (44.3%) |
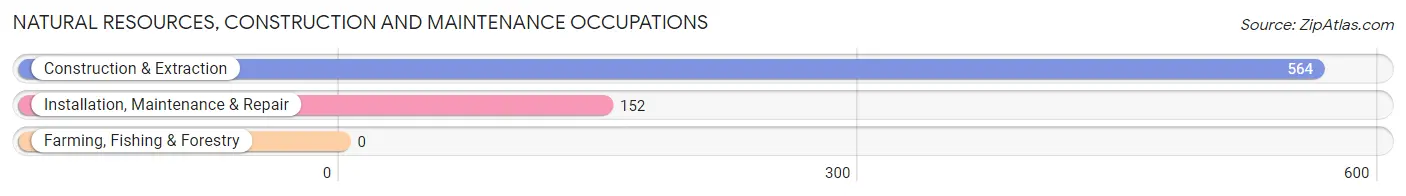
Natural Resources, Construction and Maintenance Occupations
The most common Natural Resources, Construction and Maintenance occupations in North Auburn are Construction & Extraction (564 | 9.2%), and Installation, Maintenance & Repair (152 | 2.5%).
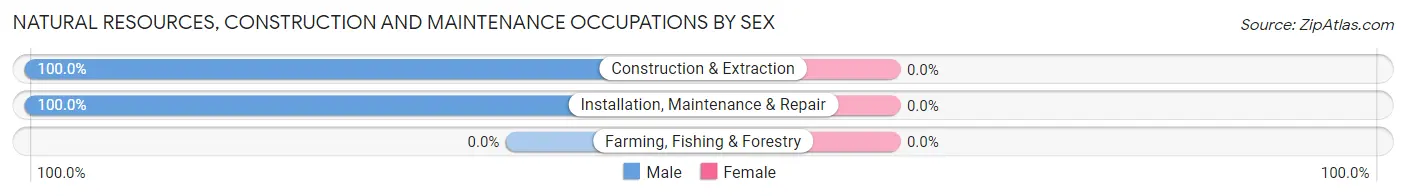
Natural Resources, Construction and Maintenance Occupations by Sex
| Occupation | Male | Female |
| Farming, Fishing & Forestry | 0 (0.0%) | 0 (0.0%) |
| Construction & Extraction | 564 (100.0%) | 0 (0.0%) |
| Installation, Maintenance & Repair | 152 (100.0%) | 0 (0.0%) |
| Total (Category) | 716 (100.0%) | 0 (0.0%) |
| Total (Overall) | 3,432 (55.7%) | 2,725 (44.3%) |
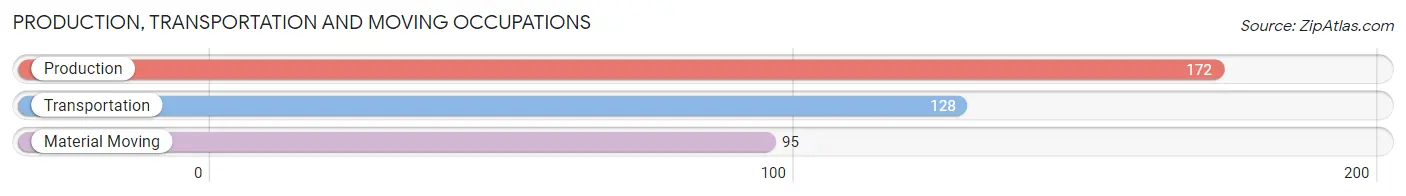
Production, Transportation and Moving Occupations
The most common Production, Transportation and Moving occupations in North Auburn are Production (172 | 2.8%), Transportation (128 | 2.1%), and Material Moving (95 | 1.5%).
Production, Transportation and Moving Occupations by Sex
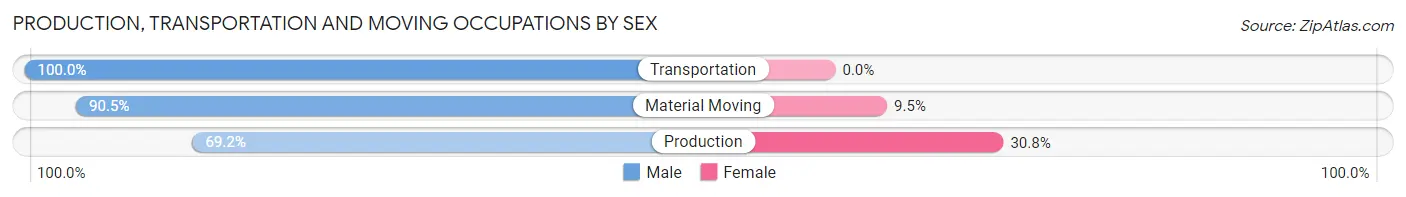
| Occupation | Male | Female |
| Production | 119 (69.2%) | 53 (30.8%) |
| Transportation | 128 (100.0%) | 0 (0.0%) |
| Material Moving | 86 (90.5%) | 9 (9.5%) |
| Total (Category) | 333 (84.3%) | 62 (15.7%) |
| Total (Overall) | 3,432 (55.7%) | 2,725 (44.3%) |
Employment Industries by Sex in North Auburn
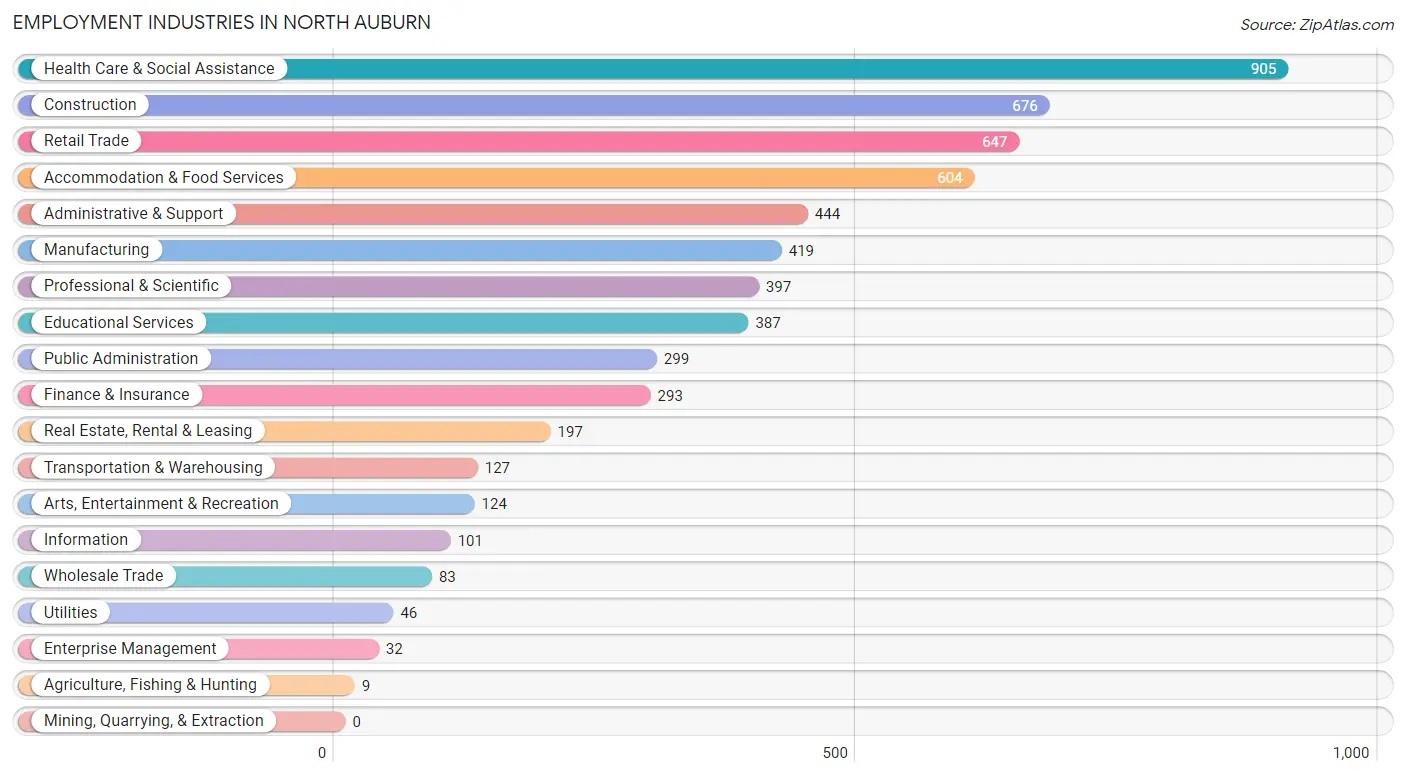
Employment Industries in North Auburn
The major employment industries in North Auburn include Health Care & Social Assistance (905 | 14.7%), Construction (676 | 11.0%), Retail Trade (647 | 10.5%), Accommodation & Food Services (604 | 9.8%), and Administrative & Support (444 | 7.2%).
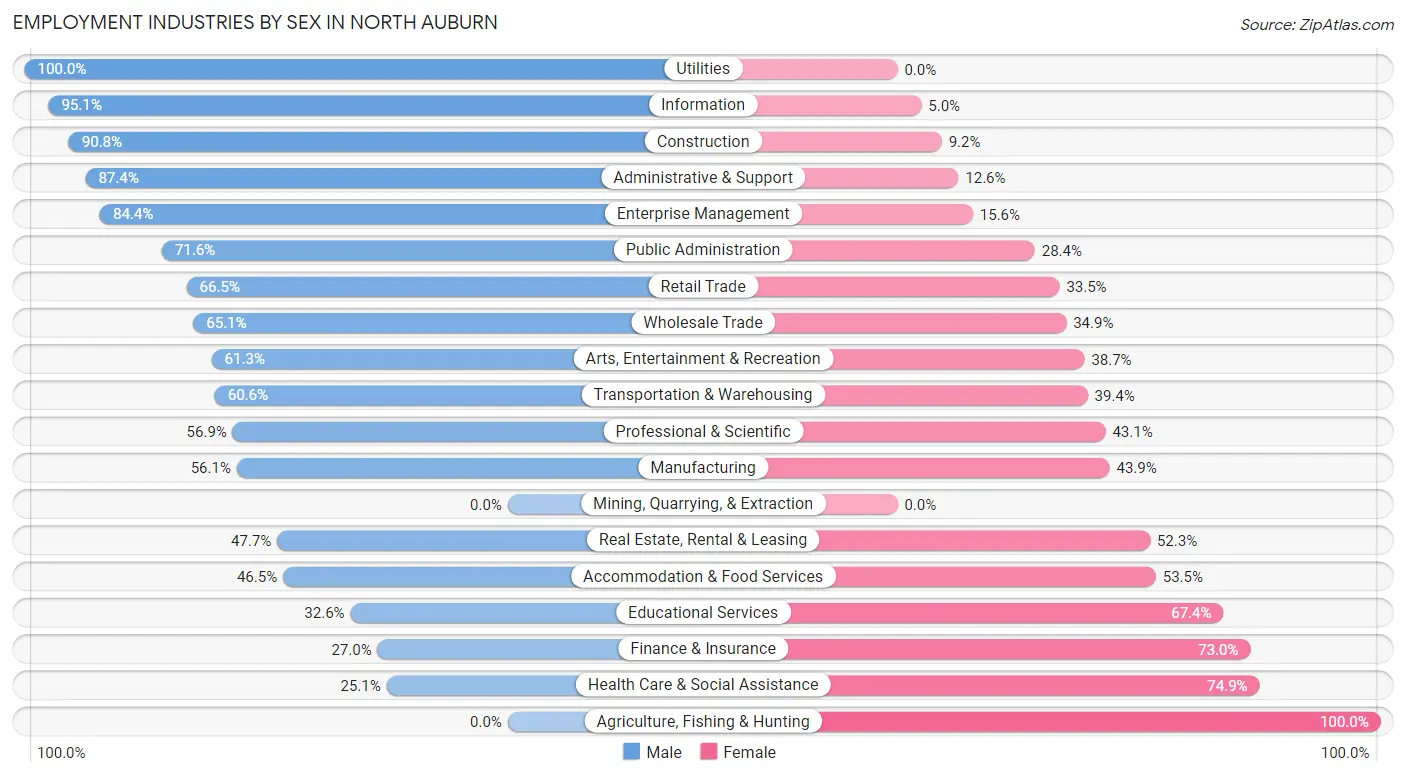
Employment Industries by Sex in North Auburn
The North Auburn industries that see more men than women are Utilities (100.0%), Information (95.1%), and Construction (90.8%), whereas the industries that tend to have a higher number of women are Agriculture, Fishing & Hunting (100.0%), Health Care & Social Assistance (74.9%), and Finance & Insurance (73.0%).
| Industry | Male | Female |
| Agriculture, Fishing & Hunting | 0 (0.0%) | 9 (100.0%) |
| Mining, Quarrying, & Extraction | 0 (0.0%) | 0 (0.0%) |
| Construction | 614 (90.8%) | 62 (9.2%) |
| Manufacturing | 235 (56.1%) | 184 (43.9%) |
| Wholesale Trade | 54 (65.1%) | 29 (34.9%) |
| Retail Trade | 430 (66.5%) | 217 (33.5%) |
| Transportation & Warehousing | 77 (60.6%) | 50 (39.4%) |
| Utilities | 46 (100.0%) | 0 (0.0%) |
| Information | 96 (95.1%) | 5 (5.0%) |
| Finance & Insurance | 79 (27.0%) | 214 (73.0%) |
| Real Estate, Rental & Leasing | 94 (47.7%) | 103 (52.3%) |
| Professional & Scientific | 226 (56.9%) | 171 (43.1%) |
| Enterprise Management | 27 (84.4%) | 5 (15.6%) |
| Administrative & Support | 388 (87.4%) | 56 (12.6%) |
| Educational Services | 126 (32.6%) | 261 (67.4%) |
| Health Care & Social Assistance | 227 (25.1%) | 678 (74.9%) |
| Arts, Entertainment & Recreation | 76 (61.3%) | 48 (38.7%) |
| Accommodation & Food Services | 281 (46.5%) | 323 (53.5%) |
| Public Administration | 214 (71.6%) | 85 (28.4%) |
| Total | 3,432 (55.7%) | 2,725 (44.3%) |
Education in North Auburn
School Enrollment in North Auburn
The most common levels of schooling among the 2,706 students in North Auburn are middle school (697 | 25.8%), elementary school (636 | 23.5%), and high school (633 | 23.4%).
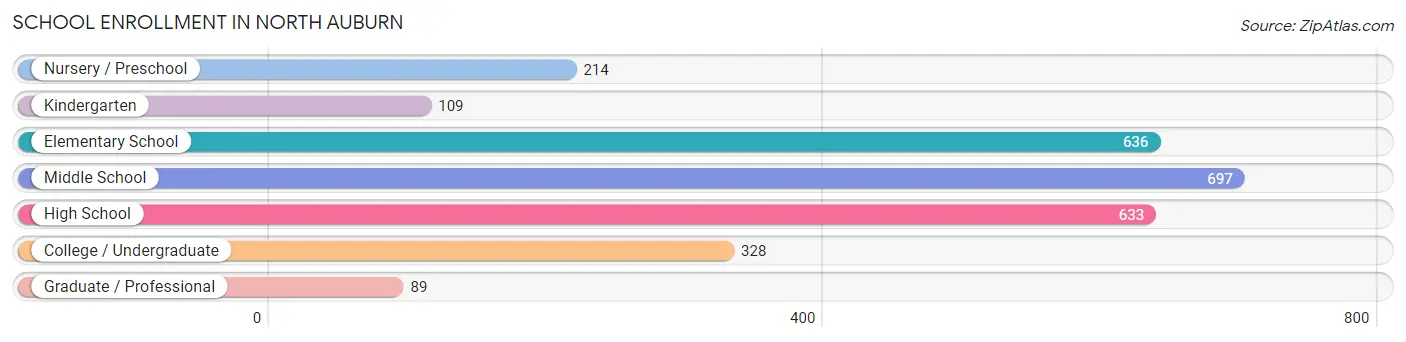
| School Level | # Students | % Students |
| Nursery / Preschool | 214 | 7.9% |
| Kindergarten | 109 | 4.0% |
| Elementary School | 636 | 23.5% |
| Middle School | 697 | 25.8% |
| High School | 633 | 23.4% |
| College / Undergraduate | 328 | 12.1% |
| Graduate / Professional | 89 | 3.3% |
| Total | 2,706 | 100.0% |
School Enrollment by Age by Funding Source in North Auburn
Out of a total of 2,706 students who are enrolled in schools in North Auburn, 306 (11.3%) attend a private institution, while the remaining 2,400 (88.7%) are enrolled in public schools. The age group of 3 to 4 year olds has the highest likelihood of being enrolled in private schools, with 102 (63.0% in the age bracket) enrolled. Conversely, the age group of 10 to 14 year olds has the lowest likelihood of being enrolled in a private school, with 951 (99.6% in the age bracket) attending a public institution.
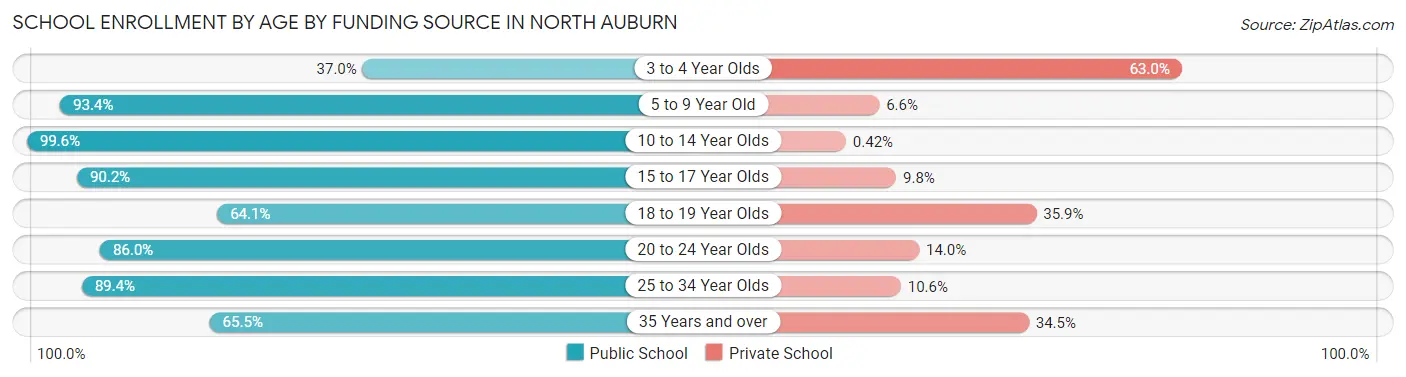
| Age Bracket | Public School | Private School |
| 3 to 4 Year Olds | 60 (37.0%) | 102 (63.0%) |
| 5 to 9 Year Old | 705 (93.4%) | 50 (6.6%) |
| 10 to 14 Year Olds | 951 (99.6%) | 4 (0.4%) |
| 15 to 17 Year Olds | 342 (90.2%) | 37 (9.8%) |
| 18 to 19 Year Olds | 109 (64.1%) | 61 (35.9%) |
| 20 to 24 Year Olds | 49 (86.0%) | 8 (14.0%) |
| 25 to 34 Year Olds | 126 (89.4%) | 15 (10.6%) |
| 35 Years and over | 57 (65.5%) | 30 (34.5%) |
| Total | 2,400 (88.7%) | 306 (11.3%) |
Educational Attainment by Field of Study in North Auburn
Business (621 | 20.6%), arts & humanities (323 | 10.7%), social sciences (279 | 9.2%), liberal arts & history (262 | 8.7%), and communications (231 | 7.6%) are the most common fields of study among 3,021 individuals in North Auburn who have obtained a bachelor's degree or higher.
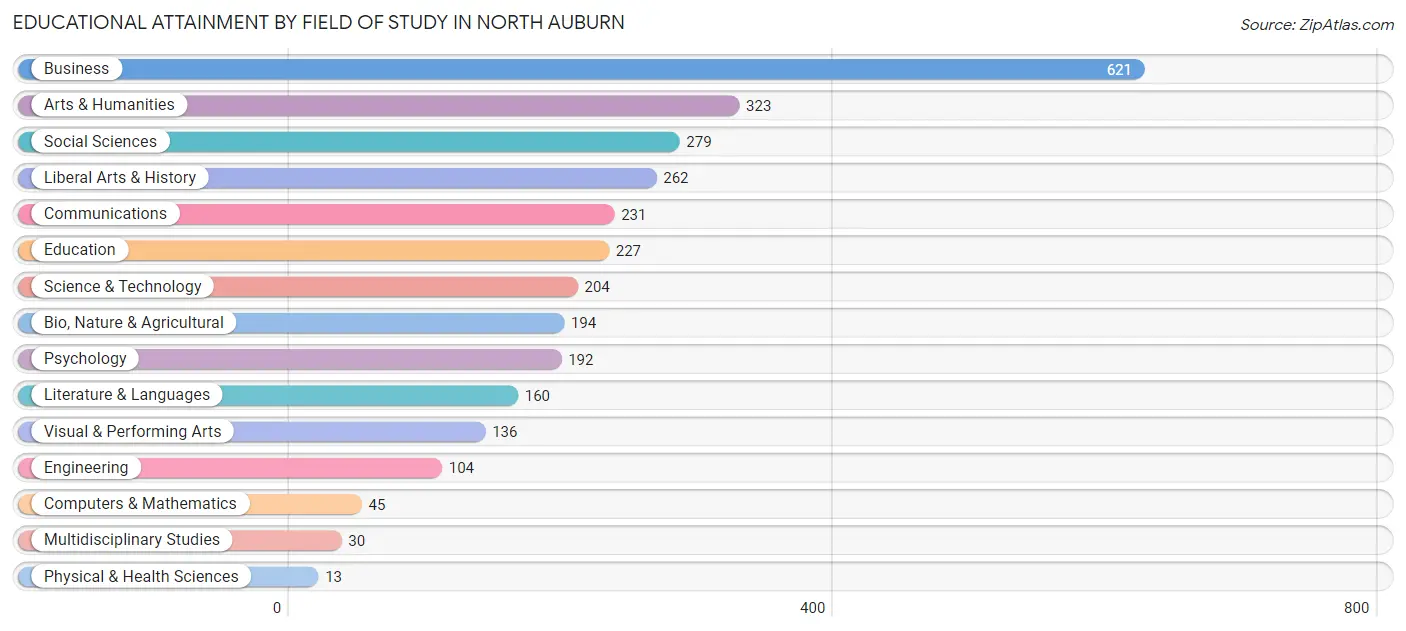
| Field of Study | # Graduates | % Graduates |
| Computers & Mathematics | 45 | 1.5% |
| Bio, Nature & Agricultural | 194 | 6.4% |
| Physical & Health Sciences | 13 | 0.4% |
| Psychology | 192 | 6.4% |
| Social Sciences | 279 | 9.2% |
| Engineering | 104 | 3.4% |
| Multidisciplinary Studies | 30 | 1.0% |
| Science & Technology | 204 | 6.8% |
| Business | 621 | 20.6% |
| Education | 227 | 7.5% |
| Literature & Languages | 160 | 5.3% |
| Liberal Arts & History | 262 | 8.7% |
| Visual & Performing Arts | 136 | 4.5% |
| Communications | 231 | 7.6% |
| Arts & Humanities | 323 | 10.7% |
| Total | 3,021 | 100.0% |
Transportation & Commute in North Auburn
Vehicle Availability by Sex in North Auburn
The most prevalent vehicle ownership categories in North Auburn are males with 2 vehicles (1,604, accounting for 47.0%) and females with 2 vehicles (1,182, making up 60.3%).
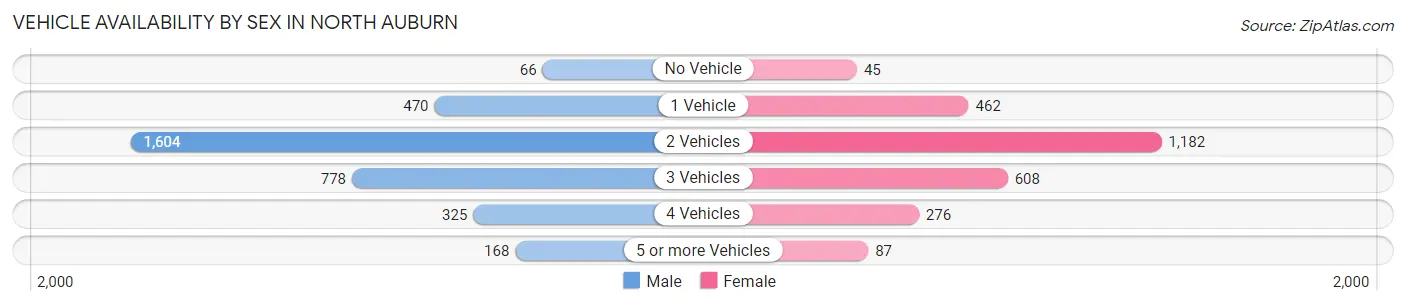
| Vehicles Available | Male | Female |
| No Vehicle | 66 (1.9%) | 45 (1.7%) |
| 1 Vehicle | 470 (13.8%) | 462 (17.4%) |
| 2 Vehicles | 1,604 (47.0%) | 1,182 (44.4%) |
| 3 Vehicles | 778 (22.8%) | 608 (22.9%) |
| 4 Vehicles | 325 (9.5%) | 276 (10.4%) |
| 5 or more Vehicles | 168 (4.9%) | 87 (3.3%) |
| Total | 3,411 (100.0%) | 2,660 (100.0%) |
Commute Time in North Auburn
The most frequently occuring commute durations in North Auburn are 5 to 9 minutes (1,123 commuters, 21.2%), 10 to 14 minutes (878 commuters, 16.6%), and 20 to 24 minutes (579 commuters, 11.0%).
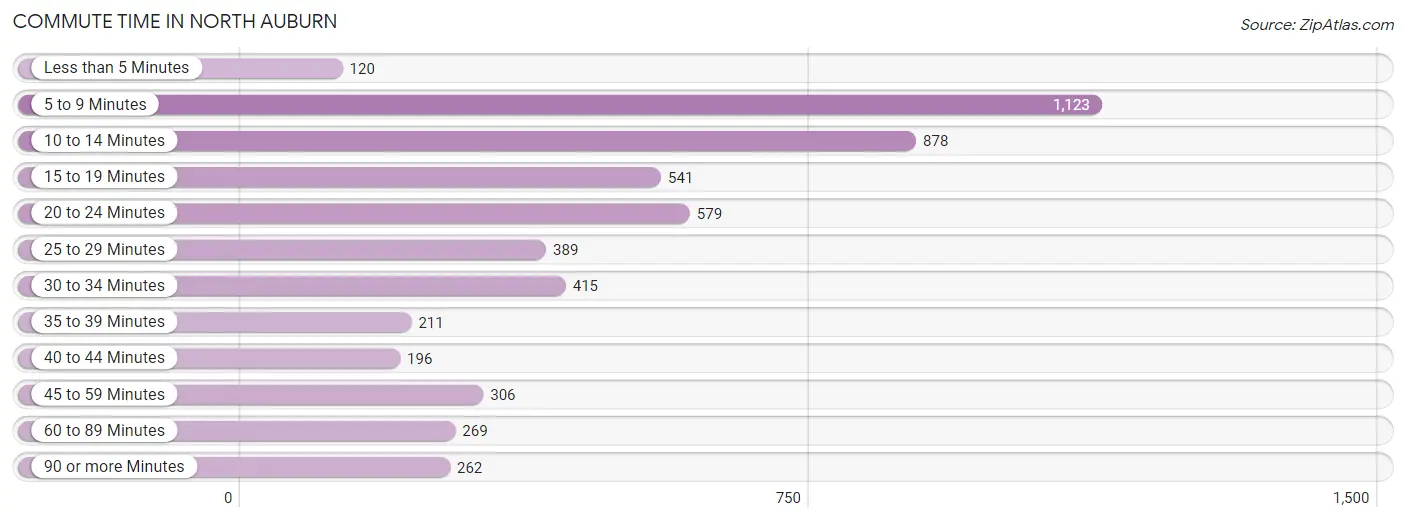
| Commute Time | # Commuters | % Commuters |
| Less than 5 Minutes | 120 | 2.3% |
| 5 to 9 Minutes | 1,123 | 21.2% |
| 10 to 14 Minutes | 878 | 16.6% |
| 15 to 19 Minutes | 541 | 10.2% |
| 20 to 24 Minutes | 579 | 11.0% |
| 25 to 29 Minutes | 389 | 7.3% |
| 30 to 34 Minutes | 415 | 7.9% |
| 35 to 39 Minutes | 211 | 4.0% |
| 40 to 44 Minutes | 196 | 3.7% |
| 45 to 59 Minutes | 306 | 5.8% |
| 60 to 89 Minutes | 269 | 5.1% |
| 90 or more Minutes | 262 | 5.0% |
Commute Time by Sex in North Auburn
The most common commute times in North Auburn are 5 to 9 minutes (595 commuters, 19.7%) for males and 5 to 9 minutes (528 commuters, 23.3%) for females.
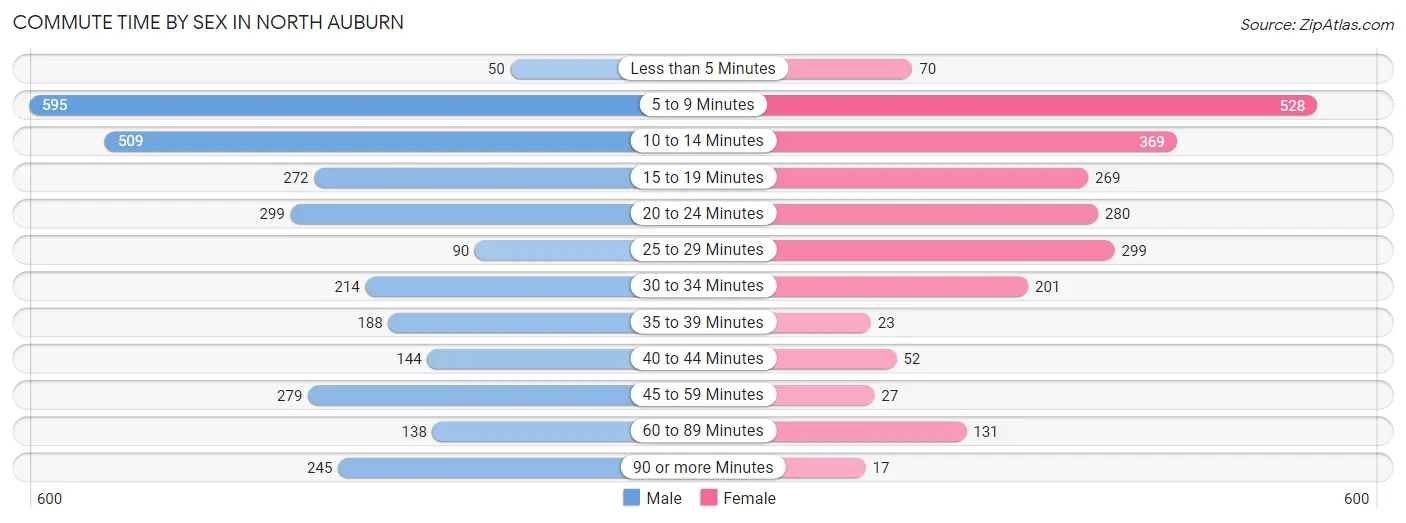
| Commute Time | Male | Female |
| Less than 5 Minutes | 50 (1.7%) | 70 (3.1%) |
| 5 to 9 Minutes | 595 (19.7%) | 528 (23.3%) |
| 10 to 14 Minutes | 509 (16.8%) | 369 (16.3%) |
| 15 to 19 Minutes | 272 (9.0%) | 269 (11.9%) |
| 20 to 24 Minutes | 299 (9.9%) | 280 (12.4%) |
| 25 to 29 Minutes | 90 (3.0%) | 299 (13.2%) |
| 30 to 34 Minutes | 214 (7.1%) | 201 (8.9%) |
| 35 to 39 Minutes | 188 (6.2%) | 23 (1.0%) |
| 40 to 44 Minutes | 144 (4.8%) | 52 (2.3%) |
| 45 to 59 Minutes | 279 (9.2%) | 27 (1.2%) |
| 60 to 89 Minutes | 138 (4.6%) | 131 (5.8%) |
| 90 or more Minutes | 245 (8.1%) | 17 (0.7%) |
Time of Departure to Work by Sex in North Auburn
The most frequent times of departure to work in North Auburn are 6:00 AM to 6:29 AM (580, 19.2%) for males and 7:30 AM to 7:59 AM (374, 16.5%) for females.
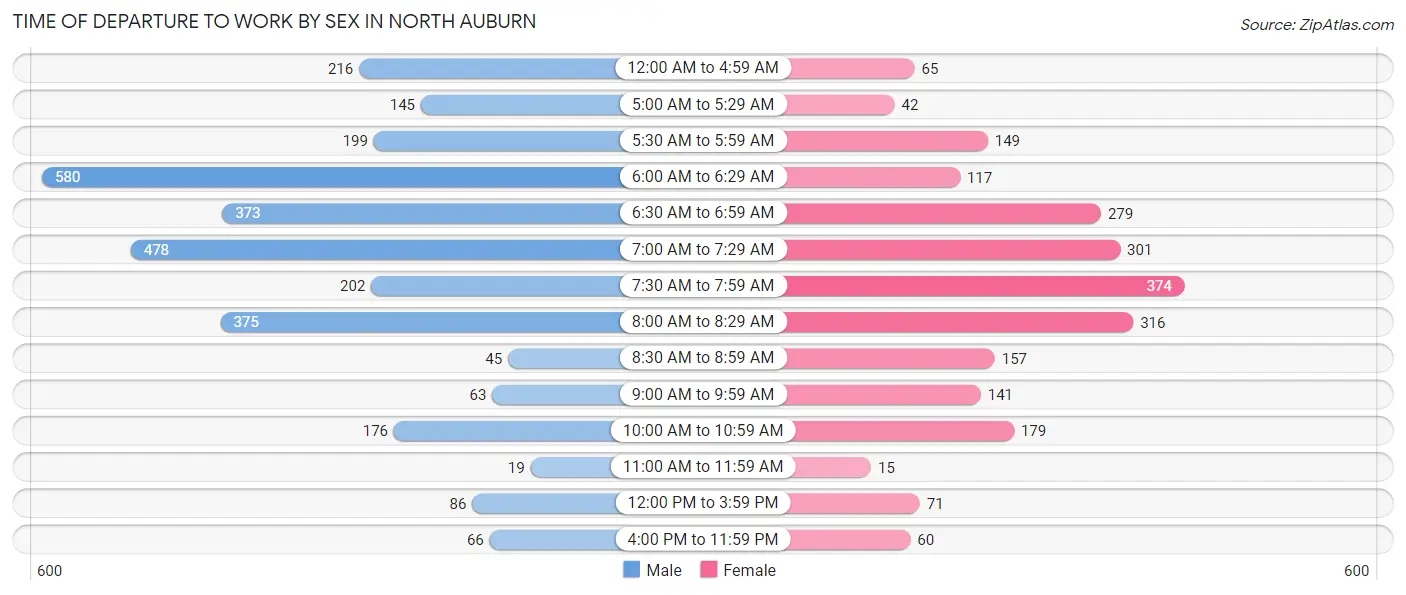
| Time of Departure | Male | Female |
| 12:00 AM to 4:59 AM | 216 (7.1%) | 65 (2.9%) |
| 5:00 AM to 5:29 AM | 145 (4.8%) | 42 (1.8%) |
| 5:30 AM to 5:59 AM | 199 (6.6%) | 149 (6.6%) |
| 6:00 AM to 6:29 AM | 580 (19.2%) | 117 (5.2%) |
| 6:30 AM to 6:59 AM | 373 (12.3%) | 279 (12.3%) |
| 7:00 AM to 7:29 AM | 478 (15.8%) | 301 (13.3%) |
| 7:30 AM to 7:59 AM | 202 (6.7%) | 374 (16.5%) |
| 8:00 AM to 8:29 AM | 375 (12.4%) | 316 (14.0%) |
| 8:30 AM to 8:59 AM | 45 (1.5%) | 157 (6.9%) |
| 9:00 AM to 9:59 AM | 63 (2.1%) | 141 (6.2%) |
| 10:00 AM to 10:59 AM | 176 (5.8%) | 179 (7.9%) |
| 11:00 AM to 11:59 AM | 19 (0.6%) | 15 (0.7%) |
| 12:00 PM to 3:59 PM | 86 (2.8%) | 71 (3.1%) |
| 4:00 PM to 11:59 PM | 66 (2.2%) | 60 (2.6%) |
| Total | 3,023 (100.0%) | 2,266 (100.0%) |
Housing Occupancy in North Auburn
Occupancy by Ownership in North Auburn
Of the total 5,522 dwellings in North Auburn, owner-occupied units account for 3,504 (63.5%), while renter-occupied units make up 2,018 (36.5%).
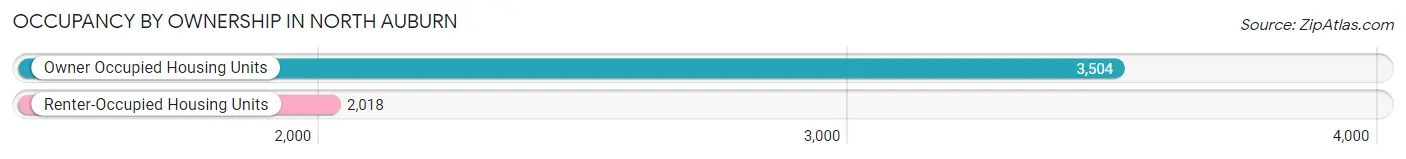
| Occupancy | # Housing Units | % Housing Units |
| Owner Occupied Housing Units | 3,504 | 63.5% |
| Renter-Occupied Housing Units | 2,018 | 36.5% |
| Total Occupied Housing Units | 5,522 | 100.0% |
Occupancy by Household Size in North Auburn
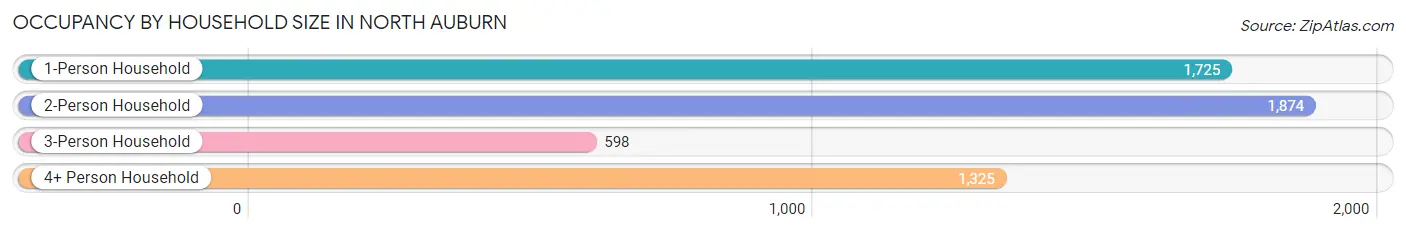
| Household Size | # Housing Units | % Housing Units |
| 1-Person Household | 1,725 | 31.2% |
| 2-Person Household | 1,874 | 33.9% |
| 3-Person Household | 598 | 10.8% |
| 4+ Person Household | 1,325 | 24.0% |
| Total Housing Units | 5,522 | 100.0% |
Occupancy by Ownership by Household Size in North Auburn
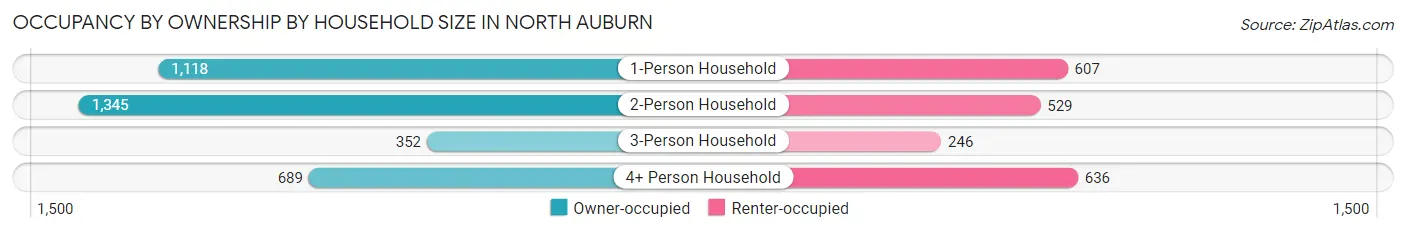
| Household Size | Owner-occupied | Renter-occupied |
| 1-Person Household | 1,118 (64.8%) | 607 (35.2%) |
| 2-Person Household | 1,345 (71.8%) | 529 (28.2%) |
| 3-Person Household | 352 (58.9%) | 246 (41.1%) |
| 4+ Person Household | 689 (52.0%) | 636 (48.0%) |
| Total Housing Units | 3,504 (63.5%) | 2,018 (36.5%) |
Occupancy by Educational Attainment in North Auburn
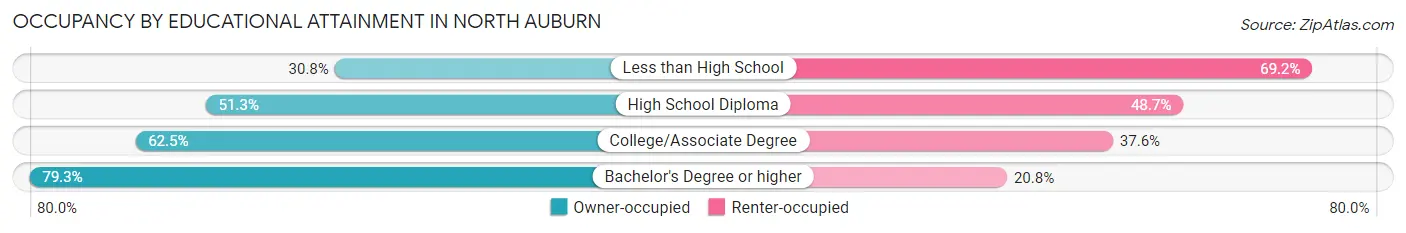
| Household Size | Owner-occupied | Renter-occupied |
| Less than High School | 78 (30.8%) | 175 (69.2%) |
| High School Diploma | 650 (51.3%) | 617 (48.7%) |
| College/Associate Degree | 1,470 (62.5%) | 884 (37.6%) |
| Bachelor's Degree or higher | 1,306 (79.2%) | 342 (20.7%) |
Occupancy by Age of Householder in North Auburn
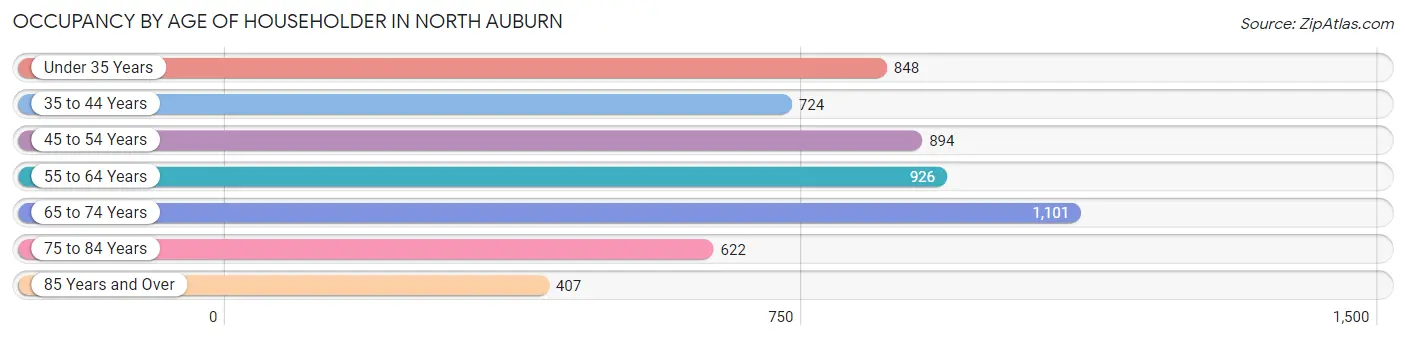
| Age Bracket | # Households | % Households |
| Under 35 Years | 848 | 15.4% |
| 35 to 44 Years | 724 | 13.1% |
| 45 to 54 Years | 894 | 16.2% |
| 55 to 64 Years | 926 | 16.8% |
| 65 to 74 Years | 1,101 | 19.9% |
| 75 to 84 Years | 622 | 11.3% |
| 85 Years and Over | 407 | 7.4% |
| Total | 5,522 | 100.0% |
Housing Finances in North Auburn
Median Income by Occupancy in North Auburn
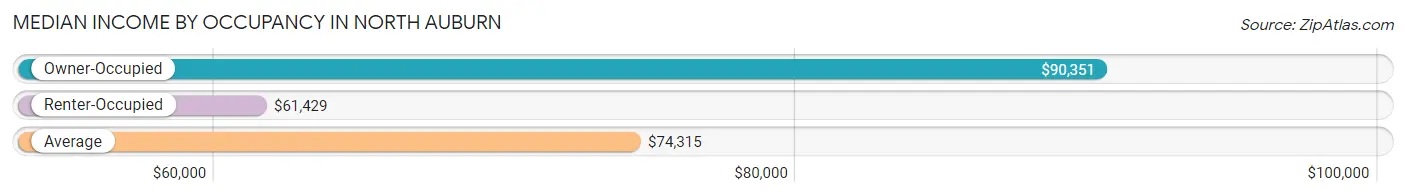
| Occupancy Type | # Households | Median Income |
| Owner-Occupied | 3,504 (63.5%) | $90,351 |
| Renter-Occupied | 2,018 (36.5%) | $61,429 |
| Average | 5,522 (100.0%) | $74,315 |
Occupancy by Householder Income Bracket in North Auburn
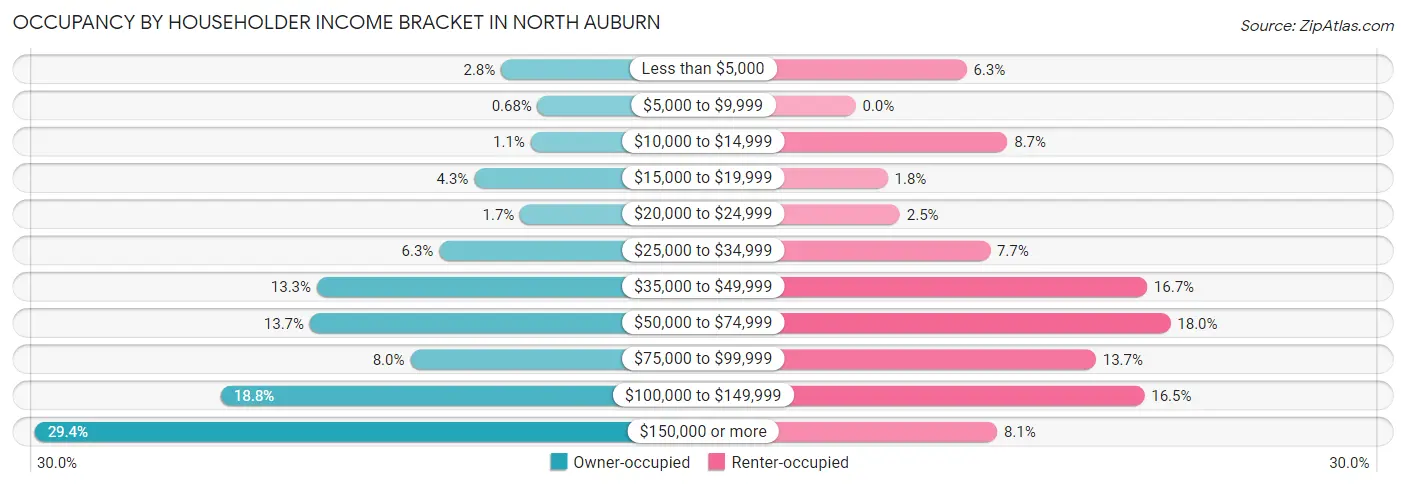
| Income Bracket | Owner-occupied | Renter-occupied |
| Less than $5,000 | 97 (2.8%) | 128 (6.3%) |
| $5,000 to $9,999 | 24 (0.7%) | 0 (0.0%) |
| $10,000 to $14,999 | 38 (1.1%) | 175 (8.7%) |
| $15,000 to $19,999 | 151 (4.3%) | 37 (1.8%) |
| $20,000 to $24,999 | 59 (1.7%) | 51 (2.5%) |
| $25,000 to $34,999 | 221 (6.3%) | 155 (7.7%) |
| $35,000 to $49,999 | 466 (13.3%) | 336 (16.7%) |
| $50,000 to $74,999 | 480 (13.7%) | 363 (18.0%) |
| $75,000 to $99,999 | 279 (8.0%) | 277 (13.7%) |
| $100,000 to $149,999 | 658 (18.8%) | 333 (16.5%) |
| $150,000 or more | 1,031 (29.4%) | 163 (8.1%) |
| Total | 3,504 (100.0%) | 2,018 (100.0%) |
Monthly Housing Cost Tiers in North Auburn
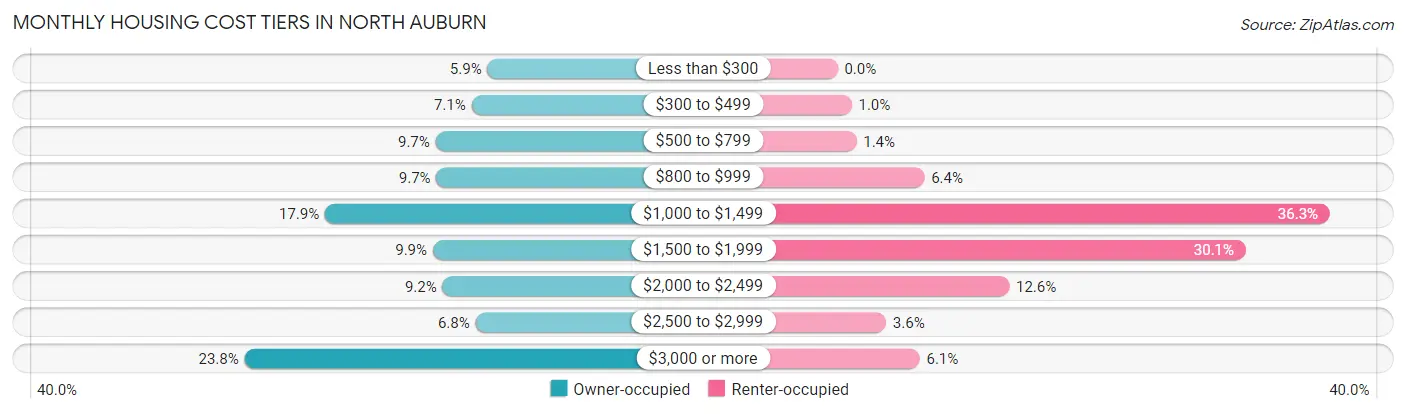
| Monthly Cost | Owner-occupied | Renter-occupied |
| Less than $300 | 207 (5.9%) | 0 (0.0%) |
| $300 to $499 | 248 (7.1%) | 21 (1.0%) |
| $500 to $799 | 341 (9.7%) | 28 (1.4%) |
| $800 to $999 | 339 (9.7%) | 129 (6.4%) |
| $1,000 to $1,499 | 626 (17.9%) | 732 (36.3%) |
| $1,500 to $1,999 | 348 (9.9%) | 607 (30.1%) |
| $2,000 to $2,499 | 323 (9.2%) | 255 (12.6%) |
| $2,500 to $2,999 | 238 (6.8%) | 72 (3.6%) |
| $3,000 or more | 834 (23.8%) | 122 (6.0%) |
| Total | 3,504 (100.0%) | 2,018 (100.0%) |
Physical Housing Characteristics in North Auburn
Housing Structures in North Auburn
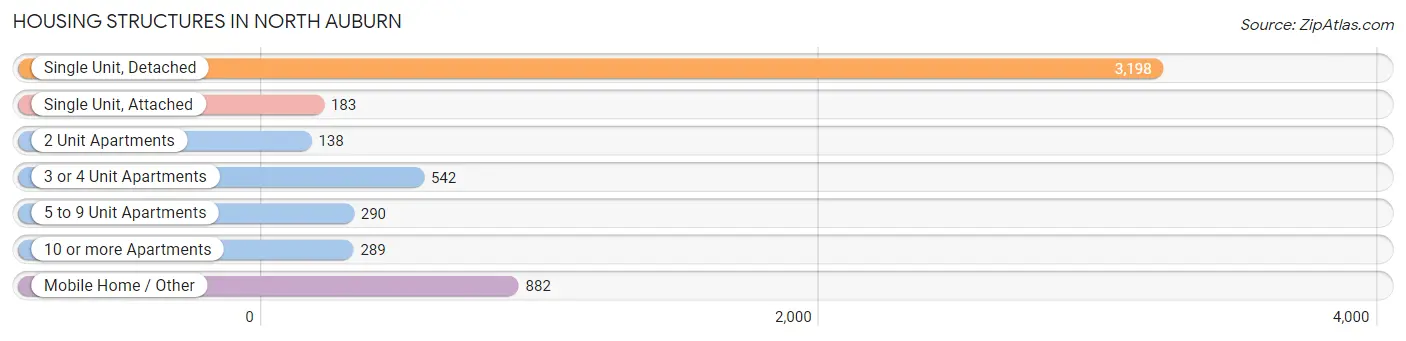
| Structure Type | # Housing Units | % Housing Units |
| Single Unit, Detached | 3,198 | 57.9% |
| Single Unit, Attached | 183 | 3.3% |
| 2 Unit Apartments | 138 | 2.5% |
| 3 or 4 Unit Apartments | 542 | 9.8% |
| 5 to 9 Unit Apartments | 290 | 5.2% |
| 10 or more Apartments | 289 | 5.2% |
| Mobile Home / Other | 882 | 16.0% |
| Total | 5,522 | 100.0% |
Housing Structures by Occupancy in North Auburn
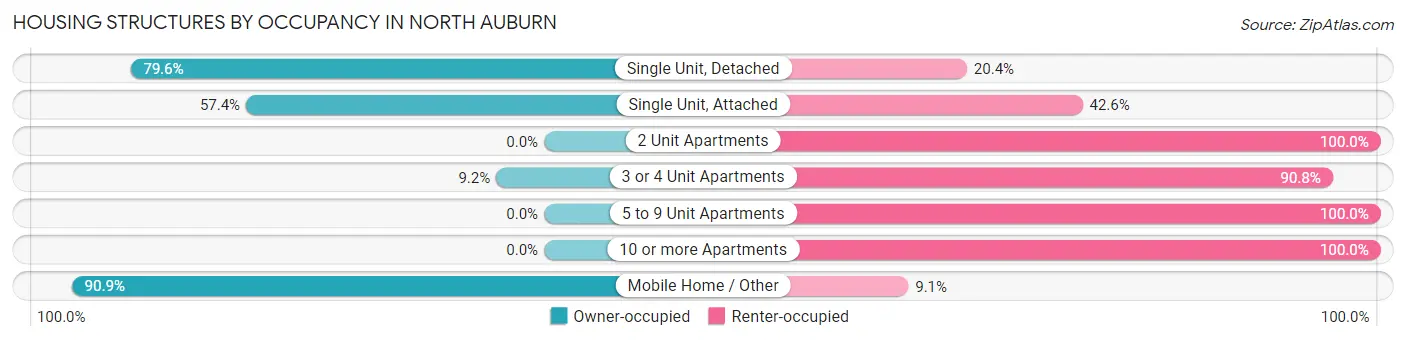
| Structure Type | Owner-occupied | Renter-occupied |
| Single Unit, Detached | 2,547 (79.6%) | 651 (20.4%) |
| Single Unit, Attached | 105 (57.4%) | 78 (42.6%) |
| 2 Unit Apartments | 0 (0.0%) | 138 (100.0%) |
| 3 or 4 Unit Apartments | 50 (9.2%) | 492 (90.8%) |
| 5 to 9 Unit Apartments | 0 (0.0%) | 290 (100.0%) |
| 10 or more Apartments | 0 (0.0%) | 289 (100.0%) |
| Mobile Home / Other | 802 (90.9%) | 80 (9.1%) |
| Total | 3,504 (63.5%) | 2,018 (36.5%) |
Housing Structures by Number of Rooms in North Auburn
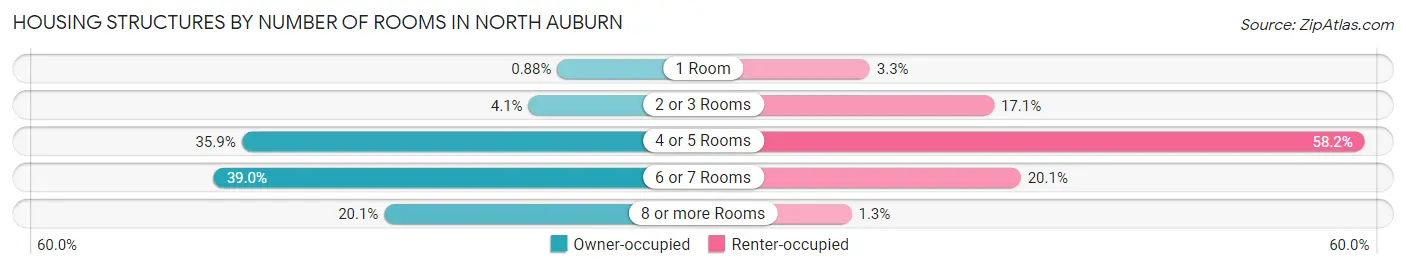
| Number of Rooms | Owner-occupied | Renter-occupied |
| 1 Room | 31 (0.9%) | 67 (3.3%) |
| 2 or 3 Rooms | 143 (4.1%) | 345 (17.1%) |
| 4 or 5 Rooms | 1,259 (35.9%) | 1,175 (58.2%) |
| 6 or 7 Rooms | 1,367 (39.0%) | 405 (20.1%) |
| 8 or more Rooms | 704 (20.1%) | 26 (1.3%) |
| Total | 3,504 (100.0%) | 2,018 (100.0%) |
Housing Structure by Heating Type in North Auburn
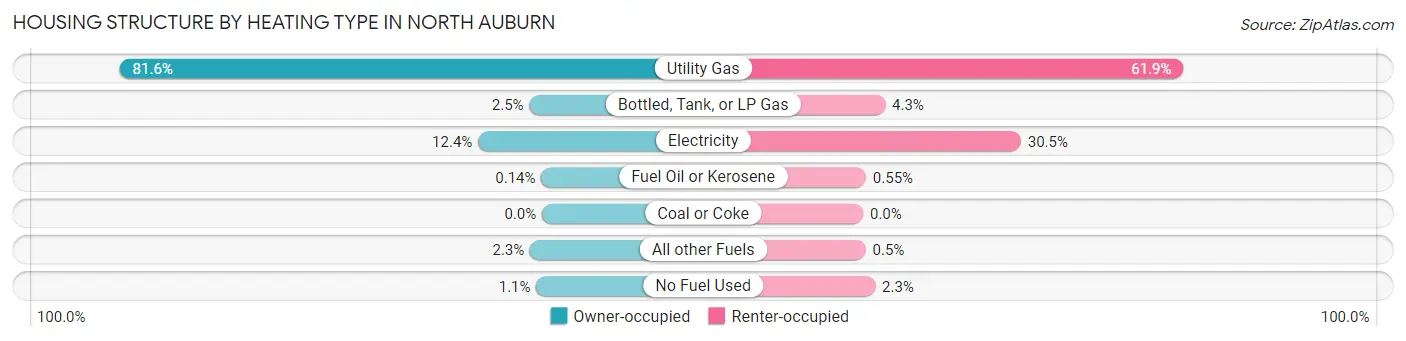
| Heating Type | Owner-occupied | Renter-occupied |
| Utility Gas | 2,860 (81.6%) | 1,249 (61.9%) |
| Bottled, Tank, or LP Gas | 86 (2.5%) | 86 (4.3%) |
| Electricity | 433 (12.4%) | 615 (30.5%) |
| Fuel Oil or Kerosene | 5 (0.1%) | 11 (0.5%) |
| Coal or Coke | 0 (0.0%) | 0 (0.0%) |
| All other Fuels | 81 (2.3%) | 10 (0.5%) |
| No Fuel Used | 39 (1.1%) | 47 (2.3%) |
| Total | 3,504 (100.0%) | 2,018 (100.0%) |
Household Vehicle Usage in North Auburn
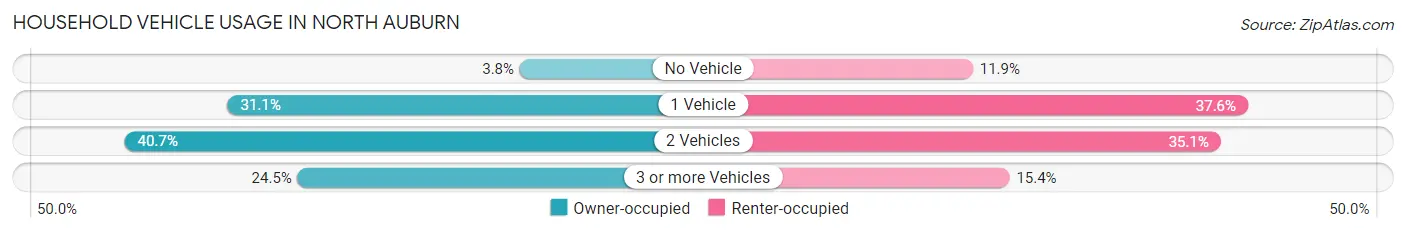
| Vehicles per Household | Owner-occupied | Renter-occupied |
| No Vehicle | 132 (3.8%) | 241 (11.9%) |
| 1 Vehicle | 1,088 (31.0%) | 759 (37.6%) |
| 2 Vehicles | 1,425 (40.7%) | 708 (35.1%) |
| 3 or more Vehicles | 859 (24.5%) | 310 (15.4%) |
| Total | 3,504 (100.0%) | 2,018 (100.0%) |
Real Estate & Mortgages in North Auburn
Real Estate and Mortgage Overview in North Auburn
| Characteristic | Without Mortgage | With Mortgage |
| Housing Units | 1,502 | 2,002 |
| Median Property Value | $183,300 | $564,000 |
| Median Household Income | $50,893 | $840 |
| Monthly Housing Costs | $811 | $834 |
| Real Estate Taxes | $1,944 | $23 |
Property Value by Mortgage Status in North Auburn
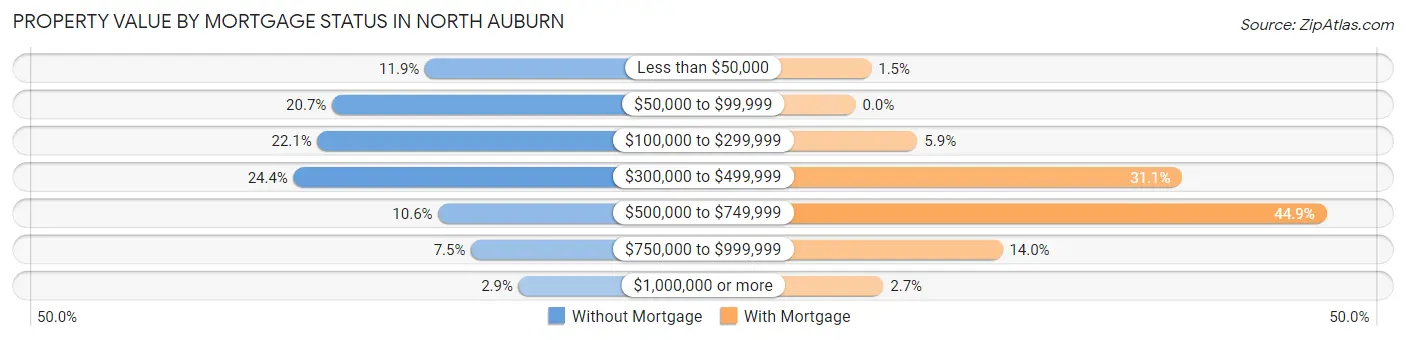
| Property Value | Without Mortgage | With Mortgage |
| Less than $50,000 | 178 (11.8%) | 30 (1.5%) |
| $50,000 to $99,999 | 311 (20.7%) | 0 (0.0%) |
| $100,000 to $299,999 | 332 (22.1%) | 118 (5.9%) |
| $300,000 to $499,999 | 366 (24.4%) | 623 (31.1%) |
| $500,000 to $749,999 | 159 (10.6%) | 898 (44.9%) |
| $750,000 to $999,999 | 112 (7.5%) | 280 (14.0%) |
| $1,000,000 or more | 44 (2.9%) | 53 (2.6%) |
| Total | 1,502 (100.0%) | 2,002 (100.0%) |
Household Income by Mortgage Status in North Auburn
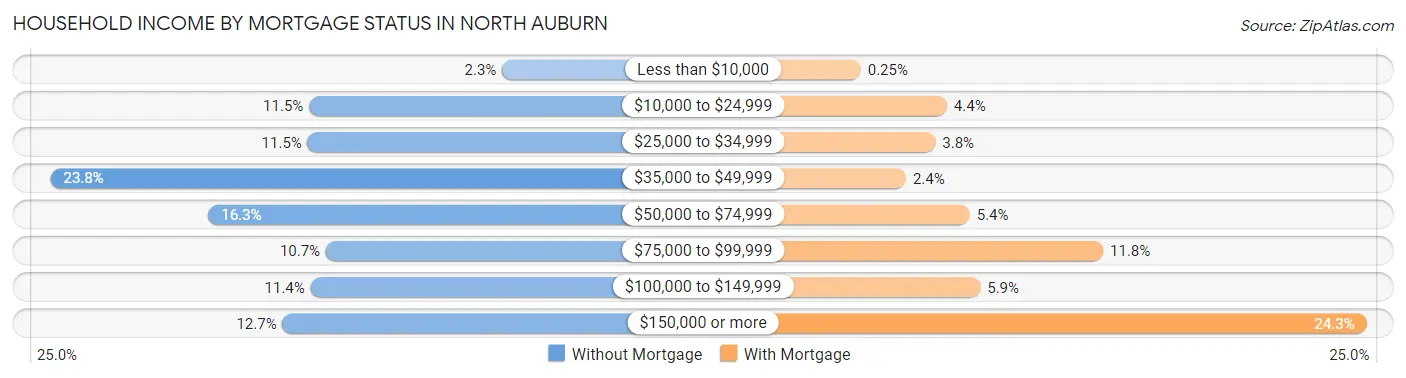
| Household Income | Without Mortgage | With Mortgage |
| Less than $10,000 | 34 (2.3%) | 5 (0.3%) |
| $10,000 to $24,999 | 172 (11.5%) | 87 (4.3%) |
| $25,000 to $34,999 | 173 (11.5%) | 76 (3.8%) |
| $35,000 to $49,999 | 357 (23.8%) | 48 (2.4%) |
| $50,000 to $74,999 | 244 (16.3%) | 109 (5.4%) |
| $75,000 to $99,999 | 160 (10.6%) | 236 (11.8%) |
| $100,000 to $149,999 | 171 (11.4%) | 119 (5.9%) |
| $150,000 or more | 191 (12.7%) | 487 (24.3%) |
| Total | 1,502 (100.0%) | 2,002 (100.0%) |
Property Value to Household Income Ratio in North Auburn
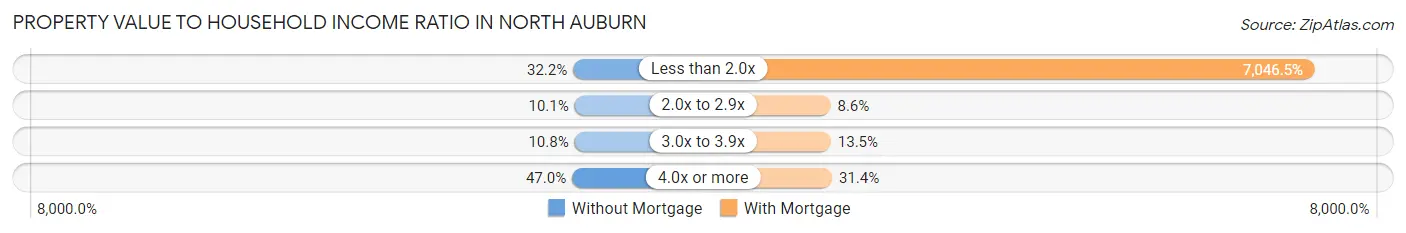
| Value-to-Income Ratio | Without Mortgage | With Mortgage |
| Less than 2.0x | 483 (32.2%) | 141,071 (7,046.5%) |
| 2.0x to 2.9x | 151 (10.1%) | 173 (8.6%) |
| 3.0x to 3.9x | 162 (10.8%) | 271 (13.5%) |
| 4.0x or more | 706 (47.0%) | 628 (31.4%) |
| Total | 1,502 (100.0%) | 2,002 (100.0%) |
Real Estate Taxes by Mortgage Status in North Auburn
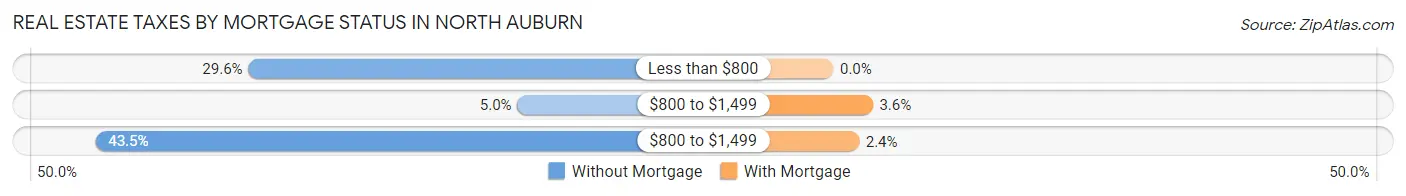
| Property Taxes | Without Mortgage | With Mortgage |
| Less than $800 | 444 (29.6%) | 0 (0.0%) |
| $800 to $1,499 | 75 (5.0%) | 72 (3.6%) |
| $800 to $1,499 | 654 (43.5%) | 47 (2.4%) |
| Total | 1,502 (100.0%) | 2,002 (100.0%) |
Health & Disability in North Auburn
Health Insurance Coverage by Age in North Auburn
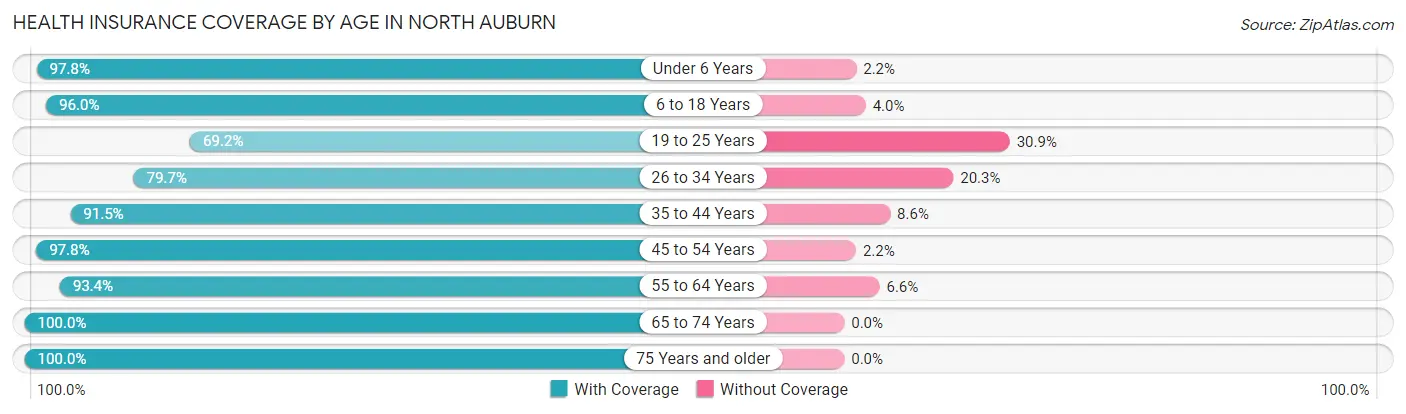
| Age Bracket | With Coverage | Without Coverage |
| Under 6 Years | 921 (97.8%) | 21 (2.2%) |
| 6 to 18 Years | 2,063 (96.0%) | 86 (4.0%) |
| 19 to 25 Years | 547 (69.2%) | 244 (30.8%) |
| 26 to 34 Years | 1,176 (79.7%) | 300 (20.3%) |
| 35 to 44 Years | 1,466 (91.4%) | 137 (8.6%) |
| 45 to 54 Years | 1,751 (97.8%) | 39 (2.2%) |
| 55 to 64 Years | 1,649 (93.4%) | 116 (6.6%) |
| 65 to 74 Years | 1,624 (100.0%) | 0 (0.0%) |
| 75 Years and older | 1,611 (100.0%) | 0 (0.0%) |
| Total | 12,808 (93.1%) | 943 (6.9%) |
Health Insurance Coverage by Citizenship Status in North Auburn
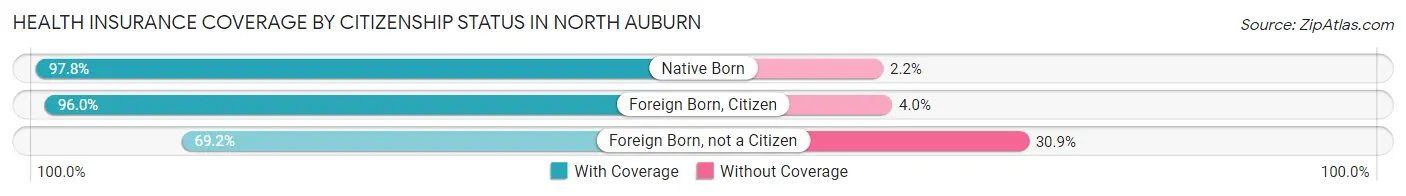
| Citizenship Status | With Coverage | Without Coverage |
| Native Born | 921 (97.8%) | 21 (2.2%) |
| Foreign Born, Citizen | 2,063 (96.0%) | 86 (4.0%) |
| Foreign Born, not a Citizen | 547 (69.2%) | 244 (30.8%) |
Health Insurance Coverage by Household Income in North Auburn
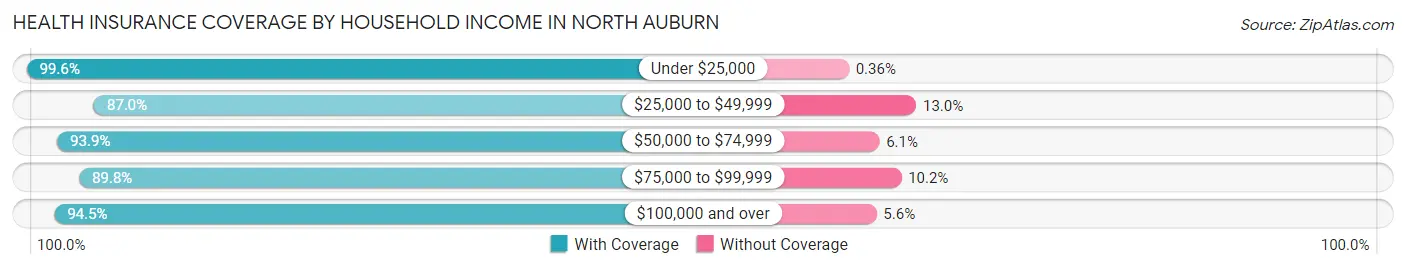
| Household Income | With Coverage | Without Coverage |
| Under $25,000 | 1,108 (99.6%) | 4 (0.4%) |
| $25,000 to $49,999 | 2,038 (87.0%) | 304 (13.0%) |
| $50,000 to $74,999 | 1,853 (93.9%) | 120 (6.1%) |
| $75,000 to $99,999 | 1,128 (89.8%) | 128 (10.2%) |
| $100,000 and over | 6,346 (94.5%) | 373 (5.6%) |
Public vs Private Health Insurance Coverage by Age in North Auburn
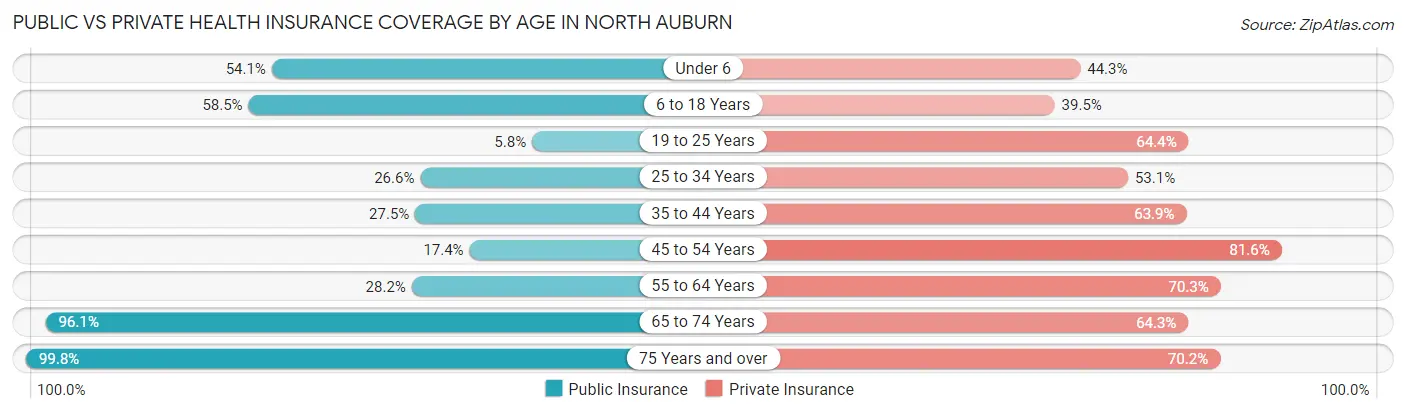
| Age Bracket | Public Insurance | Private Insurance |
| Under 6 | 510 (54.1%) | 417 (44.3%) |
| 6 to 18 Years | 1,256 (58.5%) | 849 (39.5%) |
| 19 to 25 Years | 46 (5.8%) | 509 (64.3%) |
| 25 to 34 Years | 392 (26.6%) | 784 (53.1%) |
| 35 to 44 Years | 441 (27.5%) | 1,025 (63.9%) |
| 45 to 54 Years | 312 (17.4%) | 1,461 (81.6%) |
| 55 to 64 Years | 497 (28.2%) | 1,241 (70.3%) |
| 65 to 74 Years | 1,561 (96.1%) | 1,044 (64.3%) |
| 75 Years and over | 1,607 (99.8%) | 1,131 (70.2%) |
| Total | 6,622 (48.2%) | 8,461 (61.5%) |
Disability Status by Sex by Age in North Auburn
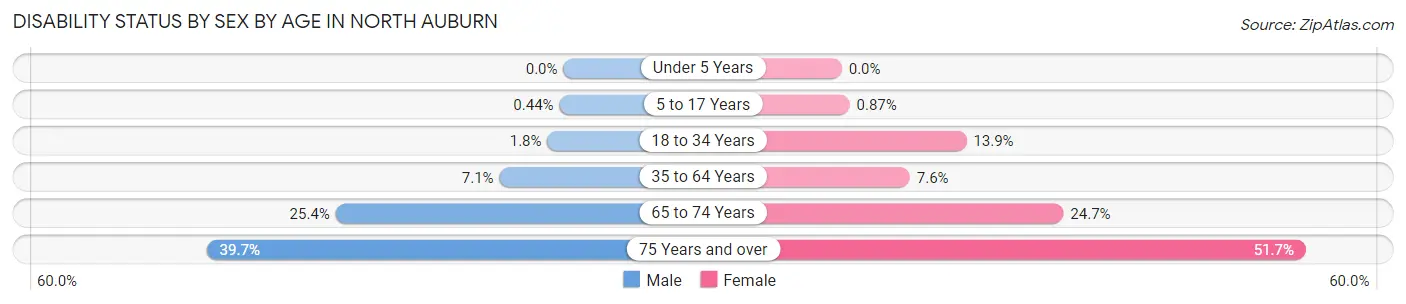
| Age Bracket | Male | Female |
| Under 5 Years | 0 (0.0%) | 0 (0.0%) |
| 5 to 17 Years | 5 (0.4%) | 9 (0.9%) |
| 18 to 34 Years | 24 (1.8%) | 147 (13.9%) |
| 35 to 64 Years | 186 (7.1%) | 193 (7.6%) |
| 65 to 74 Years | 192 (25.4%) | 214 (24.7%) |
| 75 Years and over | 201 (39.7%) | 571 (51.7%) |
Disability Class by Sex by Age in North Auburn
Disability Class: Hearing Difficulty
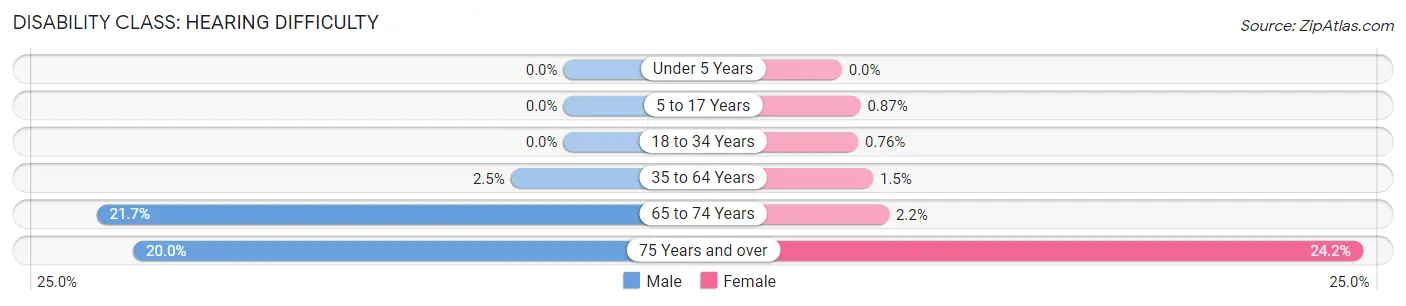
| Age Bracket | Male | Female |
| Under 5 Years | 0 (0.0%) | 0 (0.0%) |
| 5 to 17 Years | 0 (0.0%) | 9 (0.9%) |
| 18 to 34 Years | 0 (0.0%) | 8 (0.8%) |
| 35 to 64 Years | 64 (2.5%) | 37 (1.5%) |
| 65 to 74 Years | 164 (21.7%) | 19 (2.2%) |
| 75 Years and over | 101 (20.0%) | 267 (24.2%) |
Disability Class: Vision Difficulty
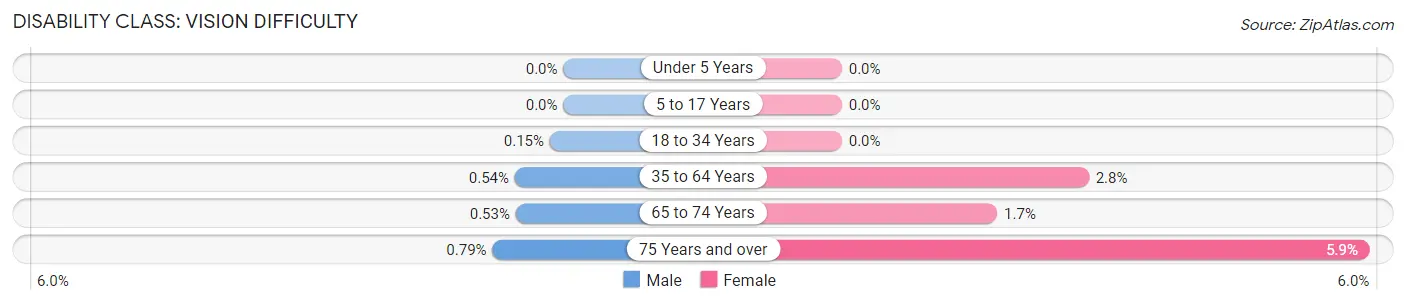
| Age Bracket | Male | Female |
| Under 5 Years | 0 (0.0%) | 0 (0.0%) |
| 5 to 17 Years | 0 (0.0%) | 0 (0.0%) |
| 18 to 34 Years | 2 (0.2%) | 0 (0.0%) |
| 35 to 64 Years | 14 (0.5%) | 70 (2.8%) |
| 65 to 74 Years | 4 (0.5%) | 15 (1.7%) |
| 75 Years and over | 4 (0.8%) | 65 (5.9%) |
Disability Class: Cognitive Difficulty
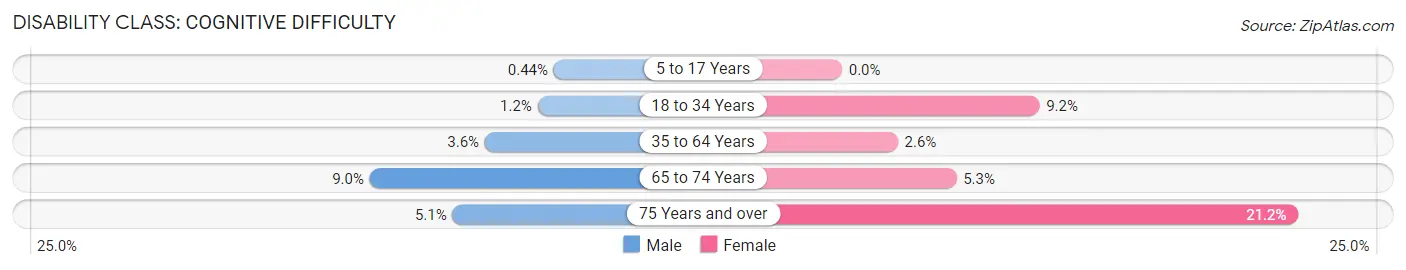
| Age Bracket | Male | Female |
| 5 to 17 Years | 5 (0.4%) | 0 (0.0%) |
| 18 to 34 Years | 16 (1.2%) | 97 (9.2%) |
| 35 to 64 Years | 95 (3.6%) | 66 (2.6%) |
| 65 to 74 Years | 68 (9.0%) | 46 (5.3%) |
| 75 Years and over | 26 (5.1%) | 234 (21.2%) |
Disability Class: Ambulatory Difficulty
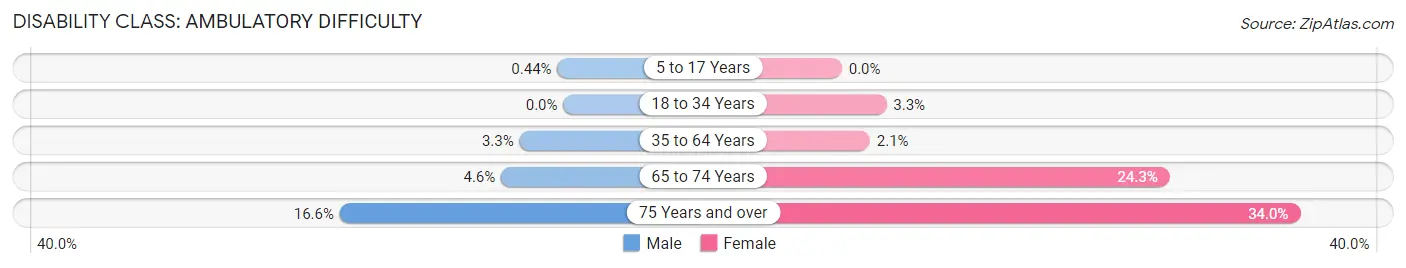
| Age Bracket | Male | Female |
| 5 to 17 Years | 5 (0.4%) | 0 (0.0%) |
| 18 to 34 Years | 0 (0.0%) | 35 (3.3%) |
| 35 to 64 Years | 85 (3.3%) | 53 (2.1%) |
| 65 to 74 Years | 35 (4.6%) | 211 (24.3%) |
| 75 Years and over | 84 (16.6%) | 376 (34.0%) |
Disability Class: Self-Care Difficulty
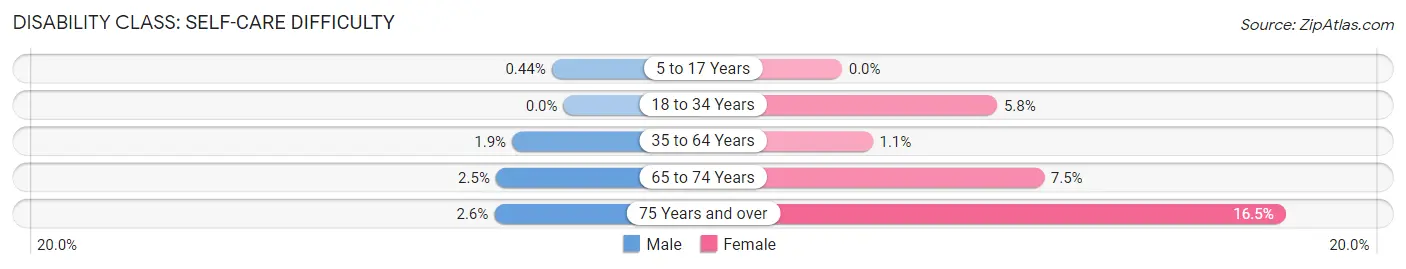
| Age Bracket | Male | Female |
| 5 to 17 Years | 5 (0.4%) | 0 (0.0%) |
| 18 to 34 Years | 0 (0.0%) | 61 (5.8%) |
| 35 to 64 Years | 50 (1.9%) | 29 (1.1%) |
| 65 to 74 Years | 19 (2.5%) | 65 (7.5%) |
| 75 Years and over | 13 (2.6%) | 182 (16.5%) |
Technology Access in North Auburn
Computing Device Access in North Auburn
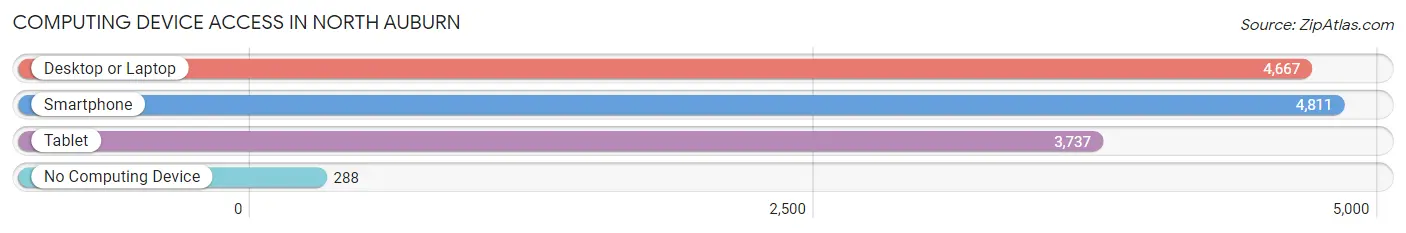
| Device Type | # Households | % Households |
| Desktop or Laptop | 4,667 | 84.5% |
| Smartphone | 4,811 | 87.1% |
| Tablet | 3,737 | 67.7% |
| No Computing Device | 288 | 5.2% |
| Total | 5,522 | 100.0% |
Internet Access in North Auburn
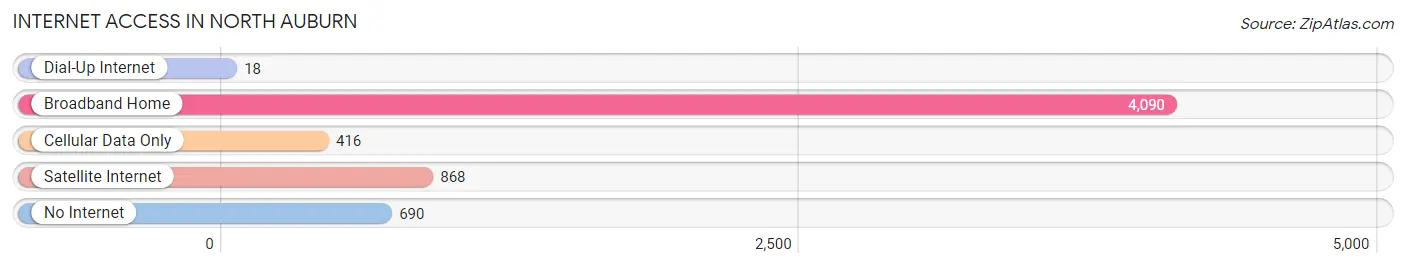
| Internet Type | # Households | % Households |
| Dial-Up Internet | 18 | 0.3% |
| Broadband Home | 4,090 | 74.1% |
| Cellular Data Only | 416 | 7.5% |
| Satellite Internet | 868 | 15.7% |
| No Internet | 690 | 12.5% |
| Total | 5,522 | 100.0% |
North Auburn Summary
Auburn, California is a city located in Placer County, California, United States. It is situated in the foothills of the Sierra Nevada Mountains, approximately 30 miles northeast of Sacramento. The city is part of the Sacramento–Arden-Arcade–Roseville Metropolitan Statistical Area. The population of Auburn was 13,330 at the 2010 census.
History
The area now known as Auburn was originally inhabited by the Maidu and Miwok Native American tribes. The first European settlers arrived in the area in the early 1850s, and the city was officially founded in 1848. The city was named after Auburn, New York, which was the hometown of one of the first settlers, John S. Rockwell.
In the late 19th century, Auburn was a major stop on the Central Pacific Railroad, and the city grew rapidly. By the early 20th century, Auburn had become a major center for mining and timber production. The city was also home to a large Chinese population, which was largely responsible for the construction of the Chinese Temple in Auburn.
Geography
Auburn is located at 38°53′N 121°04′W (38.88, -121.07). According to the United States Census Bureau, the city has a total area of 8.4 square miles (21.7 km2), of which 8.3 square miles (21.5 km2) is land and 0.1 square miles (0.2 km2) (1.17%) is water.
Economy
Auburn’s economy is largely based on tourism, agriculture, and light manufacturing. The city is home to several wineries, and is a popular destination for outdoor recreation. The city is also home to several large employers, including Placer County, the Auburn Union School District, and the Auburn Medical Center.
Demographics
As of the 2010 census, there were 13,330 people, 5,717 households, and 3,541 families residing in the city. The population density was 1,597.7 people per square mile (616.2/km2). There were 6,093 housing units at an average density of 730.3 per square mile (282.2/km2). The racial makeup of the city was 87.2% White, 1.2% African American, 0.8% Native American, 3.2% Asian, 0.2% Pacific Islander, 4.3% from other races, and 3.1% from two or more races. Hispanic or Latino of any race were 11.2% of the population.
There were 5,717 households, out of which 28.2% had children under the age of 18 living with them, 46.2% were married couples living together, 11.7% had a female householder with no husband present, and 37.2% were non-families. 30.2% of all households were made up of individuals, and 11.3% had someone living alone who was 65 years of age or older. The average household size was 2.32 and the average family size was 2.89.
In the city, the population was spread out, with 23.2% under the age of 18, 8.2% from 18 to 24, 27.2% from 25 to 44, 25.2% from 45 to 64, and 16.2% who were 65 years of age or older. The median age was 39 years. For every 100 females, there were 94.2 males. For every 100 females age 18 and over, there were 91.2 males.
The median income for a household in the city was $45,906, and the median income for a family was $54,844. Males had a median income of $41,890 versus $30,917 for females. The per capita income for the city was $24,845. About 6.2% of families and 8.7% of the population were below the poverty line, including 11.2% of those under age 18 and 5.7% of those age 65 or over.
Common Questions
What is Per Capita Income in North Auburn?
Per Capita income in North Auburn is $41,393.
What is the Median Family Income in North Auburn?
Median Family Income in North Auburn is $102,704.
What is the Median Household income in North Auburn?
Median Household Income in North Auburn is $74,315.
What is Income or Wage Gap in North Auburn?
Income or Wage Gap in North Auburn is 20.5%.
Women in North Auburn earn 79.5 cents for every dollar earned by a man.
What is Inequality or Gini Index in North Auburn?
Inequality or Gini Index in North Auburn is 0.47.
What is the Total Population of North Auburn?
Total Population of North Auburn is 14,403.
What is the Total Male Population of North Auburn?
Total Male Population of North Auburn is 7,200.
What is the Total Female Population of North Auburn?
Total Female Population of North Auburn is 7,203.
What is the Ratio of Males per 100 Females in North Auburn?
There are 99.96 Males per 100 Females in North Auburn.
What is the Ratio of Females per 100 Males in North Auburn?
There are 100.04 Females per 100 Males in North Auburn.
What is the Median Population Age in North Auburn?
Median Population Age in North Auburn is 43.8 Years.
What is the Average Family Size in North Auburn
Average Family Size in North Auburn is 3.1 People.
What is the Average Household Size in North Auburn
Average Household Size in North Auburn is 2.4 People.
How Large is the Labor Force in North Auburn?
There are 6,344 People in the Labor Forcein in North Auburn.
What is the Percentage of People in the Labor Force in North Auburn?
54.0% of People are in the Labor Force in North Auburn.
What is the Unemployment Rate in North Auburn?
Unemployment Rate in North Auburn is 2.5%.