Cities with the Fewest Births per 1,000 Women Over the Age of 35 in North Dakota
RELATED REPORTS & OPTIONS
Lowest Birth Rate | Women 35+
North Dakota
Compare Cities
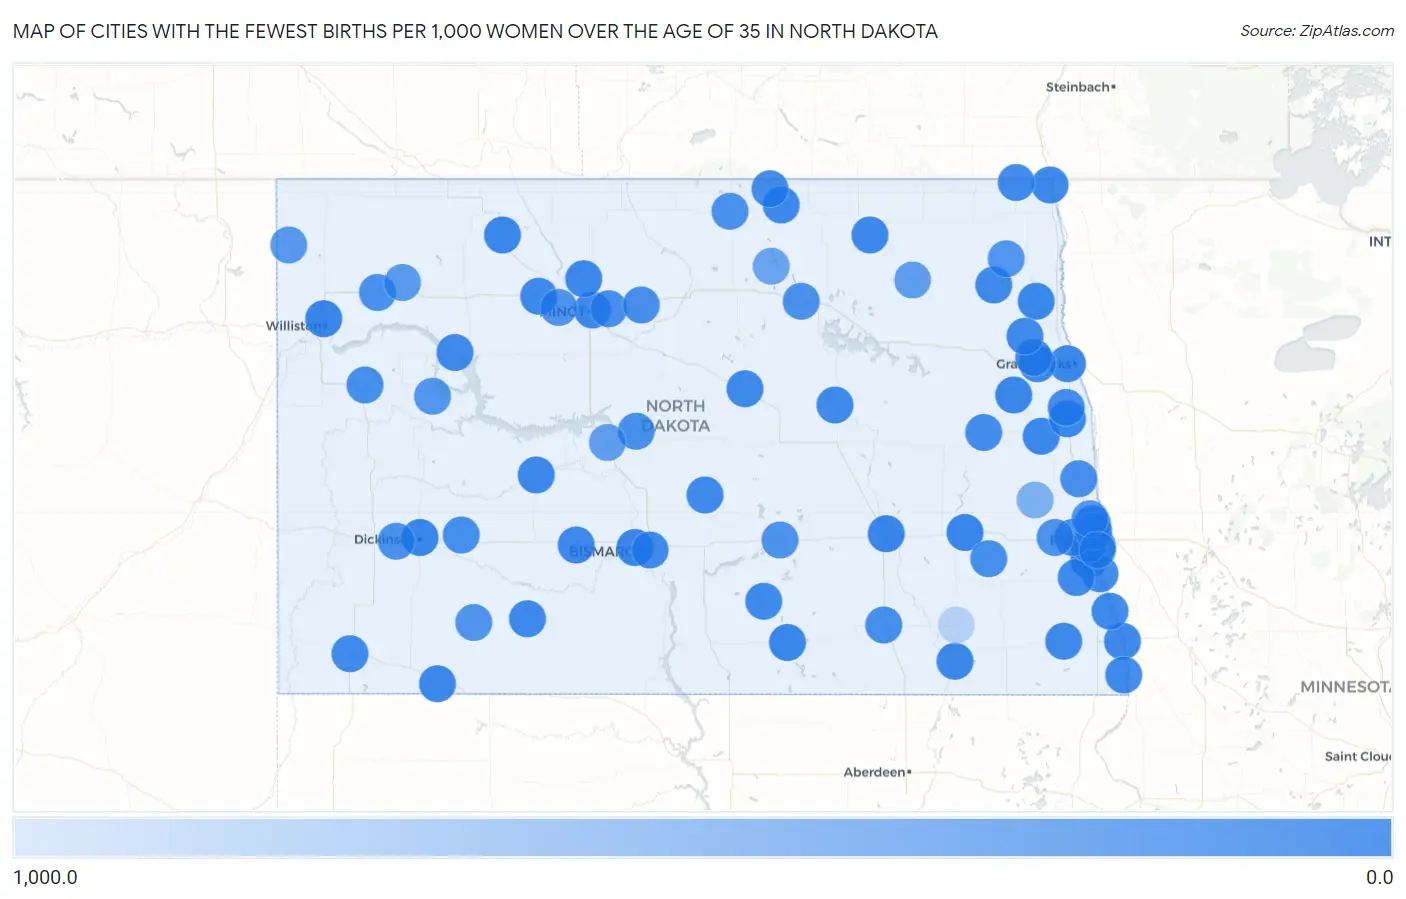
Map of Cities with the Fewest Births per 1,000 Women Over the Age of 35 in North Dakota
1,000.0
0.0
Cities with the Fewest Births per 1,000 Women Over the Age of 35 in North Dakota
| City | Births / 1,000 Women | vs State | vs National | |
| 1. | Mandan | 8.0 | 32.0(-24.0)#1 | 32.0(-24.0)#348 |
| 2. | Valley City | 9.0 | 32.0(-23.0)#2 | 32.0(-23.0)#491 |
| 3. | Dickinson | 12.0 | 32.0(-20.0)#3 | 32.0(-20.0)#819 |
| 4. | Williston | 13.0 | 32.0(-19.0)#4 | 32.0(-19.0)#936 |
| 5. | Jamestown | 16.0 | 32.0(-16.0)#5 | 32.0(-16.0)#1,352 |
| 6. | Mayville | 17.0 | 32.0(-15.0)#6 | 32.0(-15.0)#1,590 |
| 7. | Fargo | 20.0 | 32.0(-12.0)#7 | 32.0(-12.0)#1,975 |
| 8. | Kenmare | 21.0 | 32.0(-11.0)#8 | 32.0(-11.0)#2,291 |
| 9. | Harwood | 23.0 | 32.0(-9.00)#9 | 32.0(-9.00)#2,660 |
| 10. | Grand Forks | 25.0 | 32.0(-7.00)#10 | 32.0(-7.00)#2,877 |
| 11. | Horace | 29.0 | 32.0(-3.00)#11 | 32.0(-3.00)#3,667 |
| 12. | Northwood | 29.0 | 32.0(-3.00)#12 | 32.0(-3.00)#3,710 |
| 13. | Minto | 29.0 | 32.0(-3.00)#13 | 32.0(-3.00)#3,722 |
| 14. | Oakes | 31.0 | 32.0(-1.000)#14 | 32.0(-1.000)#4,067 |
| 15. | Wishek | 31.0 | 32.0(-1.000)#15 | 32.0(-1.000)#4,104 |
| 16. | Hettinger | 33.0 | 32.0(+1.000)#16 | 32.0(+1.000)#4,440 |
| 17. | Pembina | 33.0 | 32.0(+1.000)#17 | 32.0(+1.000)#4,455 |
| 18. | Minot | 34.0 | 32.0(+2.00)#18 | 32.0(+2.00)#4,494 |
| 19. | Wahpeton | 36.0 | 32.0(+4.00)#19 | 32.0(+4.00)#4,851 |
| 20. | Minot Afb | 36.0 | 32.0(+4.00)#20 | 32.0(+4.00)#4,872 |
| 21. | Rolla | 36.0 | 32.0(+4.00)#21 | 32.0(+4.00)#4,913 |
| 22. | Buxton | 36.0 | 32.0(+4.00)#22 | 32.0(+4.00)#4,936 |
| 23. | Munich | 37.0 | 32.0(+5.00)#23 | 32.0(+5.00)#5,101 |
| 24. | New Salem | 38.0 | 32.0(+6.00)#24 | 32.0(+6.00)#5,257 |
| 25. | Beulah | 43.0 | 32.0(+11.0)#25 | 32.0(+11.0)#5,884 |
| 26. | Emerado | 43.0 | 32.0(+11.0)#26 | 32.0(+11.0)#5,927 |
| 27. | Berthold | 45.0 | 32.0(+13.0)#27 | 32.0(+13.0)#6,157 |
| 28. | Elgin | 48.0 | 32.0(+16.0)#28 | 32.0(+16.0)#6,453 |
| 29. | Park River | 51.0 | 32.0(+19.0)#29 | 32.0(+19.0)#6,746 |
| 30. | New Rockford | 51.0 | 32.0(+19.0)#30 | 32.0(+19.0)#6,748 |
| 31. | Wyndmere | 51.0 | 32.0(+19.0)#31 | 32.0(+19.0)#6,767 |
| 32. | Grand Forks Afb | 52.0 | 32.0(+20.0)#32 | 32.0(+20.0)#6,835 |
| 33. | Oxbow | 53.0 | 32.0(+21.0)#33 | 32.0(+21.0)#6,952 |
| 34. | Bismarck | 55.0 | 32.0(+23.0)#34 | 32.0(+23.0)#7,066 |
| 35. | Abercrombie | 63.0 | 32.0(+31.0)#35 | 32.0(+31.0)#7,707 |
| 36. | Harvey | 65.0 | 32.0(+33.0)#36 | 32.0(+33.0)#7,800 |
| 37. | Neche | 65.0 | 32.0(+33.0)#37 | 32.0(+33.0)#7,826 |
| 38. | Wing | 65.0 | 32.0(+33.0)#38 | 32.0(+33.0)#7,829 |
| 39. | New Town | 68.0 | 32.0(+36.0)#39 | 32.0(+36.0)#7,959 |
| 40. | Kindred | 68.0 | 32.0(+36.0)#40 | 32.0(+36.0)#7,971 |
| 41. | West Fargo | 69.0 | 32.0(+37.0)#41 | 32.0(+37.0)#7,982 |
| 42. | Fairmount | 69.0 | 32.0(+37.0)#42 | 32.0(+37.0)#8,025 |
| 43. | Bowman | 75.0 | 32.0(+43.0)#43 | 32.0(+43.0)#8,320 |
| 44. | Mapleton | 78.0 | 32.0(+46.0)#44 | 32.0(+46.0)#8,457 |
| 45. | Gilby | 78.0 | 32.0(+46.0)#45 | 32.0(+46.0)#8,465 |
| 46. | Napoleon | 82.0 | 32.0(+50.0)#46 | 32.0(+50.0)#8,589 |
| 47. | Reynolds | 83.0 | 32.0(+51.0)#47 | 32.0(+51.0)#8,629 |
| 48. | Finley | 94.0 | 32.0(+62.0)#48 | 32.0(+62.0)#8,977 |
| 49. | St John | 95.0 | 32.0(+63.0)#49 | 32.0(+63.0)#9,002 |
| 50. | Edgeley | 104.0 | 32.0(+72.0)#50 | 32.0(+72.0)#9,226 |
| 51. | Taylor | 105.0 | 32.0(+73.0)#51 | 32.0(+73.0)#9,259 |
| 52. | Turtle Lake | 107.0 | 32.0(+75.0)#52 | 32.0(+75.0)#9,299 |
| 53. | Watford City | 115.0 | 32.0(+83.0)#53 | 32.0(+83.0)#9,475 |
| 54. | Fingal | 115.0 | 32.0(+83.0)#54 | 32.0(+83.0)#9,494 |
| 55. | Surrey | 116.0 | 32.0(+84.0)#55 | 32.0(+84.0)#9,505 |
| 56. | Granville | 125.0 | 32.0(+93.0)#56 | 32.0(+93.0)#9,670 |
| 57. | Grandin | 125.0 | 32.0(+93.0)#57 | 32.0(+93.0)#9,678 |
| 58. | Ray | 143.0 | 32.0(+111)#58 | 32.0(+111)#9,923 |
| 59. | South Heart | 154.0 | 32.0(+122)#59 | 32.0(+122)#10,054 |
| 60. | Dunseith | 155.0 | 32.0(+123)#60 | 32.0(+123)#10,068 |
| 61. | Leeds | 157.0 | 32.0(+125)#61 | 32.0(+125)#10,080 |
| 62. | Tappen | 167.0 | 32.0(+135)#62 | 32.0(+135)#10,169 |
| 63. | Casselton | 174.0 | 32.0(+142)#63 | 32.0(+142)#10,206 |
| 64. | Des Lacs | 182.0 | 32.0(+150)#64 | 32.0(+150)#10,269 |
| 65. | Reile S Acres | 190.0 | 32.0(+158)#65 | 32.0(+158)#10,315 |
| 66. | Mott | 190.0 | 32.0(+158)#66 | 32.0(+158)#10,316 |
| 67. | Mandaree | 200.0 | 32.0(+168)#67 | 32.0(+168)#10,358 |
| 68. | Hoople | 200.0 | 32.0(+168)#68 | 32.0(+168)#10,375 |
| 69. | Brooktree Park | 229.0 | 32.0(+197)#69 | 32.0(+197)#10,532 |
| 70. | Grenora | 250.0 | 32.0(+218)#70 | 32.0(+218)#10,597 |
| 71. | Tioga | 273.0 | 32.0(+241)#71 | 32.0(+241)#10,671 |
| 72. | Edmore | 286.0 | 32.0(+254)#72 | 32.0(+254)#10,705 |
| 73. | Underwood | 327.0 | 32.0(+295)#73 | 32.0(+295)#10,765 |
| 74. | Prairie Rose | 333.0 | 32.0(+301)#74 | 32.0(+301)#10,801 |
| 75. | Wolford | 400.0 | 32.0(+368)#75 | 32.0(+368)#10,867 |
| 76. | Erie | 556.0 | 32.0(+524)#76 | 32.0(+524)#10,966 |
| 77. | Verona | 1,000.0 | 32.0(+968)#77 | 32.0(+968)#11,053 |
1
2Common Questions
What are the Top 10 Cities with the Fewest Births per 1,000 Women Over the Age of 35 in North Dakota?
Top 10 Cities with the Fewest Births per 1,000 Women Over the Age of 35 in North Dakota are:
#1
0.0
#2
0.0
#3
0.0
#4
0.0
#5
0.0
#6
0.0
#7
0.0
#8
0.0
#9
0.0
#10
0.0
What city has the Fewest Births per 1,000 Women Over the Age of 35 in North Dakota?
Mandan has the Fewest Births per 1,000 Women Over the Age of 35 in North Dakota with 8.0.
What is the Number of Births per 1,000 Women Over the Age of 35 in the State of North Dakota?
Number of Births per 1,000 Women Over the Age of 35 in North Dakota is 32.0.
What is the Number of Births per 1,000 Women Over the Age of 35 in the United States?
Number of Births per 1,000 Women Over the Age of 35 in the United States is 32.0.