Cities with the Fewest Births per 1,000 Women Over the Age of 35 in Texas
RELATED REPORTS & OPTIONS
Lowest Birth Rate | Women 35+
Texas
Compare Cities
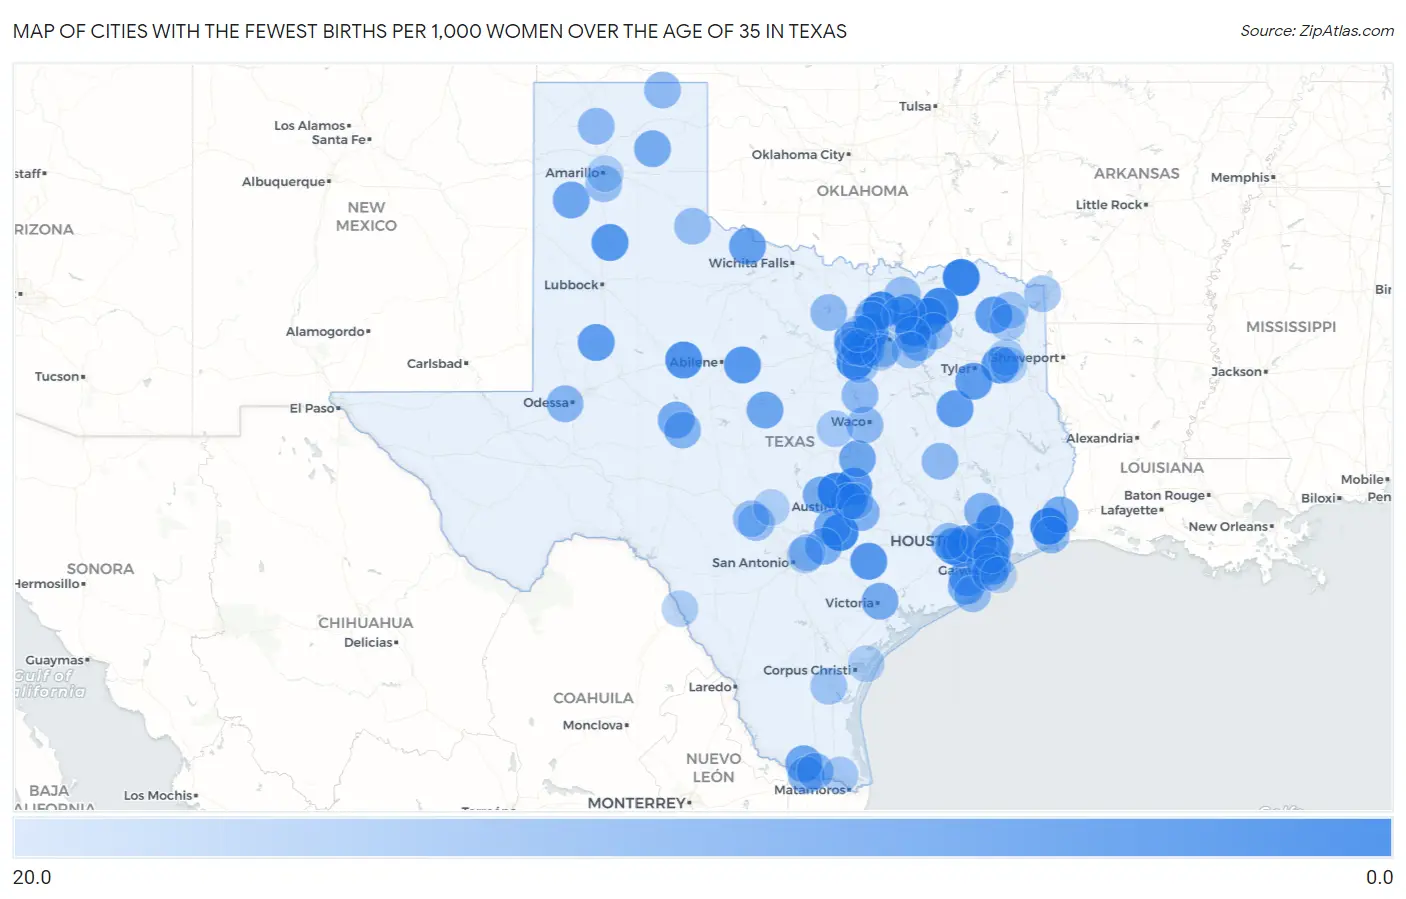
Map of Cities with the Fewest Births per 1,000 Women Over the Age of 35 in Texas
20.0
0.0
Cities with the Fewest Births per 1,000 Women Over the Age of 35 in Texas
| City | Births / 1,000 Women | vs State | vs National | |
| 1. | Paris | 2.0 | 32.0(-30.0)#1 | 32.0(-30.0)#11 |
| 2. | Brushy Creek | 2.0 | 32.0(-30.0)#2 | 32.0(-30.0)#14 |
| 3. | Nederland | 2.0 | 32.0(-30.0)#3 | 32.0(-30.0)#16 |
| 4. | Fate | 3.0 | 32.0(-29.0)#4 | 32.0(-29.0)#43 |
| 5. | Lockhart | 3.0 | 32.0(-29.0)#5 | 32.0(-29.0)#49 |
| 6. | Commerce | 3.0 | 32.0(-29.0)#6 | 32.0(-29.0)#62 |
| 7. | Paloma Creek South | 3.0 | 32.0(-29.0)#7 | 32.0(-29.0)#65 |
| 8. | Joshua | 3.0 | 32.0(-29.0)#8 | 32.0(-29.0)#68 |
| 9. | Colleyville | 4.0 | 32.0(-28.0)#9 | 32.0(-28.0)#85 |
| 10. | Greenville | 5.0 | 32.0(-27.0)#10 | 32.0(-27.0)#122 |
| 11. | Sweetwater | 5.0 | 32.0(-27.0)#11 | 32.0(-27.0)#147 |
| 12. | Dayton | 5.0 | 32.0(-27.0)#12 | 32.0(-27.0)#155 |
| 13. | Plainview | 6.0 | 32.0(-26.0)#13 | 32.0(-26.0)#188 |
| 14. | Taylor | 6.0 | 32.0(-26.0)#14 | 32.0(-26.0)#194 |
| 15. | Manor | 6.0 | 32.0(-26.0)#15 | 32.0(-26.0)#201 |
| 16. | Kilgore | 6.0 | 32.0(-26.0)#16 | 32.0(-26.0)#206 |
| 17. | Shiner | 6.0 | 32.0(-26.0)#17 | 32.0(-26.0)#238 |
| 18. | Baird | 6.0 | 32.0(-26.0)#18 | 32.0(-26.0)#240 |
| 19. | Palestine | 7.0 | 32.0(-25.0)#19 | 32.0(-25.0)#259 |
| 20. | Mount Pleasant | 7.0 | 32.0(-25.0)#20 | 32.0(-25.0)#267 |
| 21. | Forest Hill | 7.0 | 32.0(-25.0)#21 | 32.0(-25.0)#272 |
| 22. | Lamesa | 7.0 | 32.0(-25.0)#22 | 32.0(-25.0)#296 |
| 23. | Bullard | 7.0 | 32.0(-25.0)#23 | 32.0(-25.0)#313 |
| 24. | Angleton | 8.0 | 32.0(-24.0)#24 | 32.0(-24.0)#357 |
| 25. | Princeton | 8.0 | 32.0(-24.0)#25 | 32.0(-24.0)#360 |
| 26. | White Settlement | 8.0 | 32.0(-24.0)#26 | 32.0(-24.0)#362 |
| 27. | Stafford | 8.0 | 32.0(-24.0)#27 | 32.0(-24.0)#368 |
| 28. | Four Corners | 8.0 | 32.0(-24.0)#28 | 32.0(-24.0)#381 |
| 29. | Vernon | 8.0 | 32.0(-24.0)#29 | 32.0(-24.0)#386 |
| 30. | Baytown | 9.0 | 32.0(-23.0)#30 | 32.0(-23.0)#422 |
| 31. | Brownwood | 9.0 | 32.0(-23.0)#31 | 32.0(-23.0)#443 |
| 32. | Alton | 9.0 | 32.0(-23.0)#32 | 32.0(-23.0)#445 |
| 33. | La Marque | 9.0 | 32.0(-23.0)#33 | 32.0(-23.0)#446 |
| 34. | Bellaire | 9.0 | 32.0(-23.0)#34 | 32.0(-23.0)#449 |
| 35. | Hereford | 9.0 | 32.0(-23.0)#35 | 32.0(-23.0)#455 |
| 36. | Little River Academy | 9.0 | 32.0(-23.0)#36 | 32.0(-23.0)#513 |
| 37. | Victoria | 10.0 | 32.0(-22.0)#37 | 32.0(-22.0)#521 |
| 38. | Orange | 10.0 | 32.0(-22.0)#38 | 32.0(-22.0)#550 |
| 39. | Pampa | 10.0 | 32.0(-22.0)#39 | 32.0(-22.0)#555 |
| 40. | Seabrook | 10.0 | 32.0(-22.0)#40 | 32.0(-22.0)#571 |
| 41. | Lago Vista | 10.0 | 32.0(-22.0)#41 | 32.0(-22.0)#600 |
| 42. | Kennedale | 10.0 | 32.0(-22.0)#42 | 32.0(-22.0)#603 |
| 43. | Grape Creek | 10.0 | 32.0(-22.0)#43 | 32.0(-22.0)#627 |
| 44. | Uhland | 10.0 | 32.0(-22.0)#44 | 32.0(-22.0)#641 |
| 45. | Lake Jackson | 11.0 | 32.0(-21.0)#45 | 32.0(-21.0)#668 |
| 46. | Hidalgo | 11.0 | 32.0(-21.0)#46 | 32.0(-21.0)#691 |
| 47. | Santa Fe | 11.0 | 32.0(-21.0)#47 | 32.0(-21.0)#698 |
| 48. | Galena Park | 11.0 | 32.0(-21.0)#48 | 32.0(-21.0)#710 |
| 49. | Camp Swift | 11.0 | 32.0(-21.0)#49 | 32.0(-21.0)#738 |
| 50. | Patton Village | 11.0 | 32.0(-21.0)#50 | 32.0(-21.0)#776 |
| 51. | Geronimo | 11.0 | 32.0(-21.0)#51 | 32.0(-21.0)#778 |
| 52. | San Angelo | 12.0 | 32.0(-20.0)#52 | 32.0(-20.0)#790 |
| 53. | West Odessa | 12.0 | 32.0(-20.0)#53 | 32.0(-20.0)#808 |
| 54. | Corinth | 12.0 | 32.0(-20.0)#54 | 32.0(-20.0)#826 |
| 55. | Alamo | 12.0 | 32.0(-20.0)#55 | 32.0(-20.0)#831 |
| 56. | Terrell | 12.0 | 32.0(-20.0)#56 | 32.0(-20.0)#838 |
| 57. | Town Of Pecos | 12.0 | 32.0(-20.0)#57 | 32.0(-20.0)#848 |
| 58. | Port Arthur | 13.0 | 32.0(-19.0)#58 | 32.0(-19.0)#922 |
| 59. | Dumas | 13.0 | 32.0(-19.0)#59 | 32.0(-19.0)#965 |
| 60. | Woodway | 13.0 | 32.0(-19.0)#60 | 32.0(-19.0)#985 |
| 61. | Perryton | 13.0 | 32.0(-19.0)#61 | 32.0(-19.0)#990 |
| 62. | Madisonville | 13.0 | 32.0(-19.0)#62 | 32.0(-19.0)#1,007 |
| 63. | Whitney | 13.0 | 32.0(-19.0)#63 | 32.0(-19.0)#1,019 |
| 64. | West Tawakoni | 13.0 | 32.0(-19.0)#64 | 32.0(-19.0)#1,025 |
| 65. | Runaway Bay | 13.0 | 32.0(-19.0)#65 | 32.0(-19.0)#1,029 |
| 66. | Schertz | 14.0 | 32.0(-18.0)#66 | 32.0(-18.0)#1,054 |
| 67. | Duncanville | 14.0 | 32.0(-18.0)#67 | 32.0(-18.0)#1,057 |
| 68. | Kerrville | 14.0 | 32.0(-18.0)#68 | 32.0(-18.0)#1,070 |
| 69. | Cinco Ranch | 14.0 | 32.0(-18.0)#69 | 32.0(-18.0)#1,081 |
| 70. | Freeport | 14.0 | 32.0(-18.0)#70 | 32.0(-18.0)#1,105 |
| 71. | Hitchcock | 14.0 | 32.0(-18.0)#71 | 32.0(-18.0)#1,123 |
| 72. | Childress | 14.0 | 32.0(-18.0)#72 | 32.0(-18.0)#1,135 |
| 73. | Van Alstyne | 14.0 | 32.0(-18.0)#73 | 32.0(-18.0)#1,137 |
| 74. | Mclendon Chisholm | 14.0 | 32.0(-18.0)#74 | 32.0(-18.0)#1,140 |
| 75. | Ingram | 14.0 | 32.0(-18.0)#75 | 32.0(-18.0)#1,161 |
| 76. | Timbercreek Canyon | 14.0 | 32.0(-18.0)#76 | 32.0(-18.0)#1,180 |
| 77. | Texarkana | 15.0 | 32.0(-17.0)#77 | 32.0(-17.0)#1,195 |
| 78. | Kingsville | 15.0 | 32.0(-17.0)#78 | 32.0(-17.0)#1,203 |
| 79. | Benbrook | 15.0 | 32.0(-17.0)#79 | 32.0(-17.0)#1,204 |
| 80. | Keene | 15.0 | 32.0(-17.0)#80 | 32.0(-17.0)#1,249 |
| 81. | Crandall | 15.0 | 32.0(-17.0)#81 | 32.0(-17.0)#1,273 |
| 82. | Naples | 15.0 | 32.0(-17.0)#82 | 32.0(-17.0)#1,296 |
| 83. | Longview | 16.0 | 32.0(-16.0)#83 | 32.0(-16.0)#1,316 |
| 84. | San Benito | 16.0 | 32.0(-16.0)#84 | 32.0(-16.0)#1,336 |
| 85. | Gatesville | 16.0 | 32.0(-16.0)#85 | 32.0(-16.0)#1,353 |
| 86. | Fairview | 16.0 | 32.0(-16.0)#86 | 32.0(-16.0)#1,368 |
| 87. | Elgin | 16.0 | 32.0(-16.0)#87 | 32.0(-16.0)#1,369 |
| 88. | Double Oak | 16.0 | 32.0(-16.0)#88 | 32.0(-16.0)#1,418 |
| 89. | Daingerfield | 16.0 | 32.0(-16.0)#89 | 32.0(-16.0)#1,425 |
| 90. | Kemah | 16.0 | 32.0(-16.0)#90 | 32.0(-16.0)#1,434 |
| 91. | Amarillo | 17.0 | 32.0(-15.0)#91 | 32.0(-15.0)#1,459 |
| 92. | Cedar Hill | 17.0 | 32.0(-15.0)#92 | 32.0(-15.0)#1,475 |
| 93. | Eagle Pass | 17.0 | 32.0(-15.0)#93 | 32.0(-15.0)#1,487 |
| 94. | Fredericksburg | 17.0 | 32.0(-15.0)#94 | 32.0(-15.0)#1,523 |
| 95. | Ingleside | 17.0 | 32.0(-15.0)#95 | 32.0(-15.0)#1,532 |
| 96. | Edgecliff Village | 17.0 | 32.0(-15.0)#96 | 32.0(-15.0)#1,568 |
| 97. | Blue Mound | 17.0 | 32.0(-15.0)#97 | 32.0(-15.0)#1,581 |
| 98. | Randolph Afb | 17.0 | 32.0(-15.0)#98 | 32.0(-15.0)#1,610 |
| 99. | Lakeport | 17.0 | 32.0(-15.0)#99 | 32.0(-15.0)#1,617 |
| 100. | Galveston | 18.0 | 32.0(-14.0)#100 | 32.0(-14.0)#1,644 |
Common Questions
What are the Top 10 Cities with the Fewest Births per 1,000 Women Over the Age of 35 in Texas?
Top 10 Cities with the Fewest Births per 1,000 Women Over the Age of 35 in Texas are:
#1
2.0
#2
2.0
#3
2.0
#4
3.0
#5
3.0
#6
3.0
#7
3.0
#8
3.0
#9
4.0
#10
5.0
What city has the Fewest Births per 1,000 Women Over the Age of 35 in Texas?
Paris has the Fewest Births per 1,000 Women Over the Age of 35 in Texas with 2.0.
What is the Number of Births per 1,000 Women Over the Age of 35 in the State of Texas?
Number of Births per 1,000 Women Over the Age of 35 in Texas is 32.0.
What is the Number of Births per 1,000 Women Over the Age of 35 in the United States?
Number of Births per 1,000 Women Over the Age of 35 in the United States is 32.0.