Rosedale, CA Map & Demographics
Rosedale Map
Rosedale Overview
$59,165
PER CAPITA INCOME
$154,297
AVG FAMILY INCOME
$123,036
AVG HOUSEHOLD INCOME
46.7%
WAGE / INCOME GAP [ % ]
53.3¢/ $1
WAGE / INCOME GAP [ $ ]
0.49
INEQUALITY / GINI INDEX
19,174
TOTAL POPULATION
10,100
MALE POPULATION
9,074
FEMALE POPULATION
111.31
MALES / 100 FEMALES
89.84
FEMALES / 100 MALES
37.6
MEDIAN AGE
3.5
AVG FAMILY SIZE
3.1
AVG HOUSEHOLD SIZE
9,419
LABOR FORCE [ PEOPLE ]
62.4%
PERCENT IN LABOR FORCE
3.2%
UNEMPLOYMENT RATE
Income in Rosedale
Income Overview in Rosedale
Per Capita Income in Rosedale is $59,165, while median incomes of families and households are $154,297 and $123,036 respectively.
| Characteristic | Number | Measure |
| Per Capita Income | 19,174 | $59,165 |
| Median Family Income | 4,963 | $154,297 |
| Mean Family Income | 4,963 | $190,092 |
| Median Household Income | 6,252 | $123,036 |
| Mean Household Income | 6,252 | $177,719 |
| Income Deficit | 4,963 | $0 |
| Wage / Income Gap (%) | 19,174 | 46.72% |
| Wage / Income Gap ($) | 19,174 | 53.28¢ per $1 |
| Gini / Inequality Index | 19,174 | 0.49 |
Earnings by Sex in Rosedale
Average Earnings in Rosedale are $59,603, $78,821 for men and $41,995 for women, a difference of 46.7%.

| Sex | Number | Average Earnings |
| Male | 5,554 (56.9%) | $78,821 |
| Female | 4,200 (43.1%) | $41,995 |
| Total | 9,754 (100.0%) | $59,603 |
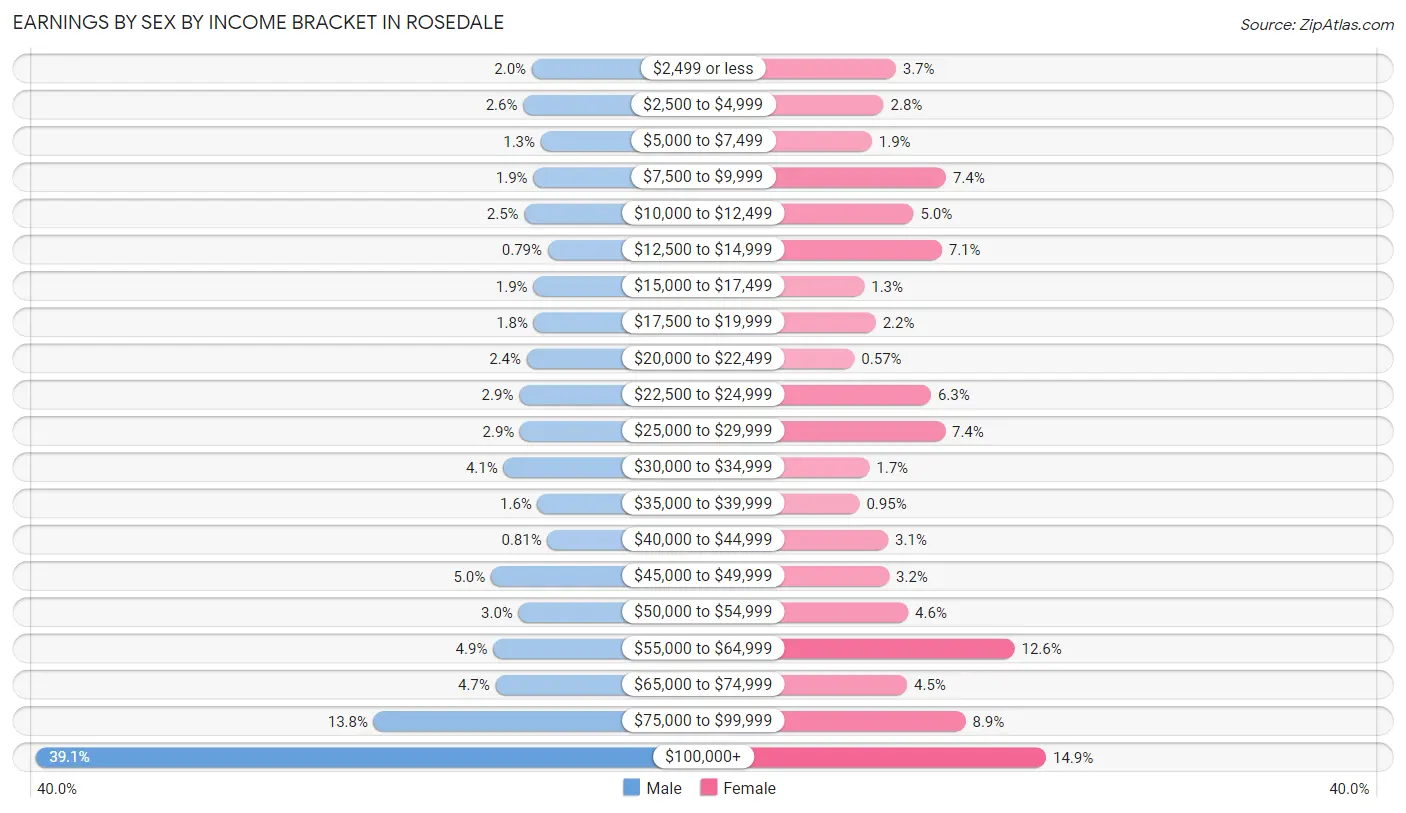
Earnings by Sex by Income Bracket in Rosedale
The most common earnings brackets in Rosedale are $100,000+ for men (2,173 | 39.1%) and $100,000+ for women (627 | 14.9%).
| Income | Male | Female |
| $2,499 or less | 110 (2.0%) | 154 (3.7%) |
| $2,500 to $4,999 | 146 (2.6%) | 116 (2.8%) |
| $5,000 to $7,499 | 73 (1.3%) | 79 (1.9%) |
| $7,500 to $9,999 | 104 (1.9%) | 312 (7.4%) |
| $10,000 to $12,499 | 141 (2.5%) | 210 (5.0%) |
| $12,500 to $14,999 | 44 (0.8%) | 299 (7.1%) |
| $15,000 to $17,499 | 104 (1.9%) | 55 (1.3%) |
| $17,500 to $19,999 | 102 (1.8%) | 91 (2.2%) |
| $20,000 to $22,499 | 131 (2.4%) | 24 (0.6%) |
| $22,500 to $24,999 | 163 (2.9%) | 265 (6.3%) |
| $25,000 to $29,999 | 159 (2.9%) | 309 (7.4%) |
| $30,000 to $34,999 | 228 (4.1%) | 71 (1.7%) |
| $35,000 to $39,999 | 86 (1.5%) | 40 (0.9%) |
| $40,000 to $44,999 | 45 (0.8%) | 130 (3.1%) |
| $45,000 to $49,999 | 280 (5.0%) | 133 (3.2%) |
| $50,000 to $54,999 | 165 (3.0%) | 193 (4.6%) |
| $55,000 to $64,999 | 271 (4.9%) | 528 (12.6%) |
| $65,000 to $74,999 | 261 (4.7%) | 190 (4.5%) |
| $75,000 to $99,999 | 768 (13.8%) | 374 (8.9%) |
| $100,000+ | 2,173 (39.1%) | 627 (14.9%) |
| Total | 5,554 (100.0%) | 4,200 (100.0%) |
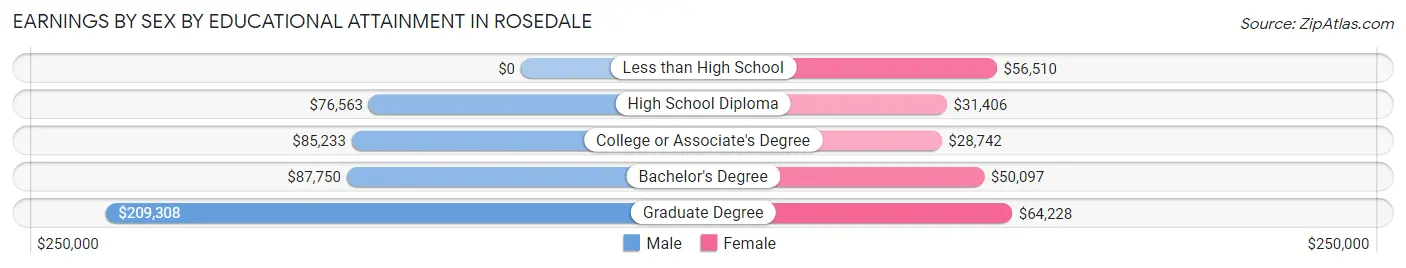
Earnings by Sex by Educational Attainment in Rosedale
Average earnings in Rosedale are $87,356 for men and $46,837 for women, a difference of 46.4%. Men with an educational attainment of graduate degree enjoy the highest average annual earnings of $209,308, while those with high school diploma education earn the least with $76,563. Women with an educational attainment of graduate degree earn the most with the average annual earnings of $64,228, while those with college or associate's degree education have the smallest earnings of $28,742.
| Educational Attainment | Male Income | Female Income |
| Less than High School | - | - |
| High School Diploma | $76,563 | $31,406 |
| College or Associate's Degree | $85,233 | $28,742 |
| Bachelor's Degree | $87,750 | $50,097 |
| Graduate Degree | $209,308 | $64,228 |
| Total | $87,356 | $46,837 |
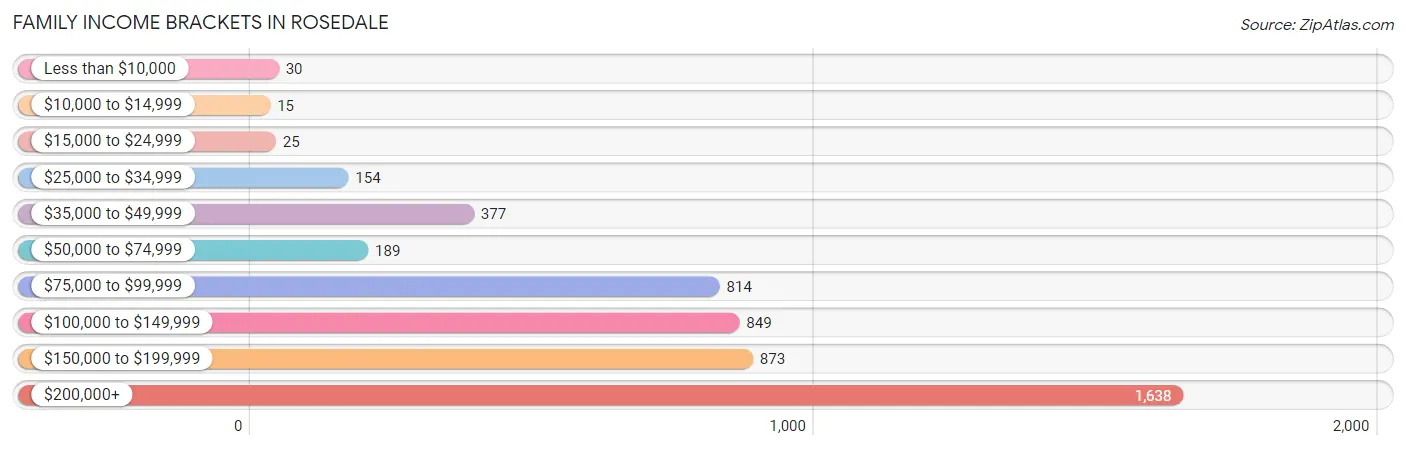
Family Income in Rosedale
Family Income Brackets in Rosedale
According to the Rosedale family income data, there are 1,638 families falling into the $200,000+ income range, which is the most common income bracket and makes up 33.0% of all families. Conversely, the $10,000 to $14,999 income bracket is the least frequent group with only 15 families (0.3%) belonging to this category.
| Income Bracket | # Families | % Families |
| Less than $10,000 | 30 | 0.6% |
| $10,000 to $14,999 | 15 | 0.3% |
| $15,000 to $24,999 | 25 | 0.5% |
| $25,000 to $34,999 | 154 | 3.1% |
| $35,000 to $49,999 | 377 | 7.6% |
| $50,000 to $74,999 | 189 | 3.8% |
| $75,000 to $99,999 | 814 | 16.4% |
| $100,000 to $149,999 | 849 | 17.1% |
| $150,000 to $199,999 | 873 | 17.6% |
| $200,000+ | 1,638 | 33.0% |
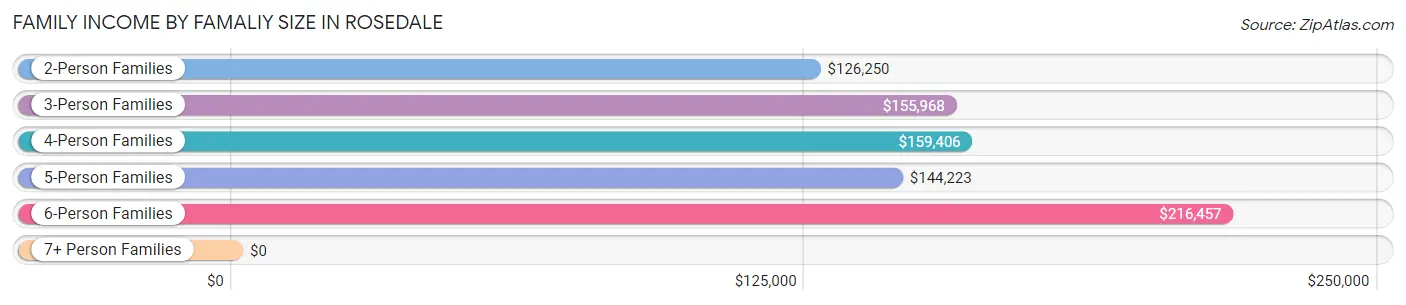
Family Income by Famaliy Size in Rosedale
6-person families (355 | 7.1%) account for the highest median family income in Rosedale with $216,457 per family, while 2-person families (1,940 | 39.1%) have the highest median income of $63,125 per family member.
| Income Bracket | # Families | Median Income |
| 2-Person Families | 1,940 (39.1%) | $126,250 |
| 3-Person Families | 886 (17.8%) | $155,968 |
| 4-Person Families | 1,225 (24.7%) | $159,406 |
| 5-Person Families | 509 (10.3%) | $144,223 |
| 6-Person Families | 355 (7.1%) | $216,457 |
| 7+ Person Families | 48 (1.0%) | $0 |
| Total | 4,963 (100.0%) | $154,297 |
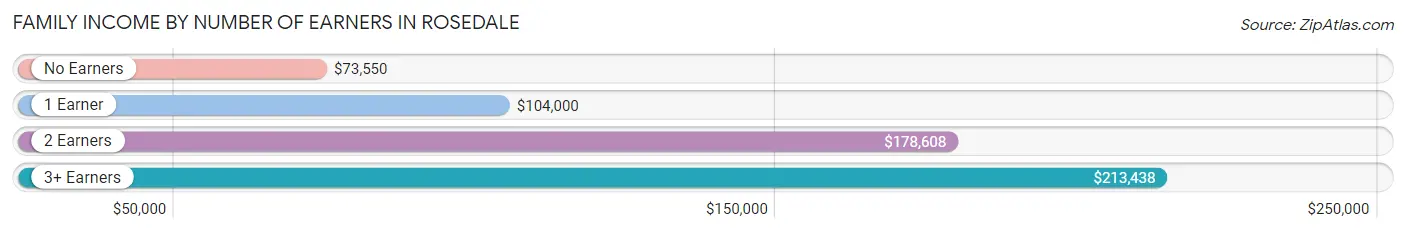
Family Income by Number of Earners in Rosedale
The median family income in Rosedale is $154,297, with families comprising 3+ earners (609) having the highest median family income of $213,438, while families with no earners (401) have the lowest median family income of $73,550, accounting for 12.3% and 8.1% of families, respectively.
| Number of Earners | # Families | Median Income |
| No Earners | 401 (8.1%) | $73,550 |
| 1 Earner | 1,468 (29.6%) | $104,000 |
| 2 Earners | 2,485 (50.1%) | $178,608 |
| 3+ Earners | 609 (12.3%) | $213,438 |
| Total | 4,963 (100.0%) | $154,297 |
Household Income in Rosedale
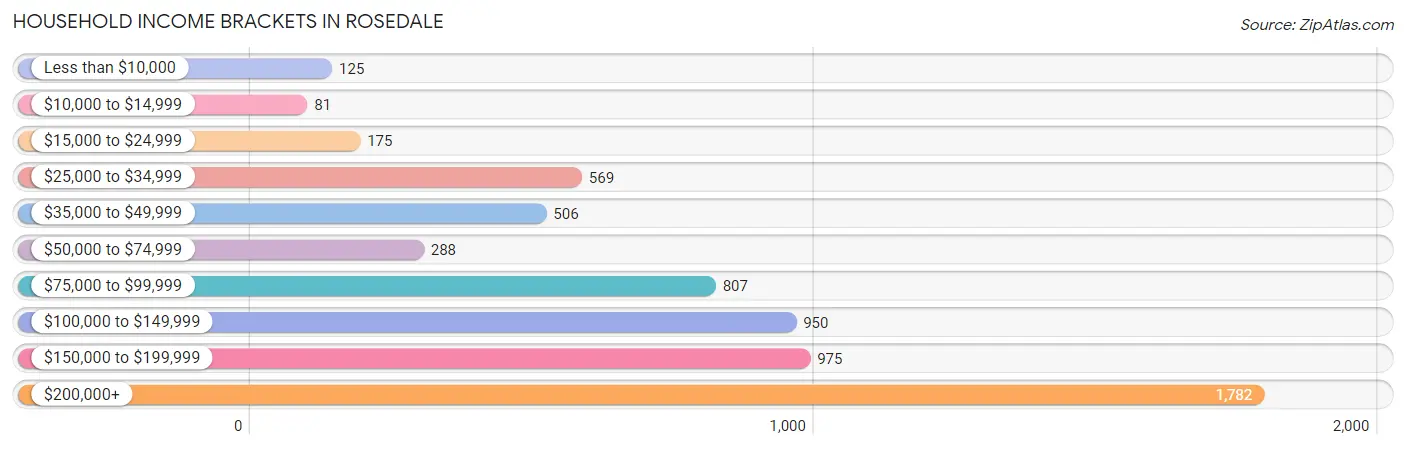
Household Income Brackets in Rosedale
With 1,782 households falling in the category, the $200,000+ income range is the most frequent in Rosedale, accounting for 28.5% of all households. In contrast, only 81 households (1.3%) fall into the $10,000 to $14,999 income bracket, making it the least populous group.
| Income Bracket | # Households | % Households |
| Less than $10,000 | 125 | 2.0% |
| $10,000 to $14,999 | 81 | 1.3% |
| $15,000 to $24,999 | 175 | 2.8% |
| $25,000 to $34,999 | 569 | 9.1% |
| $35,000 to $49,999 | 506 | 8.1% |
| $50,000 to $74,999 | 288 | 4.6% |
| $75,000 to $99,999 | 807 | 12.9% |
| $100,000 to $149,999 | 950 | 15.2% |
| $150,000 to $199,999 | 975 | 15.6% |
| $200,000+ | 1,782 | 28.5% |
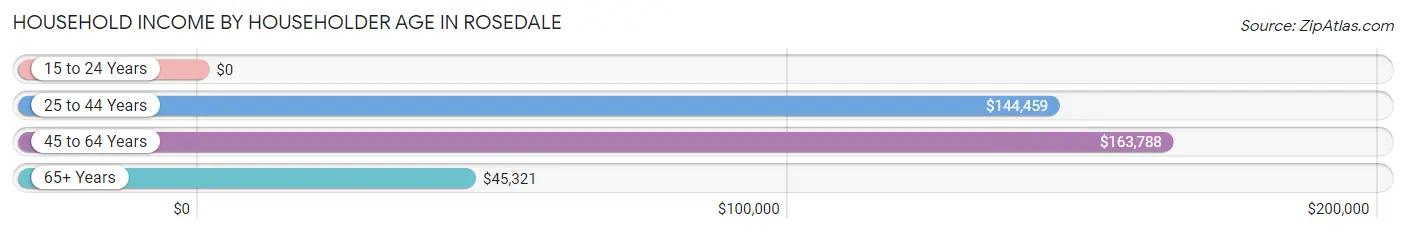
Household Income by Householder Age in Rosedale
The median household income in Rosedale is $123,036, with the highest median household income of $163,788 found in the 45 to 64 years age bracket for the primary householder. A total of 2,712 households (43.4%) fall into this category. Meanwhile, the 15 to 24 years age bracket for the primary householder has the lowest median household income of $0, with 14 households (0.2%) in this group.
| Income Bracket | # Households | Median Income |
| 15 to 24 Years | 14 (0.2%) | $0 |
| 25 to 44 Years | 1,794 (28.7%) | $144,459 |
| 45 to 64 Years | 2,712 (43.4%) | $163,788 |
| 65+ Years | 1,732 (27.7%) | $45,321 |
| Total | 6,252 (100.0%) | $123,036 |
Poverty in Rosedale
Income Below Poverty by Sex and Age in Rosedale
With 4.6% poverty level for males and 5.6% for females among the residents of Rosedale, 12 to 14 year old males and 75 year old and over females are the most vulnerable to poverty, with 88 males (25.4%) and 187 females (25.6%) in their respective age groups living below the poverty level.
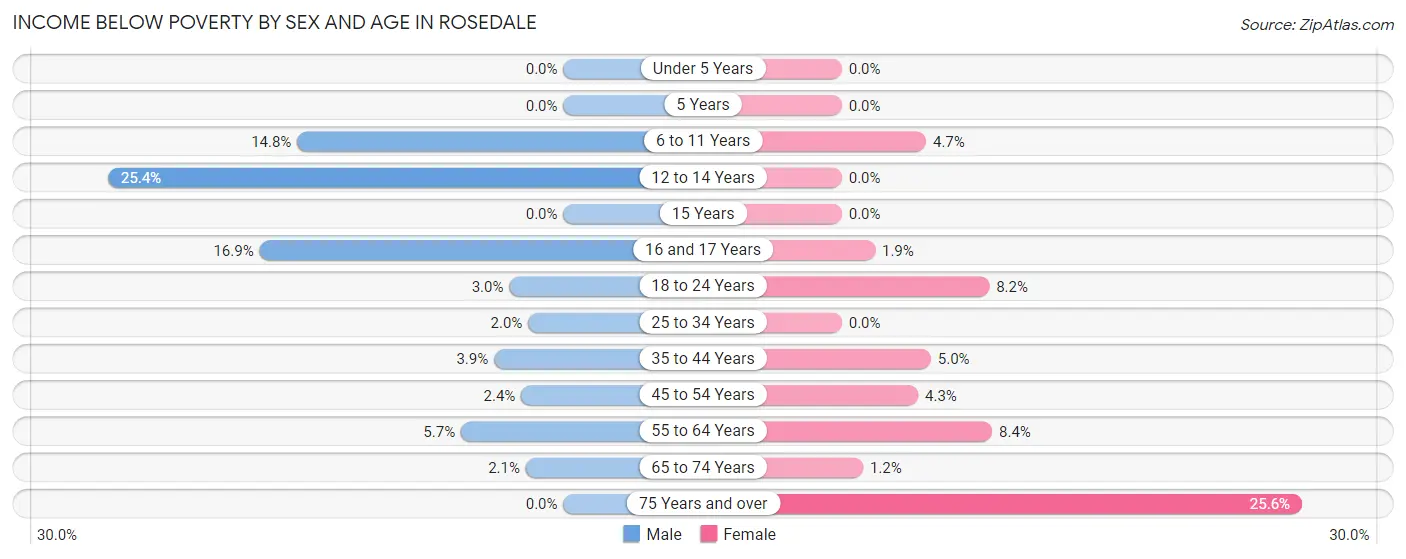
| Age Bracket | Male | Female |
| Under 5 Years | 0 (0.0%) | 0 (0.0%) |
| 5 Years | 0 (0.0%) | 0 (0.0%) |
| 6 to 11 Years | 103 (14.8%) | 46 (4.7%) |
| 12 to 14 Years | 88 (25.4%) | 0 (0.0%) |
| 15 Years | 0 (0.0%) | 0 (0.0%) |
| 16 and 17 Years | 33 (16.9%) | 6 (1.8%) |
| 18 to 24 Years | 42 (3.0%) | 50 (8.2%) |
| 25 to 34 Years | 20 (2.0%) | 0 (0.0%) |
| 35 to 44 Years | 48 (3.9%) | 61 (5.0%) |
| 45 to 54 Years | 27 (2.4%) | 62 (4.3%) |
| 55 to 64 Years | 88 (5.7%) | 90 (8.4%) |
| 65 to 74 Years | 17 (2.1%) | 7 (1.2%) |
| 75 Years and over | 0 (0.0%) | 187 (25.6%) |
| Total | 466 (4.6%) | 509 (5.6%) |
Income Above Poverty by Sex and Age in Rosedale
According to the poverty statistics in Rosedale, males aged under 5 years and females aged under 5 years are the age groups that are most secure financially, with 100.0% of males and 100.0% of females in these age groups living above the poverty line.
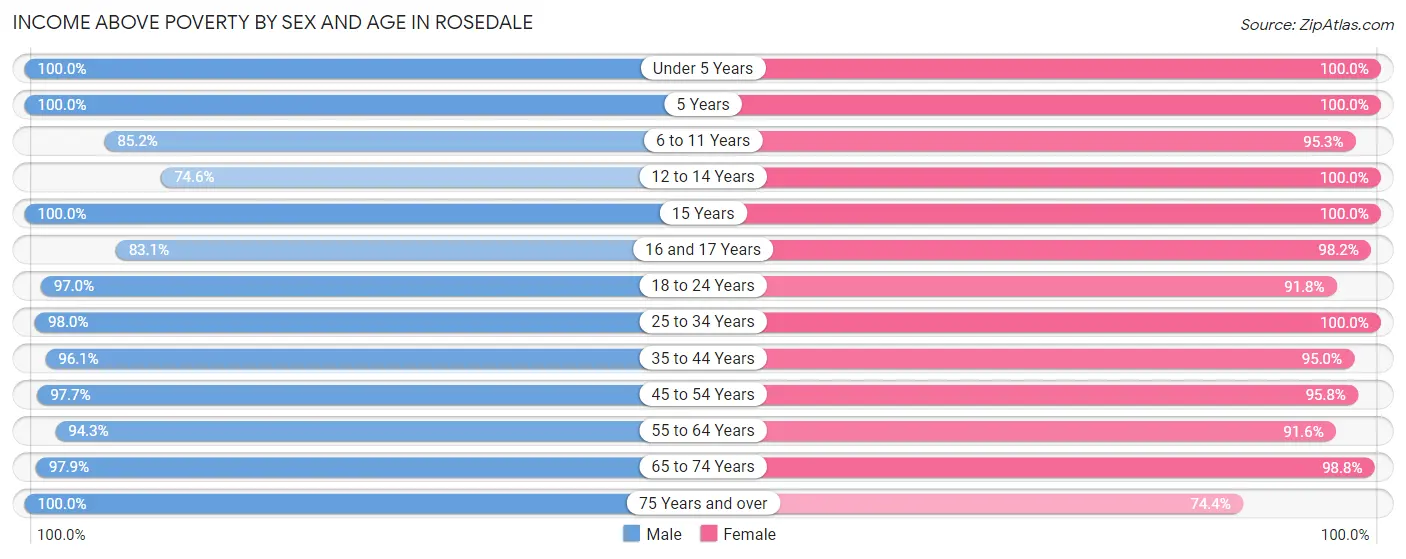
| Age Bracket | Male | Female |
| Under 5 Years | 846 (100.0%) | 256 (100.0%) |
| 5 Years | 121 (100.0%) | 103 (100.0%) |
| 6 to 11 Years | 592 (85.2%) | 935 (95.3%) |
| 12 to 14 Years | 259 (74.6%) | 516 (100.0%) |
| 15 Years | 185 (100.0%) | 30 (100.0%) |
| 16 and 17 Years | 162 (83.1%) | 319 (98.2%) |
| 18 to 24 Years | 1,355 (97.0%) | 559 (91.8%) |
| 25 to 34 Years | 998 (98.0%) | 1,166 (100.0%) |
| 35 to 44 Years | 1,196 (96.1%) | 1,170 (95.0%) |
| 45 to 54 Years | 1,121 (97.7%) | 1,396 (95.8%) |
| 55 to 64 Years | 1,455 (94.3%) | 985 (91.6%) |
| 65 to 74 Years | 797 (97.9%) | 587 (98.8%) |
| 75 Years and over | 547 (100.0%) | 543 (74.4%) |
| Total | 9,634 (95.4%) | 8,565 (94.4%) |
Income Below Poverty Among Married-Couple Families in Rosedale
The poverty statistics for married-couple families in Rosedale show that 2.3% or 98 of the total 4,332 families live below the poverty line. Families with 3 or 4 children have the highest poverty rate of 12.5%, comprising of 46 families. On the other hand, families with 5 or more children have the lowest poverty rate of 0.0%, which includes 0 families.
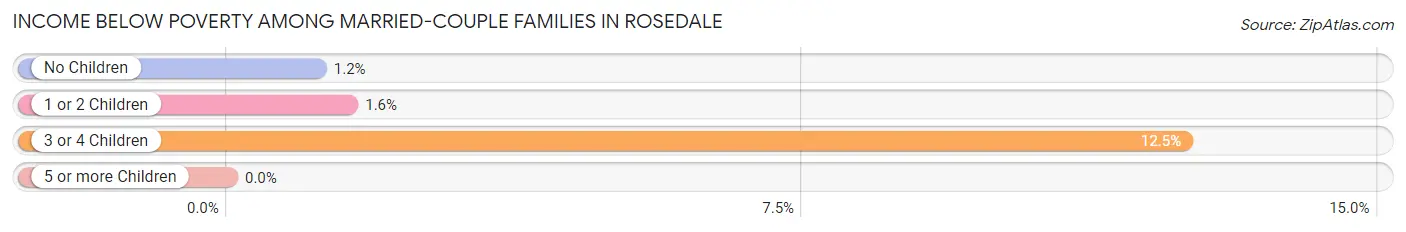
| Children | Above Poverty | Below Poverty |
| No Children | 2,307 (98.8%) | 27 (1.2%) |
| 1 or 2 Children | 1,564 (98.4%) | 25 (1.6%) |
| 3 or 4 Children | 323 (87.5%) | 46 (12.5%) |
| 5 or more Children | 40 (100.0%) | 0 (0.0%) |
| Total | 4,234 (97.7%) | 98 (2.3%) |
Income Below Poverty Among Single-Parent Households in Rosedale
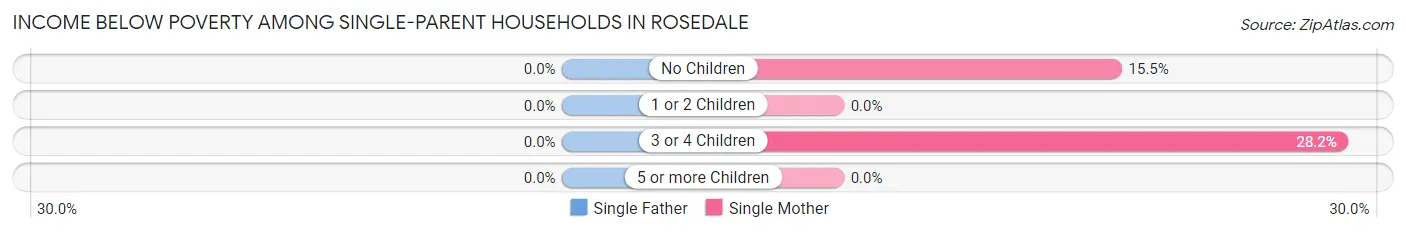
| Children | Single Father | Single Mother |
| No Children | 0 (0.0%) | 16 (15.5%) |
| 1 or 2 Children | 0 (0.0%) | 0 (0.0%) |
| 3 or 4 Children | 0 (0.0%) | 11 (28.2%) |
| 5 or more Children | 0 (0.0%) | 0 (0.0%) |
| Total | 0 (0.0%) | 27 (10.3%) |
Income Below Poverty Among Married-Couple vs Single-Parent Households in Rosedale
The poverty data for Rosedale shows that 98 of the married-couple family households (2.3%) and 27 of the single-parent households (4.3%) are living below the poverty level. Within the married-couple family households, those with 3 or 4 children have the highest poverty rate, with 46 households (12.5%) falling below the poverty line. Among the single-parent households, those with 3 or 4 children have the highest poverty rate, with 11 household (28.2%) living below poverty.
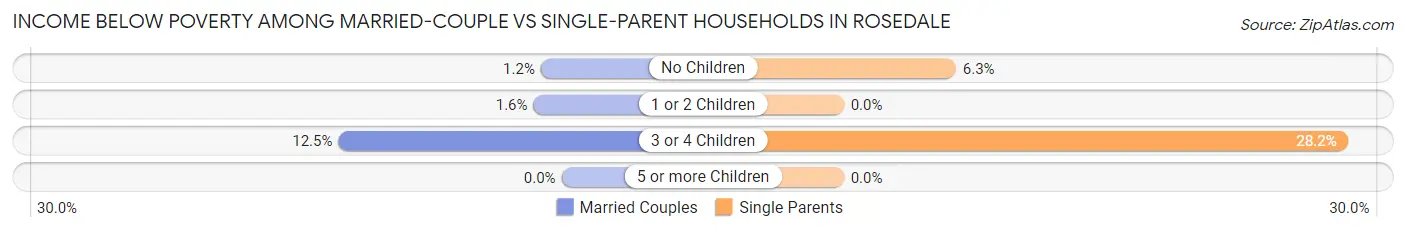
| Children | Married-Couple Families | Single-Parent Households |
| No Children | 27 (1.2%) | 16 (6.3%) |
| 1 or 2 Children | 25 (1.6%) | 0 (0.0%) |
| 3 or 4 Children | 46 (12.5%) | 11 (28.2%) |
| 5 or more Children | 0 (0.0%) | 0 (0.0%) |
| Total | 98 (2.3%) | 27 (4.3%) |
Race in Rosedale
The most populous races in Rosedale are White / Caucasian (15,508 | 80.9%), Hispanic or Latino (3,930 | 20.5%), and Two or more Races (1,530 | 8.0%).
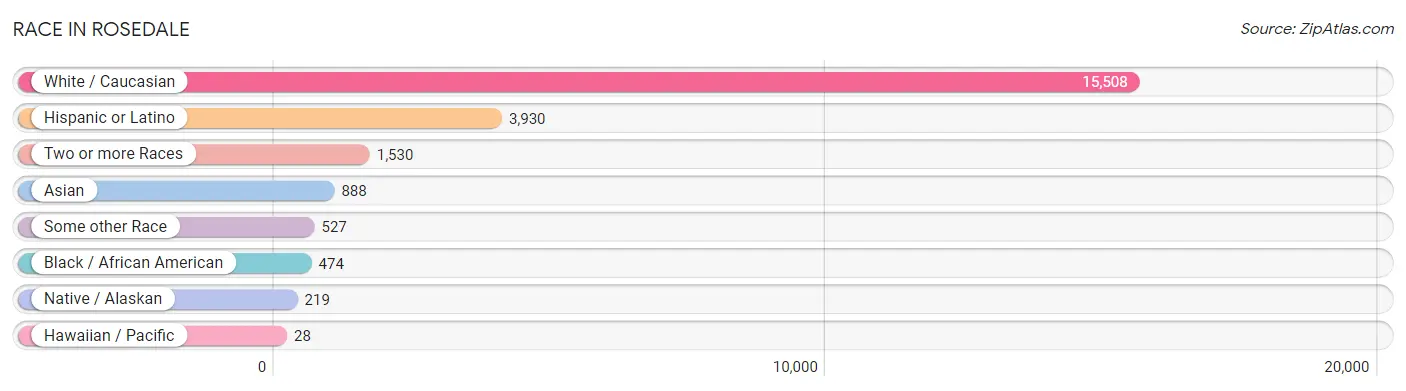
| Race | # Population | % Population |
| Asian | 888 | 4.6% |
| Black / African American | 474 | 2.5% |
| Hawaiian / Pacific | 28 | 0.2% |
| Hispanic or Latino | 3,930 | 20.5% |
| Native / Alaskan | 219 | 1.1% |
| White / Caucasian | 15,508 | 80.9% |
| Two or more Races | 1,530 | 8.0% |
| Some other Race | 527 | 2.8% |
| Total | 19,174 | 100.0% |
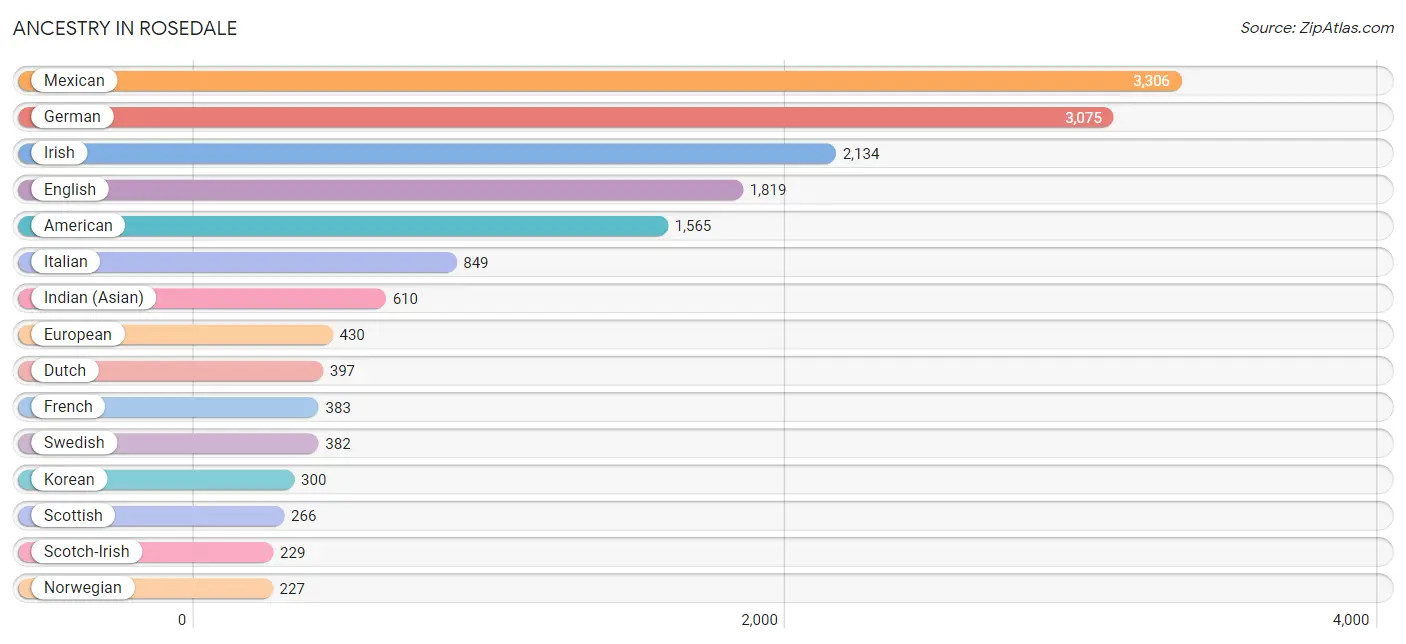
Ancestry in Rosedale
The most populous ancestries reported in Rosedale are Mexican (3,306 | 17.2%), German (3,075 | 16.0%), Irish (2,134 | 11.1%), English (1,819 | 9.5%), and American (1,565 | 8.2%), together accounting for 62.1% of all Rosedale residents.
| Ancestry | # Population | % Population |
| African | 28 | 0.2% |
| American | 1,565 | 8.2% |
| Apache | 4 | 0.0% |
| Argentinean | 29 | 0.2% |
| Armenian | 78 | 0.4% |
| Basque | 160 | 0.8% |
| Belizean | 7 | 0.0% |
| Bhutanese | 89 | 0.5% |
| Blackfeet | 37 | 0.2% |
| British | 24 | 0.1% |
| Cajun | 122 | 0.6% |
| Canadian | 22 | 0.1% |
| Central American | 40 | 0.2% |
| Cherokee | 167 | 0.9% |
| Choctaw | 214 | 1.1% |
| Croatian | 139 | 0.7% |
| Cuban | 62 | 0.3% |
| Czech | 45 | 0.2% |
| Danish | 54 | 0.3% |
| Dutch | 397 | 2.1% |
| Dutch West Indian | 12 | 0.1% |
| Eastern European | 52 | 0.3% |
| English | 1,819 | 9.5% |
| European | 430 | 2.2% |
| Finnish | 20 | 0.1% |
| French | 383 | 2.0% |
| French Canadian | 42 | 0.2% |
| German | 3,075 | 16.0% |
| Greek | 63 | 0.3% |
| Honduran | 33 | 0.2% |
| Indian (Asian) | 610 | 3.2% |
| Indonesian | 119 | 0.6% |
| Irish | 2,134 | 11.1% |
| Italian | 849 | 4.4% |
| Korean | 300 | 1.6% |
| Latvian | 12 | 0.1% |
| Mexican | 3,306 | 17.2% |
| Mexican American Indian | 46 | 0.2% |
| Native Hawaiian | 101 | 0.5% |
| Nigerian | 48 | 0.3% |
| Northern European | 8 | 0.0% |
| Norwegian | 227 | 1.2% |
| Pakistani | 40 | 0.2% |
| Polish | 128 | 0.7% |
| Portuguese | 50 | 0.3% |
| Puerto Rican | 173 | 0.9% |
| Scandinavian | 47 | 0.3% |
| Scotch-Irish | 229 | 1.2% |
| Scottish | 266 | 1.4% |
| Slavic | 11 | 0.1% |
| Slovak | 13 | 0.1% |
| South African | 15 | 0.1% |
| South American | 29 | 0.2% |
| Spaniard | 98 | 0.5% |
| Sri Lankan | 100 | 0.5% |
| Subsaharan African | 91 | 0.5% |
| Swedish | 382 | 2.0% |
| Swiss | 162 | 0.8% |
| Thai | 171 | 0.9% |
| Welsh | 133 | 0.7% |
| Yugoslavian | 45 | 0.2% | View All 61 Rows |
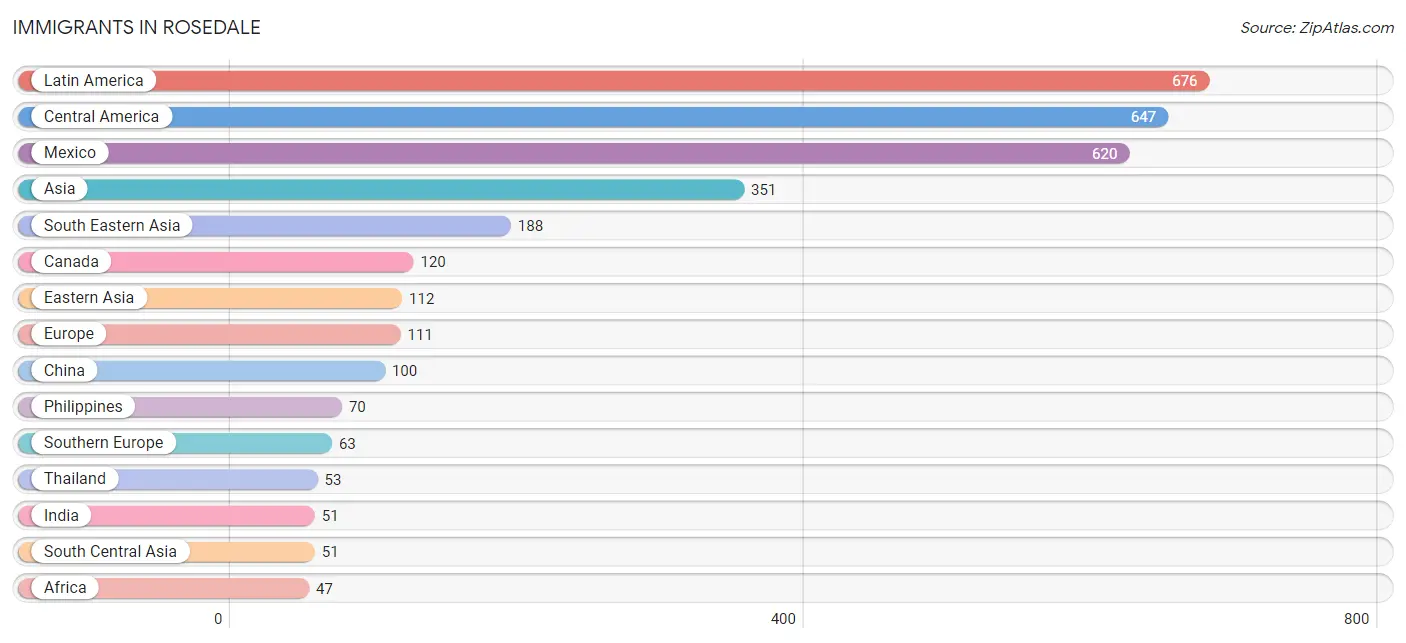
Immigrants in Rosedale
The most numerous immigrant groups reported in Rosedale came from Latin America (676 | 3.5%), Central America (647 | 3.4%), Mexico (620 | 3.2%), Asia (351 | 1.8%), and South Eastern Asia (188 | 1.0%), together accounting for 12.9% of all Rosedale residents.
| Immigration Origin | # Population | % Population |
| Africa | 47 | 0.3% |
| Asia | 351 | 1.8% |
| Belize | 7 | 0.0% |
| Canada | 120 | 0.6% |
| Central America | 647 | 3.4% |
| China | 100 | 0.5% |
| Eastern Africa | 26 | 0.1% |
| Eastern Asia | 112 | 0.6% |
| Ecuador | 29 | 0.2% |
| England | 19 | 0.1% |
| Europe | 111 | 0.6% |
| Fiji | 21 | 0.1% |
| France | 11 | 0.1% |
| Germany | 8 | 0.0% |
| Greece | 38 | 0.2% |
| Honduras | 20 | 0.1% |
| India | 51 | 0.3% |
| Italy | 14 | 0.1% |
| Kenya | 26 | 0.1% |
| Korea | 12 | 0.1% |
| Latin America | 676 | 3.5% |
| Mexico | 620 | 3.2% |
| Northern Europe | 23 | 0.1% |
| Oceania | 21 | 0.1% |
| Philippines | 70 | 0.4% |
| South Africa | 21 | 0.1% |
| South America | 29 | 0.2% |
| South Central Asia | 51 | 0.3% |
| South Eastern Asia | 188 | 1.0% |
| Southern Europe | 63 | 0.3% |
| Spain | 11 | 0.1% |
| Switzerland | 6 | 0.0% |
| Taiwan | 12 | 0.1% |
| Thailand | 53 | 0.3% |
| Vietnam | 19 | 0.1% |
| Western Europe | 25 | 0.1% | View All 36 Rows |
Sex and Age in Rosedale
Sex and Age in Rosedale
The most populous age groups in Rosedale are 20 to 24 Years (1,099 | 10.9%) for men and 5 to 9 Years (881 | 9.7%) for women.
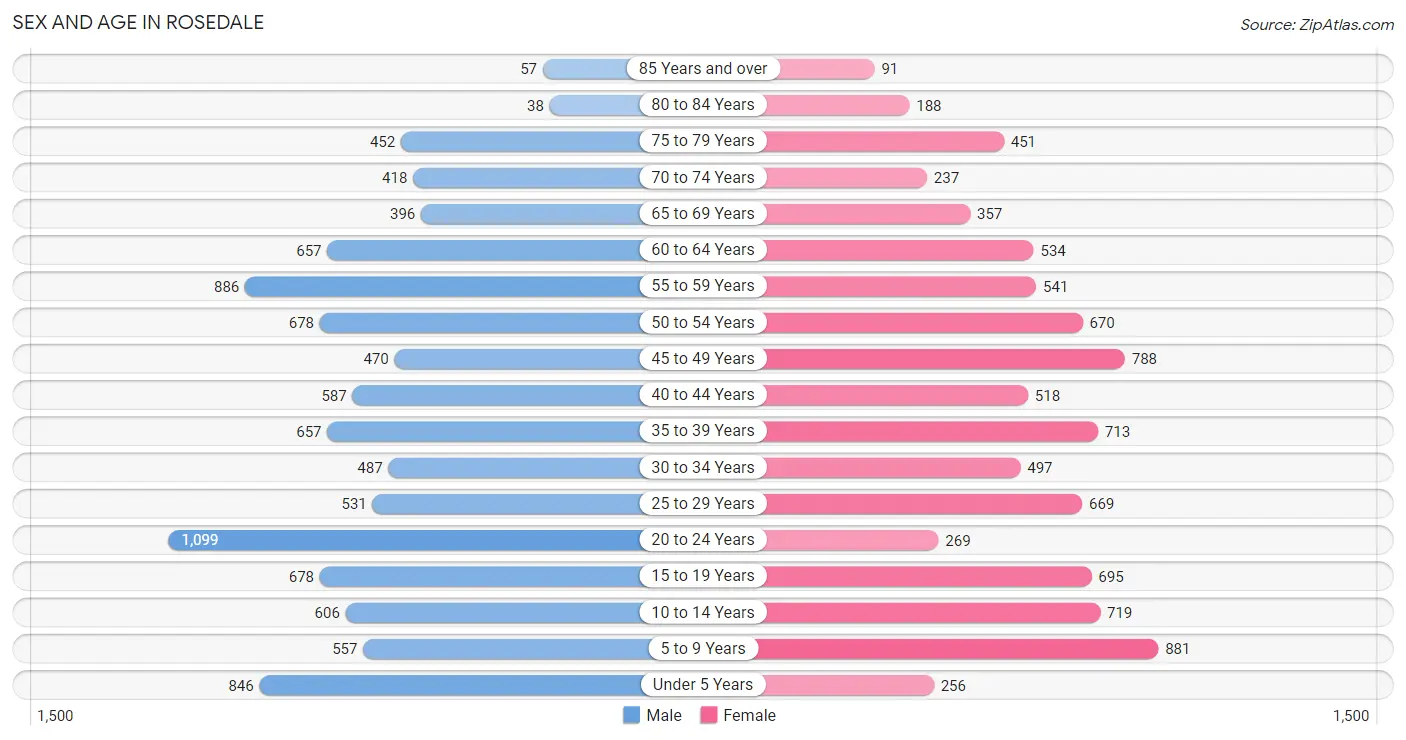
| Age Bracket | Male | Female |
| Under 5 Years | 846 (8.4%) | 256 (2.8%) |
| 5 to 9 Years | 557 (5.5%) | 881 (9.7%) |
| 10 to 14 Years | 606 (6.0%) | 719 (7.9%) |
| 15 to 19 Years | 678 (6.7%) | 695 (7.7%) |
| 20 to 24 Years | 1,099 (10.9%) | 269 (3.0%) |
| 25 to 29 Years | 531 (5.3%) | 669 (7.4%) |
| 30 to 34 Years | 487 (4.8%) | 497 (5.5%) |
| 35 to 39 Years | 657 (6.5%) | 713 (7.9%) |
| 40 to 44 Years | 587 (5.8%) | 518 (5.7%) |
| 45 to 49 Years | 470 (4.6%) | 788 (8.7%) |
| 50 to 54 Years | 678 (6.7%) | 670 (7.4%) |
| 55 to 59 Years | 886 (8.8%) | 541 (6.0%) |
| 60 to 64 Years | 657 (6.5%) | 534 (5.9%) |
| 65 to 69 Years | 396 (3.9%) | 357 (3.9%) |
| 70 to 74 Years | 418 (4.1%) | 237 (2.6%) |
| 75 to 79 Years | 452 (4.5%) | 451 (5.0%) |
| 80 to 84 Years | 38 (0.4%) | 188 (2.1%) |
| 85 Years and over | 57 (0.6%) | 91 (1.0%) |
| Total | 10,100 (100.0%) | 9,074 (100.0%) |
Families and Households in Rosedale
Median Family Size in Rosedale
The median family size in Rosedale is 3.50 persons per family, with single male/father families (369 | 7.4%) accounting for the largest median family size of 3.81 persons per family. On the other hand, single female/mother families (262 | 5.3%) represent the smallest median family size with 3.11 persons per family.
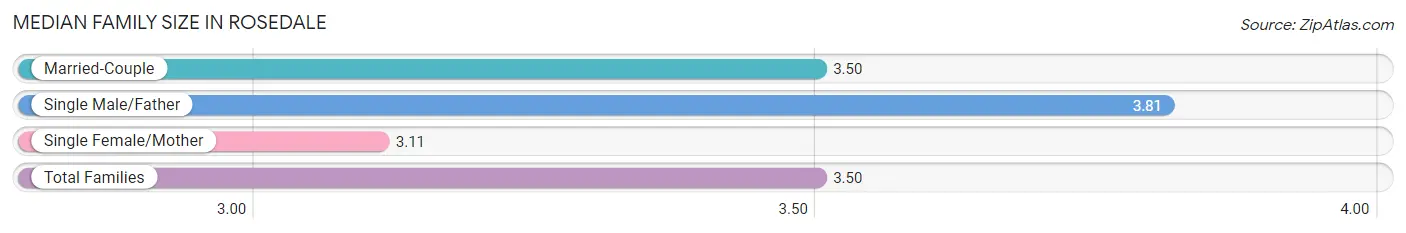
| Family Type | # Families | Family Size |
| Married-Couple | 4,332 (87.3%) | 3.50 |
| Single Male/Father | 369 (7.4%) | 3.81 |
| Single Female/Mother | 262 (5.3%) | 3.11 |
| Total Families | 4,963 (100.0%) | 3.50 |
Median Household Size in Rosedale
The median household size in Rosedale is 3.06 persons per household, with single male/father households (369 | 5.9%) accounting for the largest median household size of 4.18 persons per household. non-family households (1,289 | 20.6%) represent the smallest median household size with 1.16 persons per household.
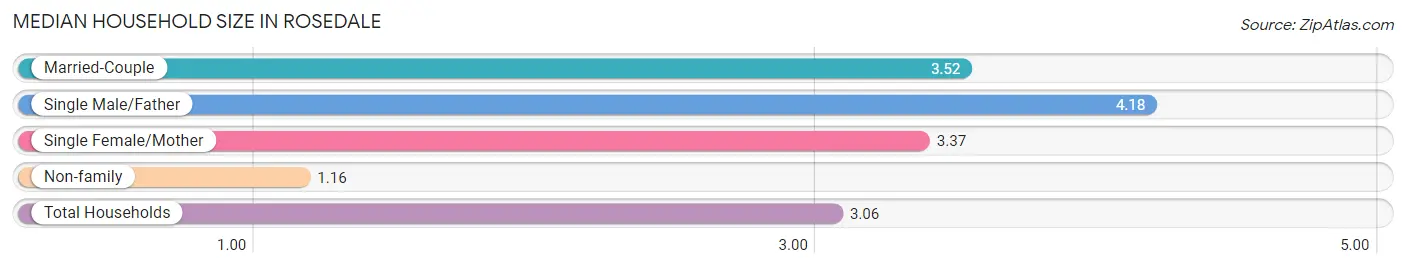
| Household Type | # Households | Household Size |
| Married-Couple | 4,332 (69.3%) | 3.52 |
| Single Male/Father | 369 (5.9%) | 4.18 |
| Single Female/Mother | 262 (4.2%) | 3.37 |
| Non-family | 1,289 (20.6%) | 1.16 |
| Total Households | 6,252 (100.0%) | 3.06 |
Household Size by Marriage Status in Rosedale
Out of a total of 6,252 households in Rosedale, 4,963 (79.4%) are family households, while 1,289 (20.6%) are nonfamily households. The most numerous type of family households are 2-person households, comprising 1,808, and the most common type of nonfamily households are 1-person households, comprising 1,105.
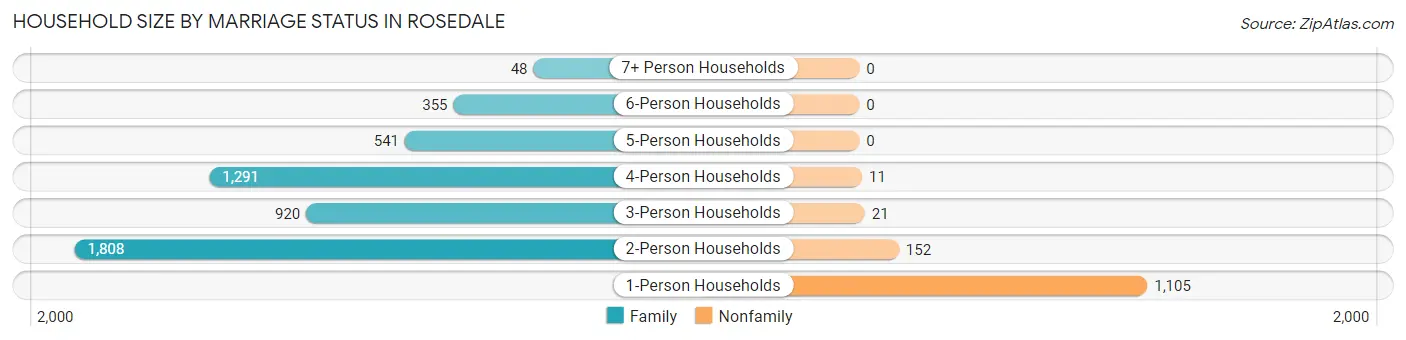
| Household Size | Family Households | Nonfamily Households |
| 1-Person Households | - | 1,105 (17.7%) |
| 2-Person Households | 1,808 (28.9%) | 152 (2.4%) |
| 3-Person Households | 920 (14.7%) | 21 (0.3%) |
| 4-Person Households | 1,291 (20.6%) | 11 (0.2%) |
| 5-Person Households | 541 (8.6%) | 0 (0.0%) |
| 6-Person Households | 355 (5.7%) | 0 (0.0%) |
| 7+ Person Households | 48 (0.8%) | 0 (0.0%) |
| Total | 4,963 (79.4%) | 1,289 (20.6%) |
Female Fertility in Rosedale
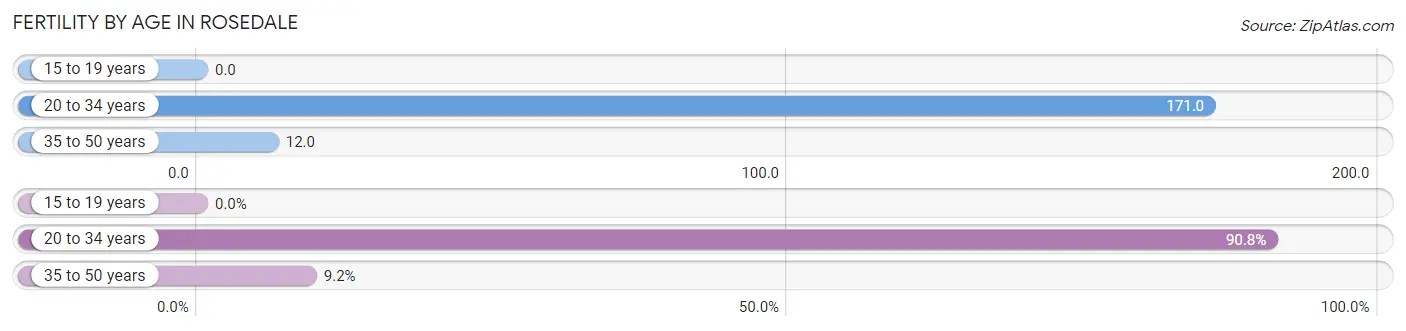
Fertility by Age in Rosedale
Average fertility rate in Rosedale is 64.0 births per 1,000 women. Women in the age bracket of 20 to 34 years have the highest fertility rate with 171.0 births per 1,000 women. Women in the age bracket of 20 to 34 years acount for 90.8% of all women with births.
| Age Bracket | Women with Births | Births / 1,000 Women |
| 15 to 19 years | 0 (0.0%) | 0.0 |
| 20 to 34 years | 246 (90.8%) | 171.0 |
| 35 to 50 years | 25 (9.2%) | 12.0 |
| Total | 271 (100.0%) | 64.0 |
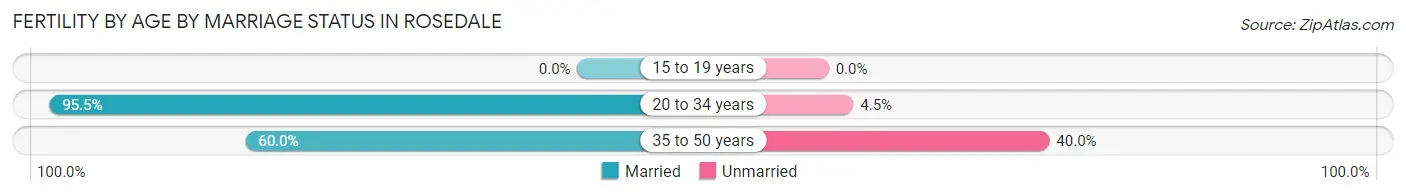
Fertility by Age by Marriage Status in Rosedale
92.3% of women with births (271) in Rosedale are married. The highest percentage of unmarried women with births falls into 35 to 50 years age bracket with 40.0% of them unmarried at the time of birth, while the lowest percentage of unmarried women with births belong to 20 to 34 years age bracket with 4.5% of them unmarried.
| Age Bracket | Married | Unmarried |
| 15 to 19 years | 0 (0.0%) | 0 (0.0%) |
| 20 to 34 years | 235 (95.5%) | 11 (4.5%) |
| 35 to 50 years | 15 (60.0%) | 10 (40.0%) |
| Total | 250 (92.2%) | 21 (7.7%) |
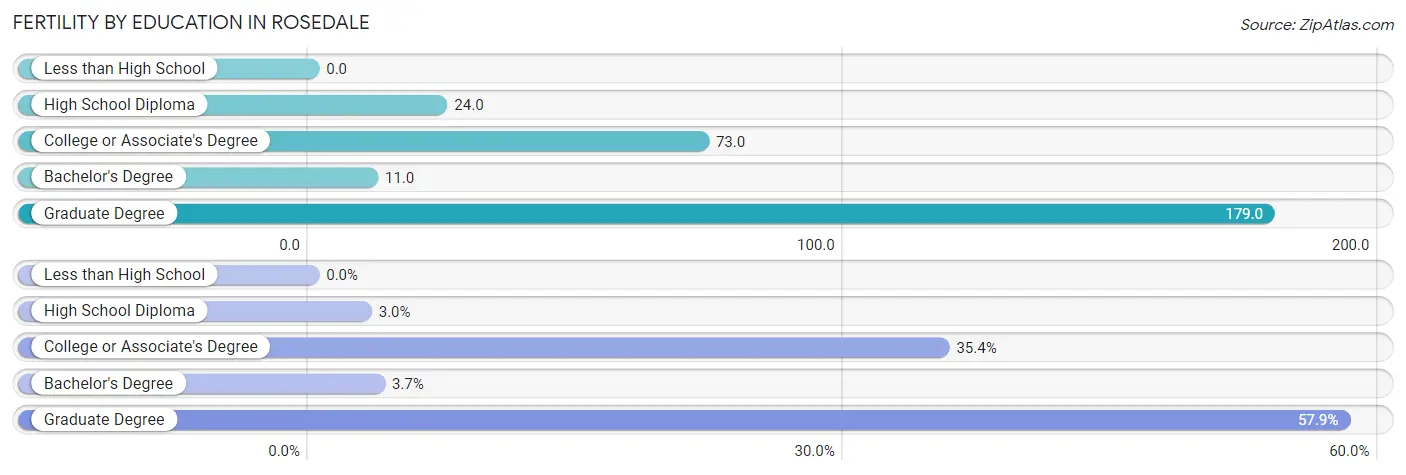
Fertility by Education in Rosedale
| Educational Attainment | Women with Births | Births / 1,000 Women |
| Less than High School | 0 (0.0%) | 0.0 |
| High School Diploma | 8 (2.9%) | 24.0 |
| College or Associate's Degree | 96 (35.4%) | 73.0 |
| Bachelor's Degree | 10 (3.7%) | 11.0 |
| Graduate Degree | 157 (57.9%) | 179.0 |
| Total | 271 (100.0%) | 64.0 |
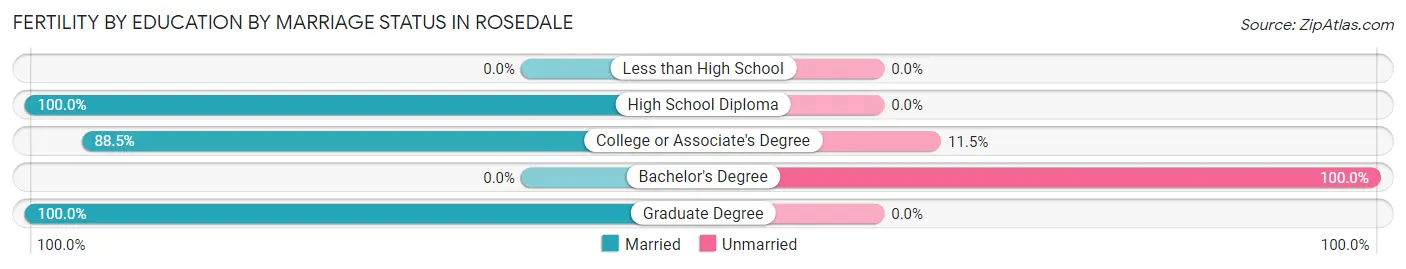
Fertility by Education by Marriage Status in Rosedale
7.7% of women with births in Rosedale are unmarried. Women with the educational attainment of high school diploma are most likely to be married with 100.0% of them married at childbirth, while women with the educational attainment of bachelor's degree are least likely to be married with 100.0% of them unmarried at childbirth.
| Educational Attainment | Married | Unmarried |
| Less than High School | 0 (0.0%) | 0 (0.0%) |
| High School Diploma | 8 (100.0%) | 0 (0.0%) |
| College or Associate's Degree | 85 (88.5%) | 11 (11.5%) |
| Bachelor's Degree | 0 (0.0%) | 10 (100.0%) |
| Graduate Degree | 157 (100.0%) | 0 (0.0%) |
| Total | 250 (92.2%) | 21 (7.7%) |
Employment Characteristics in Rosedale
Employment by Class of Employer in Rosedale
Among the 8,737 employed individuals in Rosedale, private company employees (4,446 | 50.9%), local government employees (1,274 | 14.6%), and self-employed (not incorporated) (890 | 10.2%) make up the most common classes of employment.
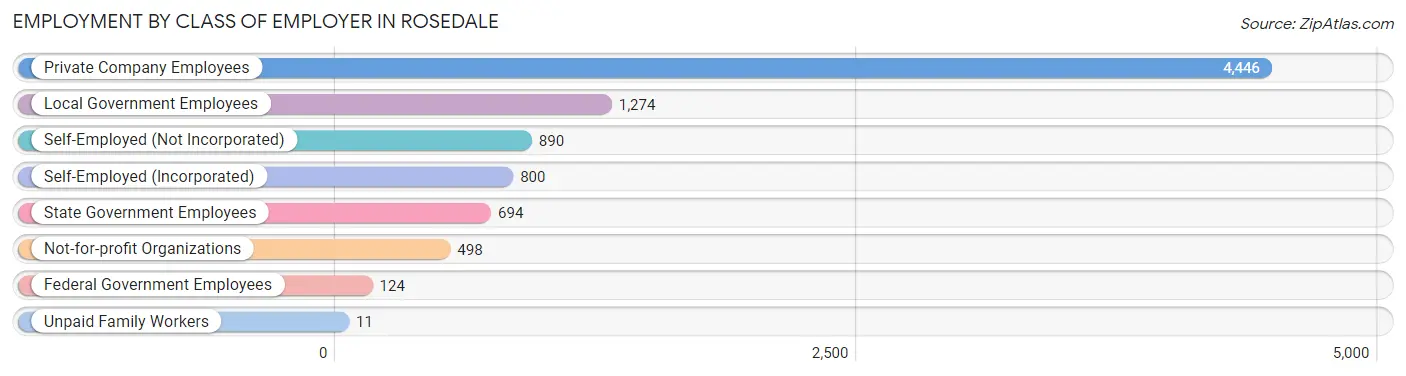
| Employer Class | # Employees | % Employees |
| Private Company Employees | 4,446 | 50.9% |
| Self-Employed (Incorporated) | 800 | 9.2% |
| Self-Employed (Not Incorporated) | 890 | 10.2% |
| Not-for-profit Organizations | 498 | 5.7% |
| Local Government Employees | 1,274 | 14.6% |
| State Government Employees | 694 | 7.9% |
| Federal Government Employees | 124 | 1.4% |
| Unpaid Family Workers | 11 | 0.1% |
| Total | 8,737 | 100.0% |
Employment Status by Age in Rosedale
According to the labor force statistics for Rosedale, out of the total population over 16 years of age (15,094), 62.4% or 9,419 individuals are in the labor force, with 3.2% or 301 of them unemployed. The age group with the highest labor force participation rate is 35 to 44 years, with 89.0% or 2,203 individuals in the labor force. Within the labor force, the 20 to 24 years age range has the highest percentage of unemployed individuals, with 22.5% or 105 of them being unemployed.
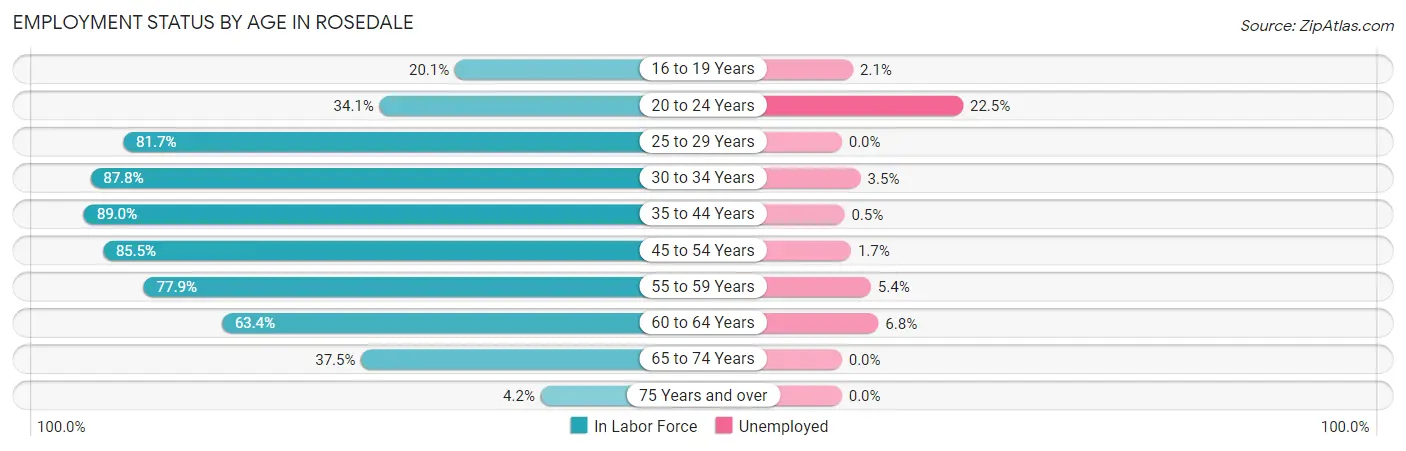
| Age Bracket | In Labor Force | Unemployed |
| 16 to 19 Years | 233 (20.1%) | 5 (2.1%) |
| 20 to 24 Years | 466 (34.1%) | 105 (22.5%) |
| 25 to 29 Years | 980 (81.7%) | 0 (0.0%) |
| 30 to 34 Years | 864 (87.8%) | 30 (3.5%) |
| 35 to 44 Years | 2,203 (89.0%) | 11 (0.5%) |
| 45 to 54 Years | 2,228 (85.5%) | 38 (1.7%) |
| 55 to 59 Years | 1,112 (77.9%) | 60 (5.4%) |
| 60 to 64 Years | 755 (63.4%) | 51 (6.8%) |
| 65 to 74 Years | 528 (37.5%) | 0 (0.0%) |
| 75 Years and over | 54 (4.2%) | 0 (0.0%) |
| Total | 9,419 (62.4%) | 301 (3.2%) |
Employment Status by Educational Attainment in Rosedale
According to labor force statistics for Rosedale, 82.4% of individuals (8,144) out of the total population between 25 and 64 years of age (9,883) are in the labor force, with 2.3% or 187 of them being unemployed. The group with the highest labor force participation rate are those with the educational attainment of bachelor's degree or higher, with 91.8% or 3,928 individuals in the labor force. Within the labor force, individuals with college / associate degree education have the highest percentage of unemployment, with 4.9% or 123 of them being unemployed.
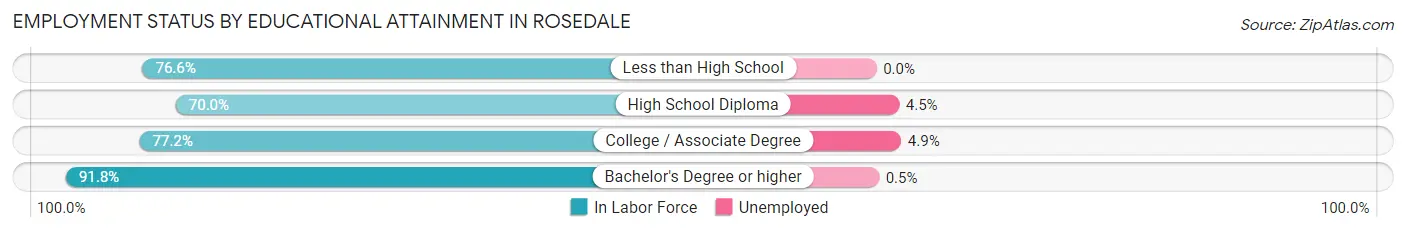
| Educational Attainment | In Labor Force | Unemployed |
| Less than High School | 610 (76.6%) | 0 (0.0%) |
| High School Diploma | 1,096 (70.0%) | 70 (4.5%) |
| College / Associate Degree | 2,503 (77.2%) | 159 (4.9%) |
| Bachelor's Degree or higher | 3,928 (91.8%) | 21 (0.5%) |
| Total | 8,144 (82.4%) | 227 (2.3%) |
Employment Occupations by Sex in Rosedale
Management, Business, Science and Arts Occupations
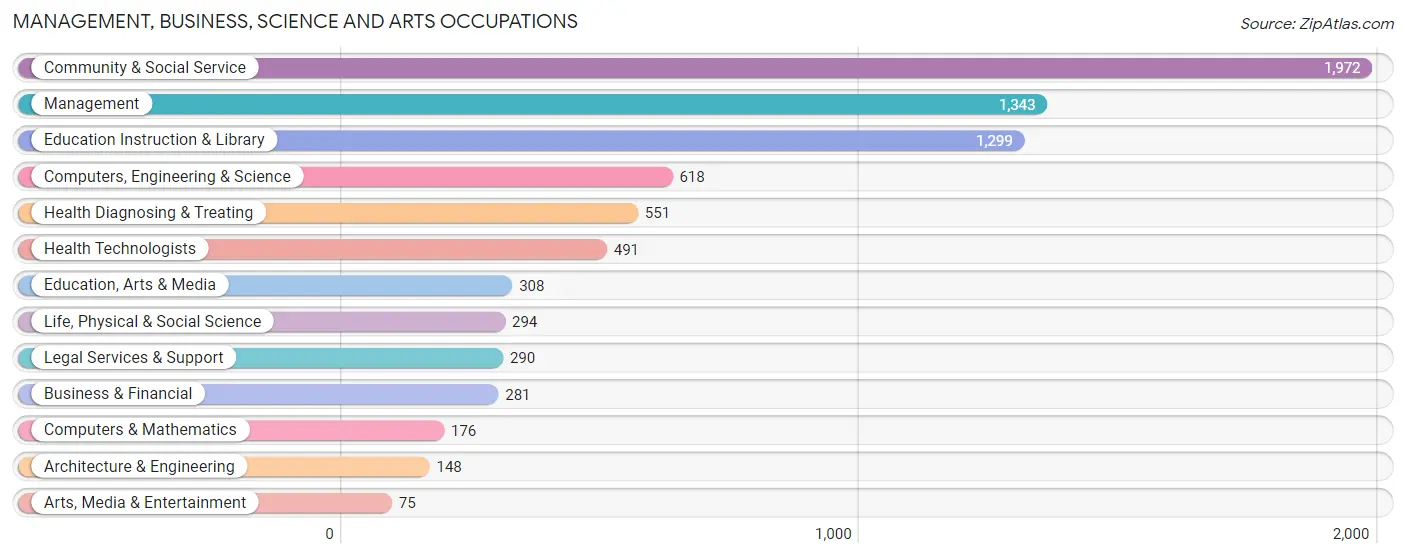
The most common Management, Business, Science and Arts occupations in Rosedale are Community & Social Service (1,972 | 21.6%), Management (1,343 | 14.7%), Education Instruction & Library (1,299 | 14.2%), Computers, Engineering & Science (618 | 6.8%), and Health Diagnosing & Treating (551 | 6.0%).
Management, Business, Science and Arts Occupations by Sex
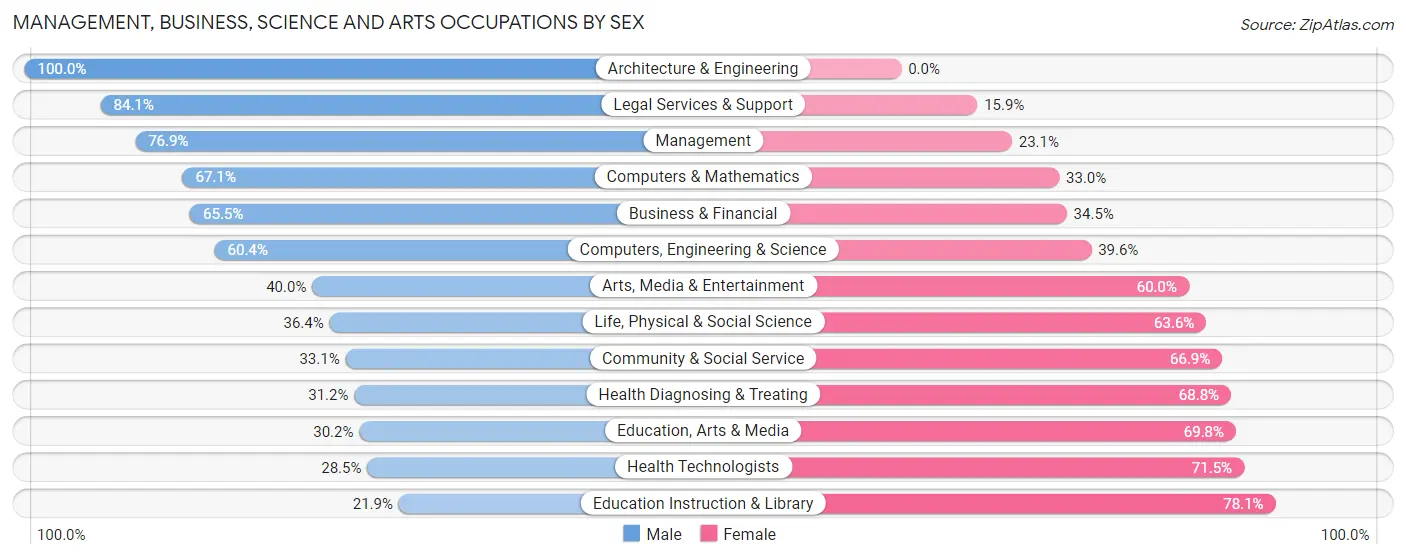
Within the Management, Business, Science and Arts occupations in Rosedale, the most male-oriented occupations are Architecture & Engineering (100.0%), Legal Services & Support (84.1%), and Management (76.9%), while the most female-oriented occupations are Education Instruction & Library (78.1%), Health Technologists (71.5%), and Education, Arts & Media (69.8%).
| Occupation | Male | Female |
| Management | 1,033 (76.9%) | 310 (23.1%) |
| Business & Financial | 184 (65.5%) | 97 (34.5%) |
| Computers, Engineering & Science | 373 (60.4%) | 245 (39.6%) |
| Computers & Mathematics | 118 (67.0%) | 58 (33.0%) |
| Architecture & Engineering | 148 (100.0%) | 0 (0.0%) |
| Life, Physical & Social Science | 107 (36.4%) | 187 (63.6%) |
| Community & Social Service | 652 (33.1%) | 1,320 (66.9%) |
| Education, Arts & Media | 93 (30.2%) | 215 (69.8%) |
| Legal Services & Support | 244 (84.1%) | 46 (15.9%) |
| Education Instruction & Library | 285 (21.9%) | 1,014 (78.1%) |
| Arts, Media & Entertainment | 30 (40.0%) | 45 (60.0%) |
| Health Diagnosing & Treating | 172 (31.2%) | 379 (68.8%) |
| Health Technologists | 140 (28.5%) | 351 (71.5%) |
| Total (Category) | 2,414 (50.7%) | 2,351 (49.3%) |
| Total (Overall) | 5,256 (57.6%) | 3,866 (42.4%) |
Services Occupations
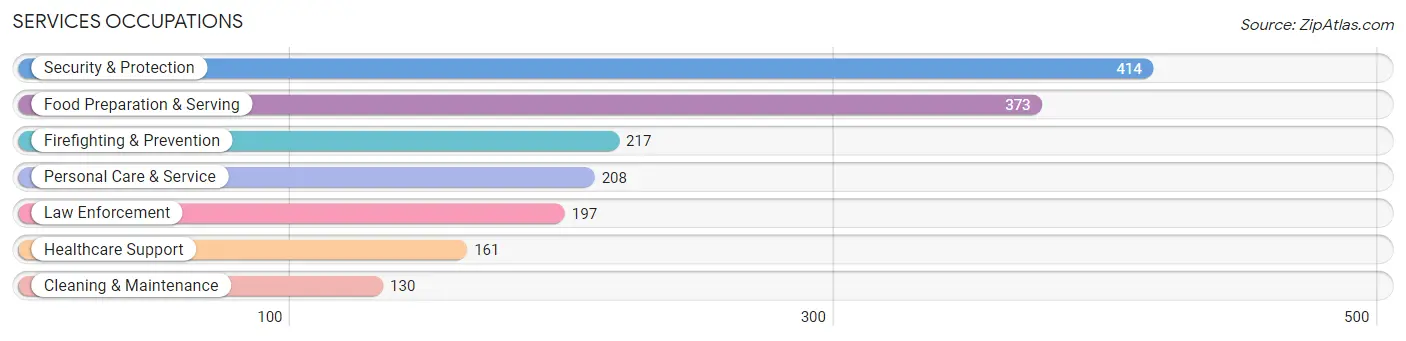
The most common Services occupations in Rosedale are Security & Protection (414 | 4.5%), Food Preparation & Serving (373 | 4.1%), Firefighting & Prevention (217 | 2.4%), Personal Care & Service (208 | 2.3%), and Law Enforcement (197 | 2.2%).
Services Occupations by Sex
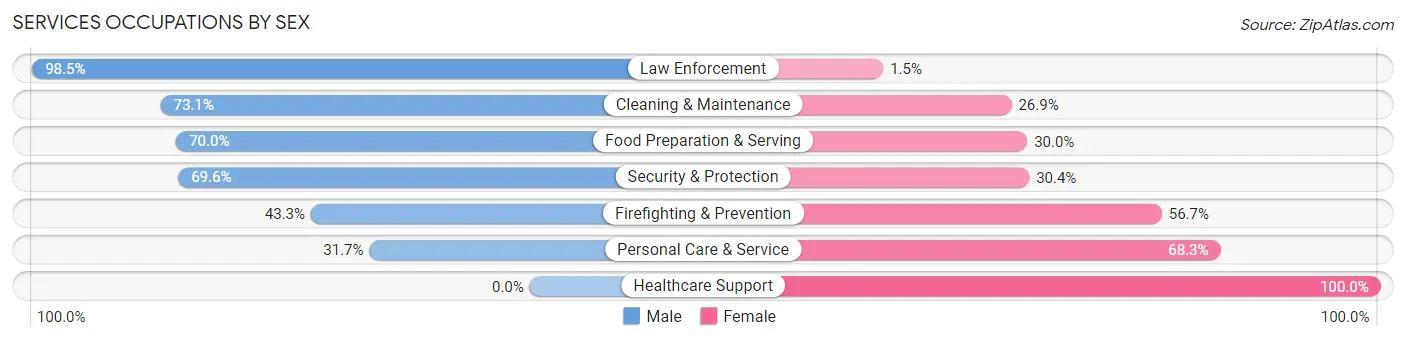
Within the Services occupations in Rosedale, the most male-oriented occupations are Law Enforcement (98.5%), Cleaning & Maintenance (73.1%), and Food Preparation & Serving (70.0%), while the most female-oriented occupations are Healthcare Support (100.0%), Personal Care & Service (68.3%), and Firefighting & Prevention (56.7%).
| Occupation | Male | Female |
| Healthcare Support | 0 (0.0%) | 161 (100.0%) |
| Security & Protection | 288 (69.6%) | 126 (30.4%) |
| Firefighting & Prevention | 94 (43.3%) | 123 (56.7%) |
| Law Enforcement | 194 (98.5%) | 3 (1.5%) |
| Food Preparation & Serving | 261 (70.0%) | 112 (30.0%) |
| Cleaning & Maintenance | 95 (73.1%) | 35 (26.9%) |
| Personal Care & Service | 66 (31.7%) | 142 (68.3%) |
| Total (Category) | 710 (55.2%) | 576 (44.8%) |
| Total (Overall) | 5,256 (57.6%) | 3,866 (42.4%) |
Sales and Office Occupations
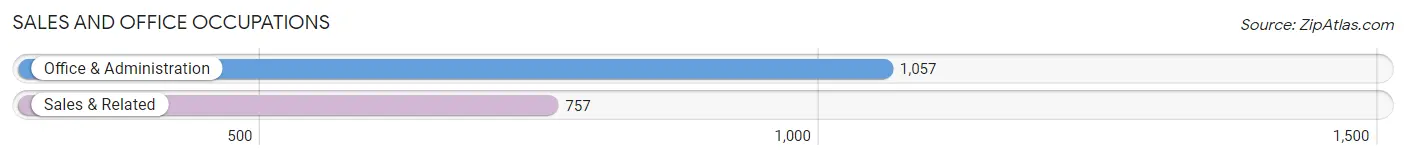
The most common Sales and Office occupations in Rosedale are Office & Administration (1,057 | 11.6%), and Sales & Related (757 | 8.3%).
Sales and Office Occupations by Sex
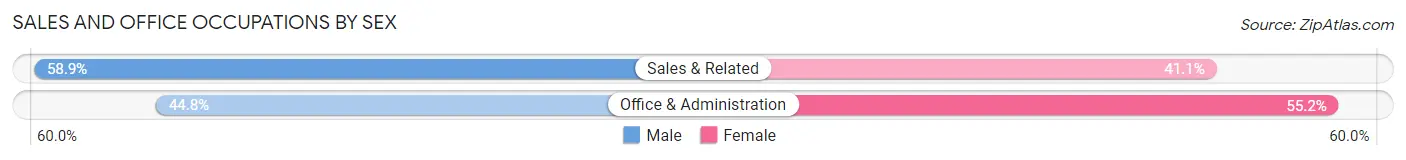
| Occupation | Male | Female |
| Sales & Related | 446 (58.9%) | 311 (41.1%) |
| Office & Administration | 474 (44.8%) | 583 (55.2%) |
| Total (Category) | 920 (50.7%) | 894 (49.3%) |
| Total (Overall) | 5,256 (57.6%) | 3,866 (42.4%) |
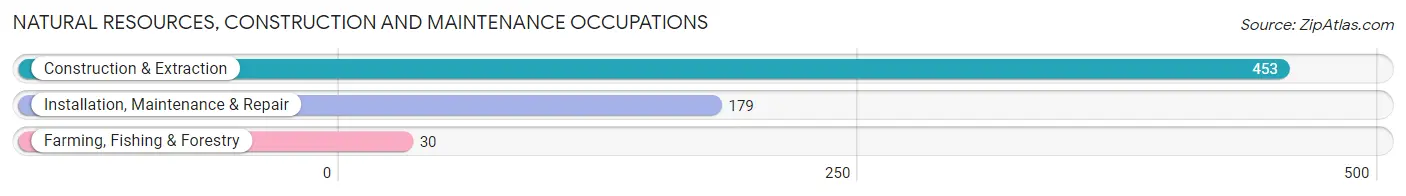
Natural Resources, Construction and Maintenance Occupations
The most common Natural Resources, Construction and Maintenance occupations in Rosedale are Construction & Extraction (453 | 5.0%), Installation, Maintenance & Repair (179 | 2.0%), and Farming, Fishing & Forestry (30 | 0.3%).
Natural Resources, Construction and Maintenance Occupations by Sex
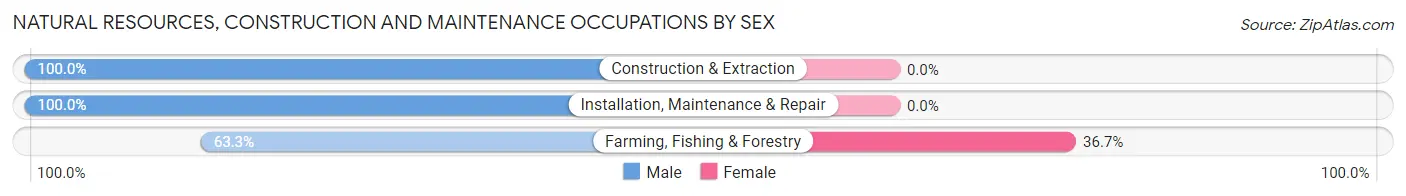
| Occupation | Male | Female |
| Farming, Fishing & Forestry | 19 (63.3%) | 11 (36.7%) |
| Construction & Extraction | 453 (100.0%) | 0 (0.0%) |
| Installation, Maintenance & Repair | 179 (100.0%) | 0 (0.0%) |
| Total (Category) | 651 (98.3%) | 11 (1.7%) |
| Total (Overall) | 5,256 (57.6%) | 3,866 (42.4%) |
Production, Transportation and Moving Occupations
The most common Production, Transportation and Moving occupations in Rosedale are Material Moving (309 | 3.4%), Production (188 | 2.1%), and Transportation (98 | 1.1%).
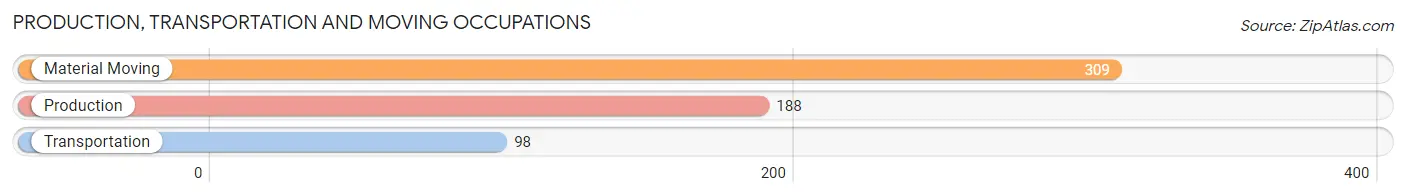
Production, Transportation and Moving Occupations by Sex
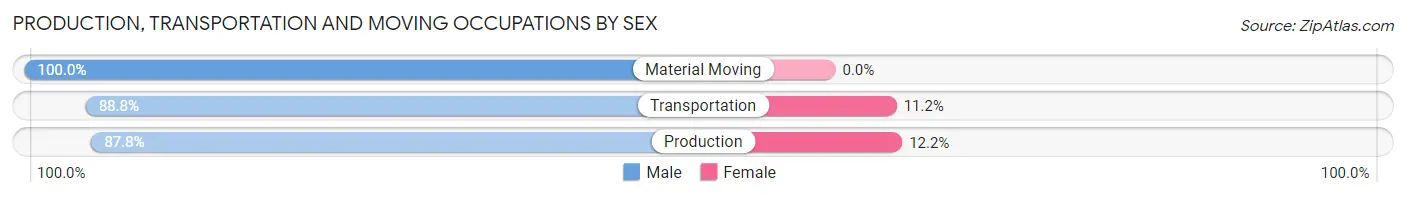
| Occupation | Male | Female |
| Production | 165 (87.8%) | 23 (12.2%) |
| Transportation | 87 (88.8%) | 11 (11.2%) |
| Material Moving | 309 (100.0%) | 0 (0.0%) |
| Total (Category) | 561 (94.3%) | 34 (5.7%) |
| Total (Overall) | 5,256 (57.6%) | 3,866 (42.4%) |
Employment Industries by Sex in Rosedale
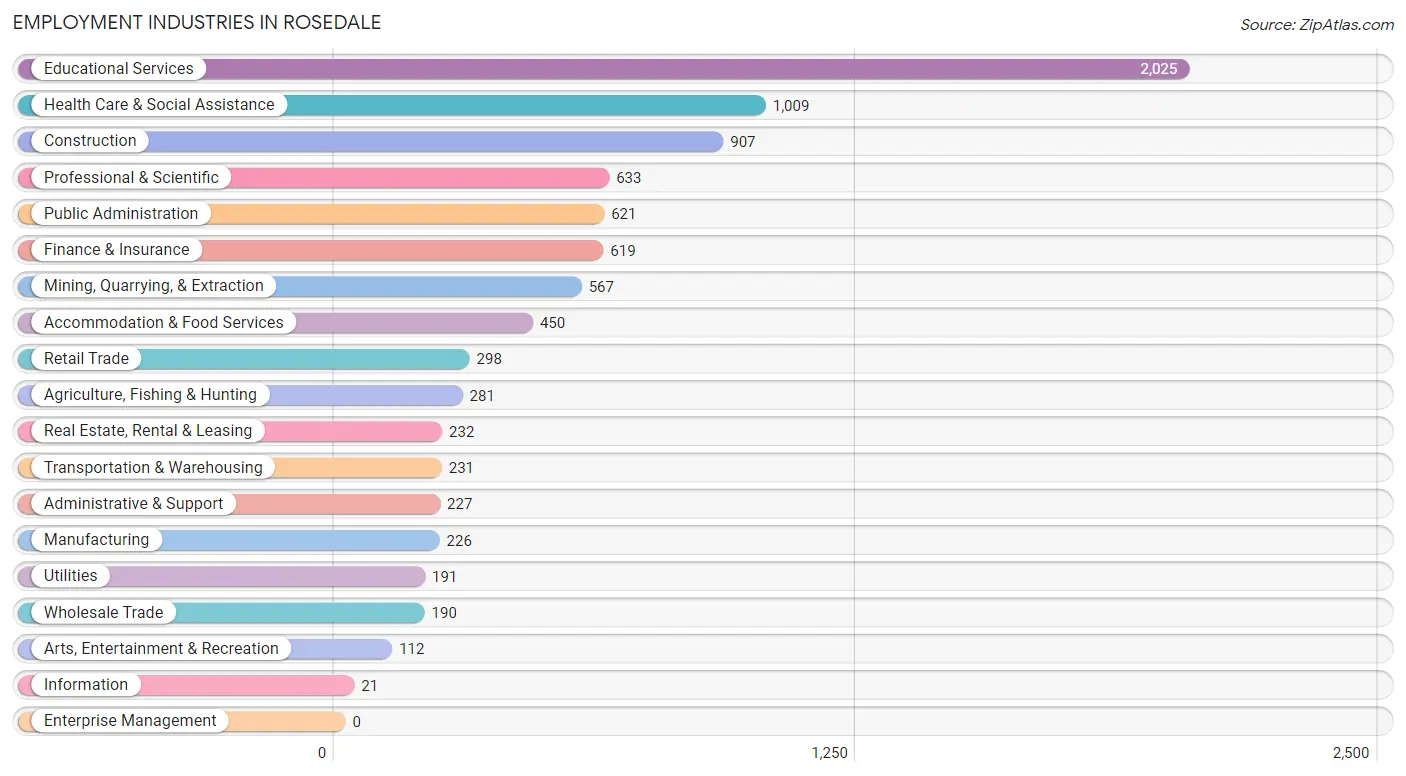
Employment Industries in Rosedale
The major employment industries in Rosedale include Educational Services (2,025 | 22.2%), Health Care & Social Assistance (1,009 | 11.1%), Construction (907 | 9.9%), Professional & Scientific (633 | 6.9%), and Public Administration (621 | 6.8%).
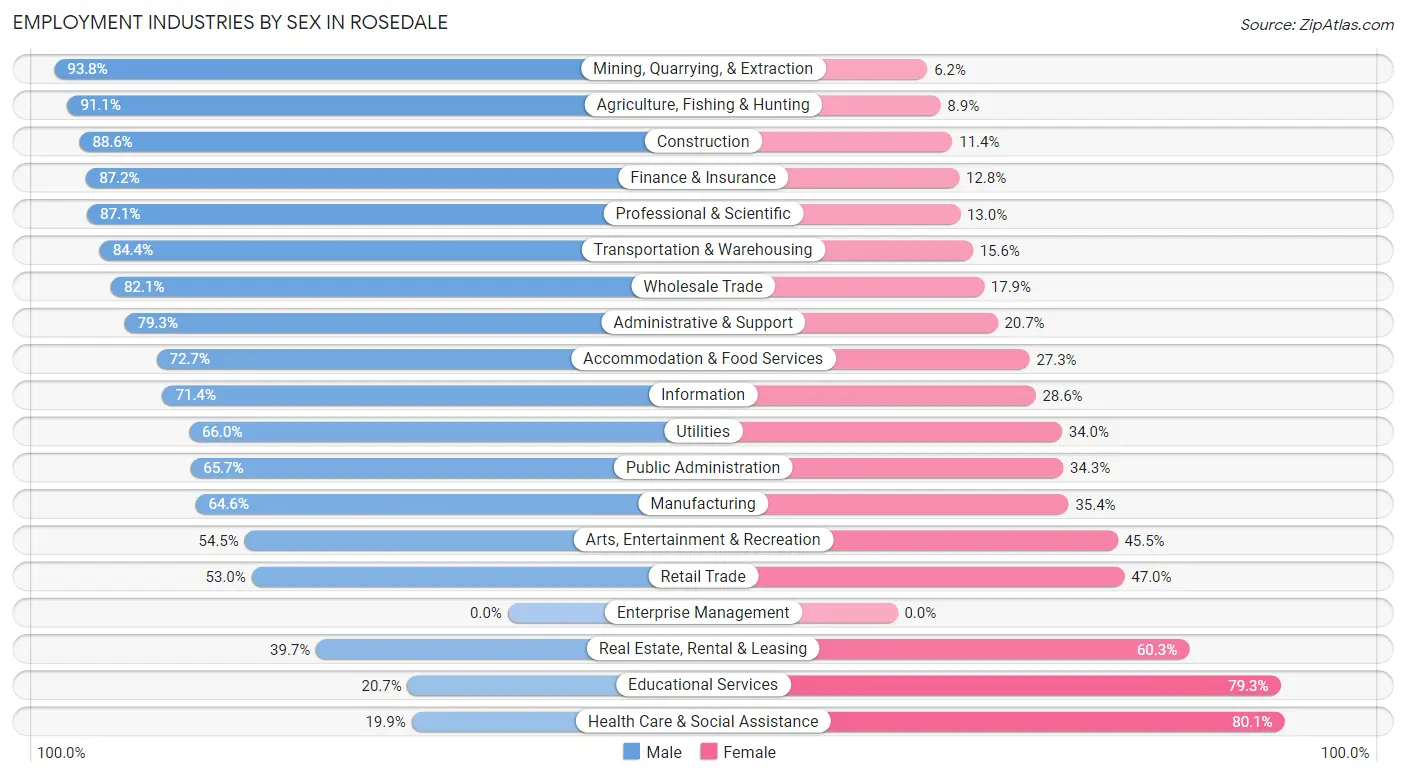
Employment Industries by Sex in Rosedale
The Rosedale industries that see more men than women are Mining, Quarrying, & Extraction (93.8%), Agriculture, Fishing & Hunting (91.1%), and Construction (88.6%), whereas the industries that tend to have a higher number of women are Health Care & Social Assistance (80.1%), Educational Services (79.3%), and Real Estate, Rental & Leasing (60.3%).
| Industry | Male | Female |
| Agriculture, Fishing & Hunting | 256 (91.1%) | 25 (8.9%) |
| Mining, Quarrying, & Extraction | 532 (93.8%) | 35 (6.2%) |
| Construction | 804 (88.6%) | 103 (11.4%) |
| Manufacturing | 146 (64.6%) | 80 (35.4%) |
| Wholesale Trade | 156 (82.1%) | 34 (17.9%) |
| Retail Trade | 158 (53.0%) | 140 (47.0%) |
| Transportation & Warehousing | 195 (84.4%) | 36 (15.6%) |
| Utilities | 126 (66.0%) | 65 (34.0%) |
| Information | 15 (71.4%) | 6 (28.6%) |
| Finance & Insurance | 540 (87.2%) | 79 (12.8%) |
| Real Estate, Rental & Leasing | 92 (39.7%) | 140 (60.3%) |
| Professional & Scientific | 551 (87.1%) | 82 (13.0%) |
| Enterprise Management | 0 (0.0%) | 0 (0.0%) |
| Administrative & Support | 180 (79.3%) | 47 (20.7%) |
| Educational Services | 420 (20.7%) | 1,605 (79.3%) |
| Health Care & Social Assistance | 201 (19.9%) | 808 (80.1%) |
| Arts, Entertainment & Recreation | 61 (54.5%) | 51 (45.5%) |
| Accommodation & Food Services | 327 (72.7%) | 123 (27.3%) |
| Public Administration | 408 (65.7%) | 213 (34.3%) |
| Total | 5,256 (57.6%) | 3,866 (42.4%) |
Education in Rosedale
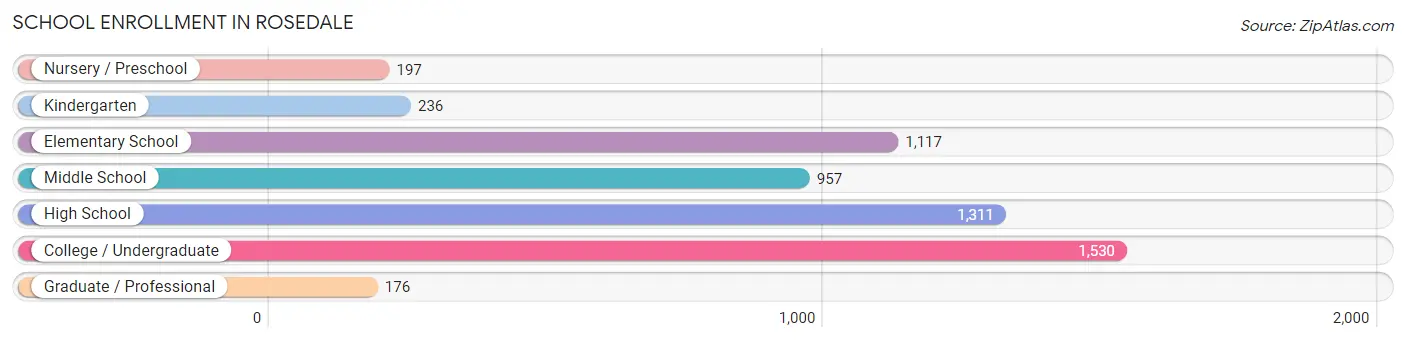
School Enrollment in Rosedale
The most common levels of schooling among the 5,524 students in Rosedale are college / undergraduate (1,530 | 27.7%), high school (1,311 | 23.7%), and elementary school (1,117 | 20.2%).
| School Level | # Students | % Students |
| Nursery / Preschool | 197 | 3.6% |
| Kindergarten | 236 | 4.3% |
| Elementary School | 1,117 | 20.2% |
| Middle School | 957 | 17.3% |
| High School | 1,311 | 23.7% |
| College / Undergraduate | 1,530 | 27.7% |
| Graduate / Professional | 176 | 3.2% |
| Total | 5,524 | 100.0% |
School Enrollment by Age by Funding Source in Rosedale
Out of a total of 5,524 students who are enrolled in schools in Rosedale, 895 (16.2%) attend a private institution, while the remaining 4,629 (83.8%) are enrolled in public schools. The age group of 3 to 4 year olds has the highest likelihood of being enrolled in private schools, with 102 (76.1% in the age bracket) enrolled. Conversely, the age group of 15 to 17 year olds has the lowest likelihood of being enrolled in a private school, with 704 (95.8% in the age bracket) attending a public institution.
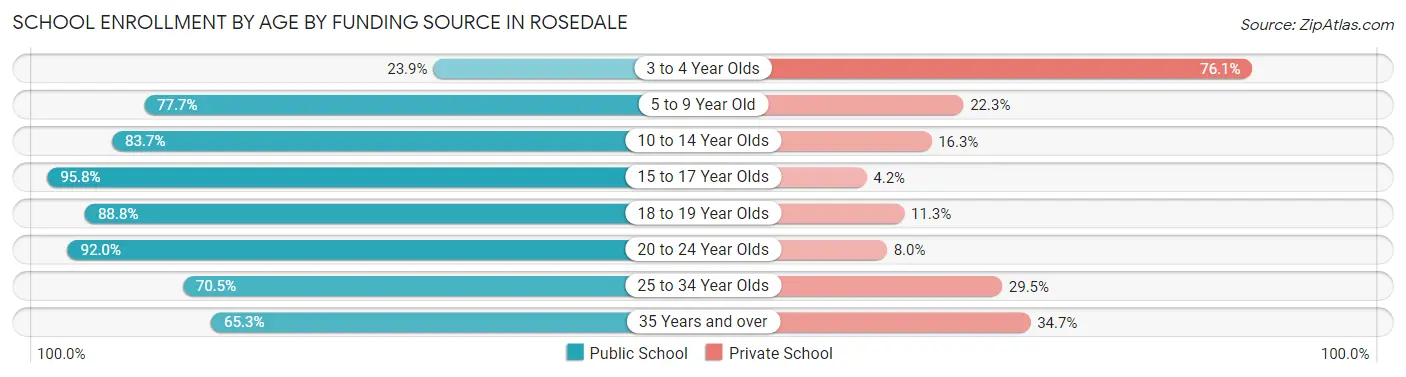
| Age Bracket | Public School | Private School |
| 3 to 4 Year Olds | 32 (23.9%) | 102 (76.1%) |
| 5 to 9 Year Old | 1,033 (77.7%) | 296 (22.3%) |
| 10 to 14 Year Olds | 1,109 (83.7%) | 216 (16.3%) |
| 15 to 17 Year Olds | 704 (95.8%) | 31 (4.2%) |
| 18 to 19 Year Olds | 505 (88.7%) | 64 (11.3%) |
| 20 to 24 Year Olds | 1,055 (92.0%) | 92 (8.0%) |
| 25 to 34 Year Olds | 67 (70.5%) | 28 (29.5%) |
| 35 Years and over | 124 (65.3%) | 66 (34.7%) |
| Total | 4,629 (83.8%) | 895 (16.2%) |
Educational Attainment by Field of Study in Rosedale
Business (1,196 | 23.3%), education (746 | 14.5%), social sciences (474 | 9.2%), arts & humanities (443 | 8.6%), and liberal arts & history (418 | 8.2%) are the most common fields of study among 5,131 individuals in Rosedale who have obtained a bachelor's degree or higher.
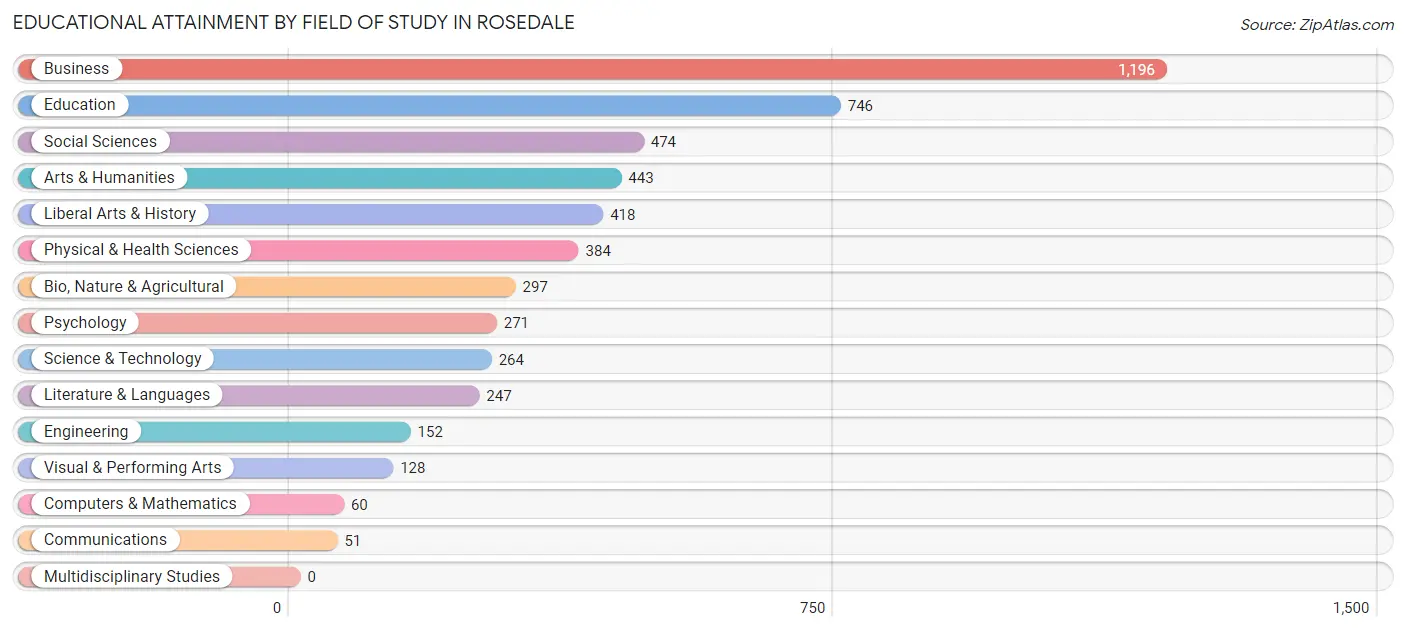
| Field of Study | # Graduates | % Graduates |
| Computers & Mathematics | 60 | 1.2% |
| Bio, Nature & Agricultural | 297 | 5.8% |
| Physical & Health Sciences | 384 | 7.5% |
| Psychology | 271 | 5.3% |
| Social Sciences | 474 | 9.2% |
| Engineering | 152 | 3.0% |
| Multidisciplinary Studies | 0 | 0.0% |
| Science & Technology | 264 | 5.1% |
| Business | 1,196 | 23.3% |
| Education | 746 | 14.5% |
| Literature & Languages | 247 | 4.8% |
| Liberal Arts & History | 418 | 8.2% |
| Visual & Performing Arts | 128 | 2.5% |
| Communications | 51 | 1.0% |
| Arts & Humanities | 443 | 8.6% |
| Total | 5,131 | 100.0% |
Transportation & Commute in Rosedale
Vehicle Availability by Sex in Rosedale
The most prevalent vehicle ownership categories in Rosedale are males with 2 vehicles (1,651, accounting for 31.6%) and females with 2 vehicles (1,302, making up 47.1%).
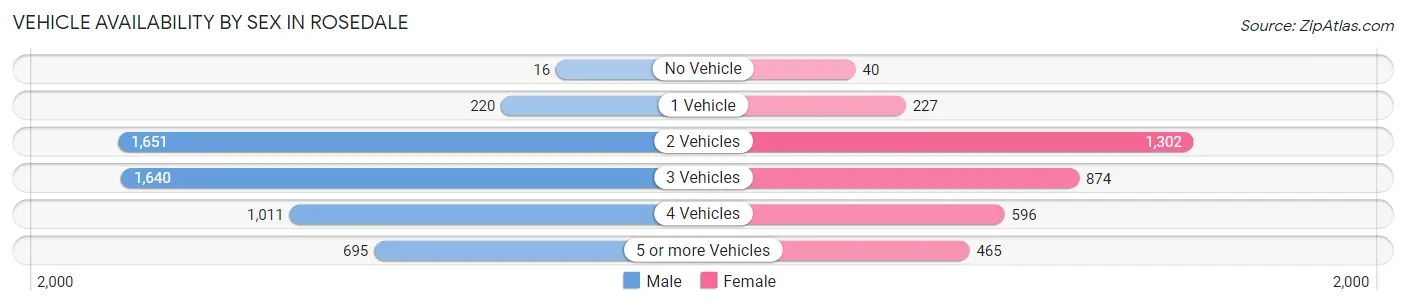
| Vehicles Available | Male | Female |
| No Vehicle | 16 (0.3%) | 40 (1.1%) |
| 1 Vehicle | 220 (4.2%) | 227 (6.5%) |
| 2 Vehicles | 1,651 (31.6%) | 1,302 (37.2%) |
| 3 Vehicles | 1,640 (31.3%) | 874 (24.9%) |
| 4 Vehicles | 1,011 (19.3%) | 596 (17.0%) |
| 5 or more Vehicles | 695 (13.3%) | 465 (13.3%) |
| Total | 5,233 (100.0%) | 3,504 (100.0%) |
Commute Time in Rosedale
The most frequently occuring commute durations in Rosedale are 20 to 24 minutes (1,728 commuters, 21.6%), 15 to 19 minutes (1,318 commuters, 16.5%), and 25 to 29 minutes (1,025 commuters, 12.8%).
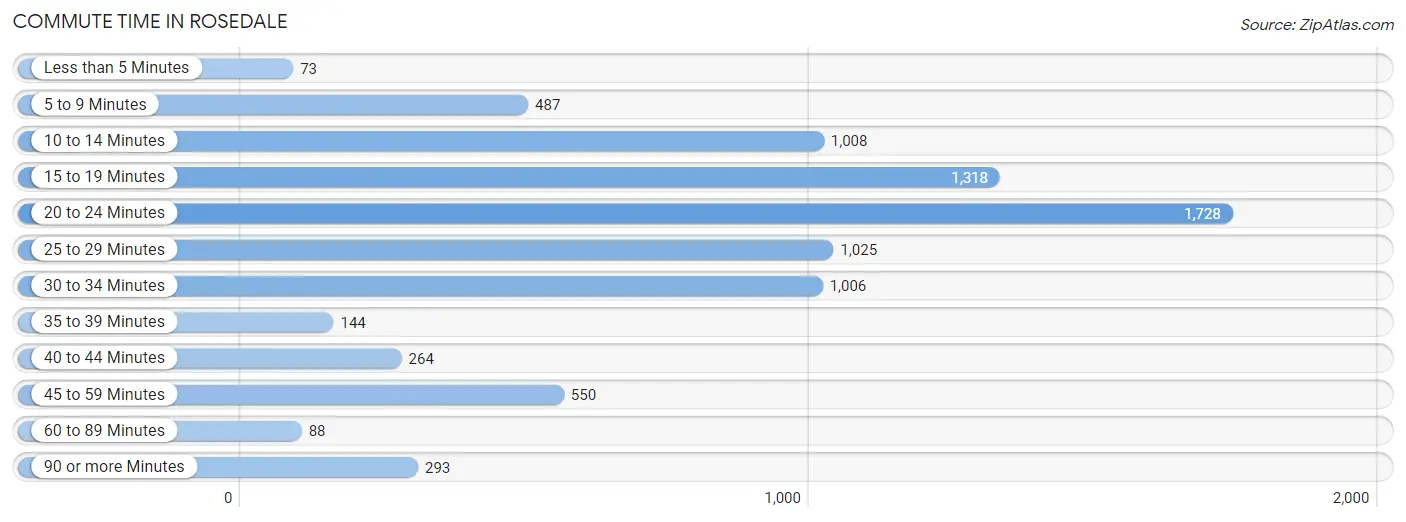
| Commute Time | # Commuters | % Commuters |
| Less than 5 Minutes | 73 | 0.9% |
| 5 to 9 Minutes | 487 | 6.1% |
| 10 to 14 Minutes | 1,008 | 12.6% |
| 15 to 19 Minutes | 1,318 | 16.5% |
| 20 to 24 Minutes | 1,728 | 21.6% |
| 25 to 29 Minutes | 1,025 | 12.8% |
| 30 to 34 Minutes | 1,006 | 12.6% |
| 35 to 39 Minutes | 144 | 1.8% |
| 40 to 44 Minutes | 264 | 3.3% |
| 45 to 59 Minutes | 550 | 6.9% |
| 60 to 89 Minutes | 88 | 1.1% |
| 90 or more Minutes | 293 | 3.7% |
Commute Time by Sex in Rosedale
The most common commute times in Rosedale are 20 to 24 minutes (1,198 commuters, 24.6%) for males and 20 to 24 minutes (530 commuters, 17.0%) for females.
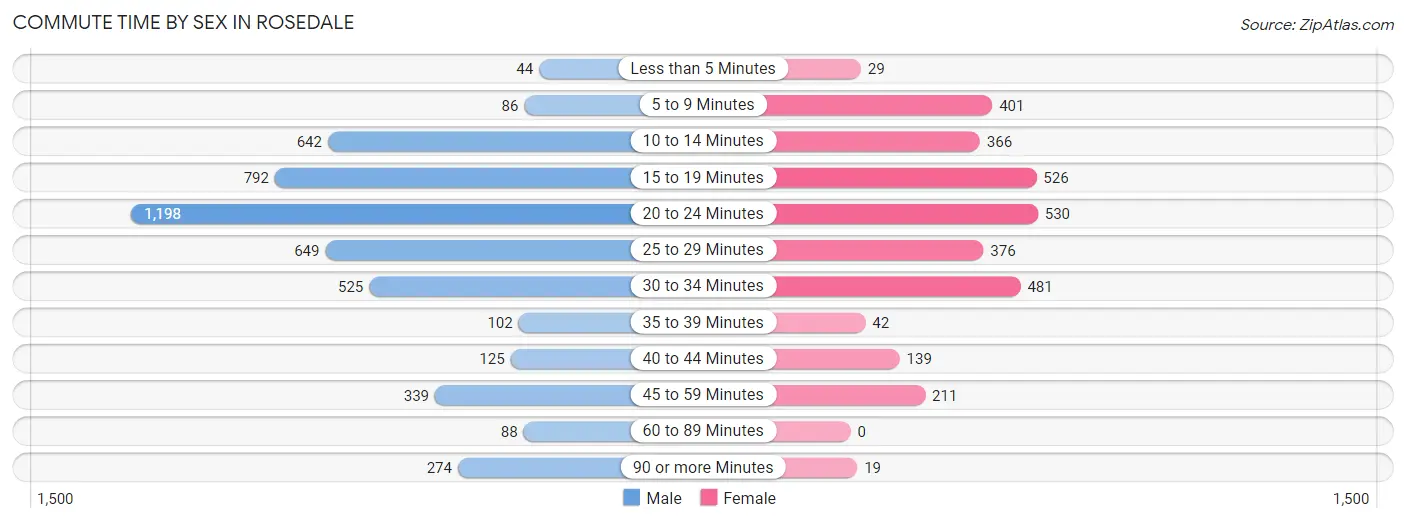
| Commute Time | Male | Female |
| Less than 5 Minutes | 44 (0.9%) | 29 (0.9%) |
| 5 to 9 Minutes | 86 (1.8%) | 401 (12.9%) |
| 10 to 14 Minutes | 642 (13.2%) | 366 (11.7%) |
| 15 to 19 Minutes | 792 (16.3%) | 526 (16.9%) |
| 20 to 24 Minutes | 1,198 (24.6%) | 530 (17.0%) |
| 25 to 29 Minutes | 649 (13.3%) | 376 (12.0%) |
| 30 to 34 Minutes | 525 (10.8%) | 481 (15.4%) |
| 35 to 39 Minutes | 102 (2.1%) | 42 (1.3%) |
| 40 to 44 Minutes | 125 (2.6%) | 139 (4.5%) |
| 45 to 59 Minutes | 339 (7.0%) | 211 (6.8%) |
| 60 to 89 Minutes | 88 (1.8%) | 0 (0.0%) |
| 90 or more Minutes | 274 (5.6%) | 19 (0.6%) |
Time of Departure to Work by Sex in Rosedale
The most frequent times of departure to work in Rosedale are 7:00 AM to 7:29 AM (988, 20.3%) for males and 7:00 AM to 7:29 AM (819, 26.3%) for females.
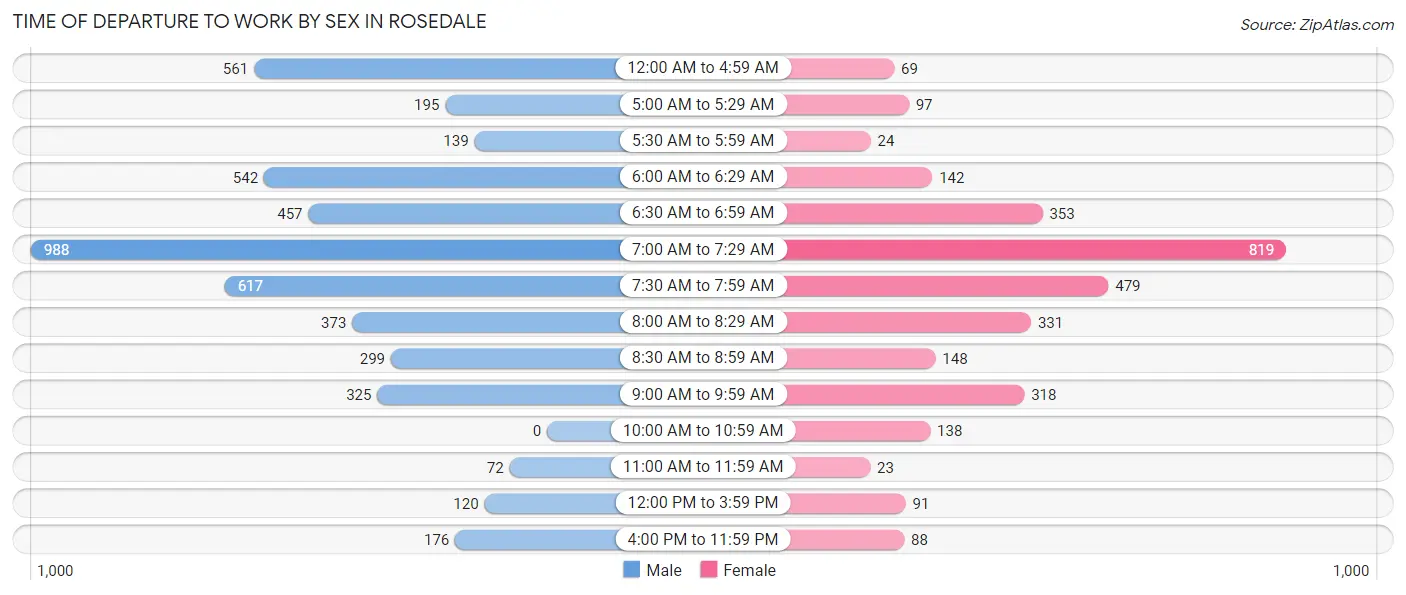
| Time of Departure | Male | Female |
| 12:00 AM to 4:59 AM | 561 (11.5%) | 69 (2.2%) |
| 5:00 AM to 5:29 AM | 195 (4.0%) | 97 (3.1%) |
| 5:30 AM to 5:59 AM | 139 (2.9%) | 24 (0.8%) |
| 6:00 AM to 6:29 AM | 542 (11.1%) | 142 (4.5%) |
| 6:30 AM to 6:59 AM | 457 (9.4%) | 353 (11.3%) |
| 7:00 AM to 7:29 AM | 988 (20.3%) | 819 (26.3%) |
| 7:30 AM to 7:59 AM | 617 (12.7%) | 479 (15.3%) |
| 8:00 AM to 8:29 AM | 373 (7.7%) | 331 (10.6%) |
| 8:30 AM to 8:59 AM | 299 (6.1%) | 148 (4.7%) |
| 9:00 AM to 9:59 AM | 325 (6.7%) | 318 (10.2%) |
| 10:00 AM to 10:59 AM | 0 (0.0%) | 138 (4.4%) |
| 11:00 AM to 11:59 AM | 72 (1.5%) | 23 (0.7%) |
| 12:00 PM to 3:59 PM | 120 (2.5%) | 91 (2.9%) |
| 4:00 PM to 11:59 PM | 176 (3.6%) | 88 (2.8%) |
| Total | 4,864 (100.0%) | 3,120 (100.0%) |
Housing Occupancy in Rosedale
Occupancy by Ownership in Rosedale
Of the total 6,252 dwellings in Rosedale, owner-occupied units account for 5,400 (86.4%), while renter-occupied units make up 852 (13.6%).
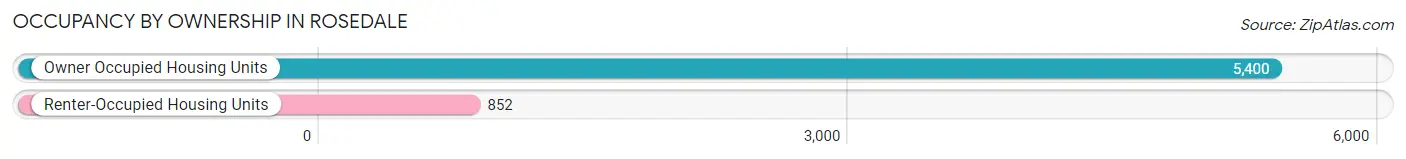
| Occupancy | # Housing Units | % Housing Units |
| Owner Occupied Housing Units | 5,400 | 86.4% |
| Renter-Occupied Housing Units | 852 | 13.6% |
| Total Occupied Housing Units | 6,252 | 100.0% |
Occupancy by Household Size in Rosedale
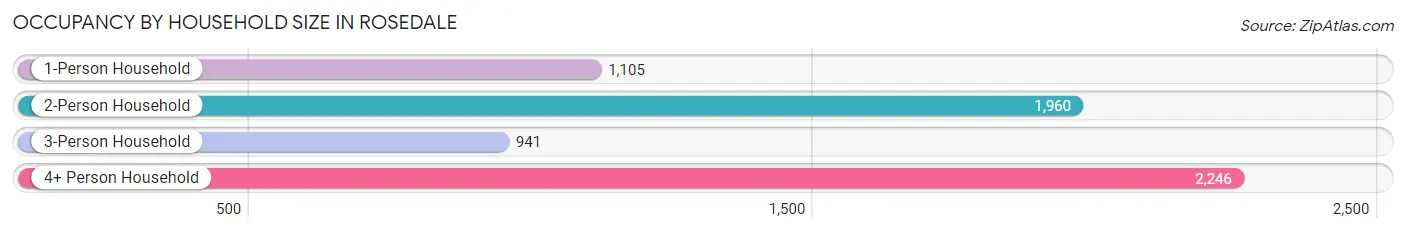
| Household Size | # Housing Units | % Housing Units |
| 1-Person Household | 1,105 | 17.7% |
| 2-Person Household | 1,960 | 31.4% |
| 3-Person Household | 941 | 15.0% |
| 4+ Person Household | 2,246 | 35.9% |
| Total Housing Units | 6,252 | 100.0% |
Occupancy by Ownership by Household Size in Rosedale
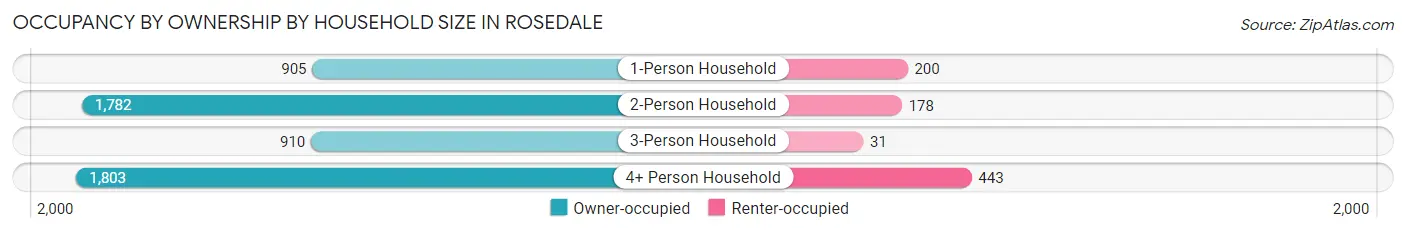
| Household Size | Owner-occupied | Renter-occupied |
| 1-Person Household | 905 (81.9%) | 200 (18.1%) |
| 2-Person Household | 1,782 (90.9%) | 178 (9.1%) |
| 3-Person Household | 910 (96.7%) | 31 (3.3%) |
| 4+ Person Household | 1,803 (80.3%) | 443 (19.7%) |
| Total Housing Units | 5,400 (86.4%) | 852 (13.6%) |
Occupancy by Educational Attainment in Rosedale
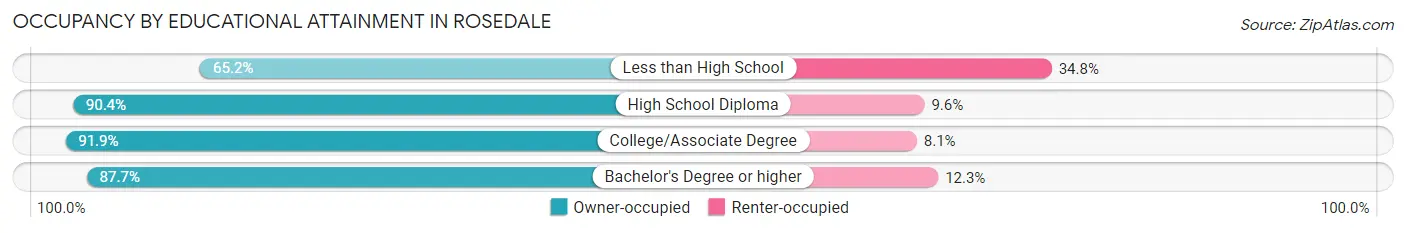
| Household Size | Owner-occupied | Renter-occupied |
| Less than High School | 558 (65.2%) | 298 (34.8%) |
| High School Diploma | 661 (90.4%) | 70 (9.6%) |
| College/Associate Degree | 1,949 (91.9%) | 171 (8.1%) |
| Bachelor's Degree or higher | 2,232 (87.7%) | 313 (12.3%) |
Occupancy by Age of Householder in Rosedale
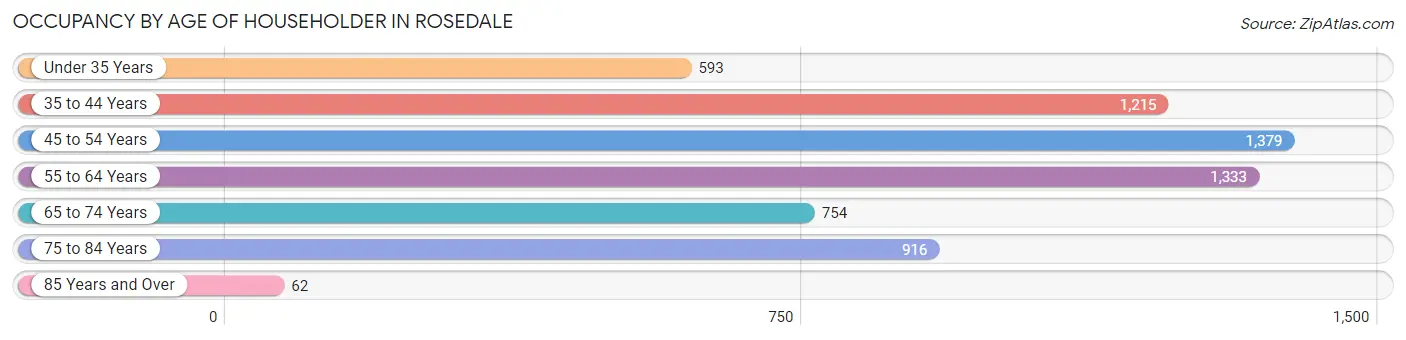
| Age Bracket | # Households | % Households |
| Under 35 Years | 593 | 9.5% |
| 35 to 44 Years | 1,215 | 19.4% |
| 45 to 54 Years | 1,379 | 22.1% |
| 55 to 64 Years | 1,333 | 21.3% |
| 65 to 74 Years | 754 | 12.1% |
| 75 to 84 Years | 916 | 14.6% |
| 85 Years and Over | 62 | 1.0% |
| Total | 6,252 | 100.0% |
Housing Finances in Rosedale
Median Income by Occupancy in Rosedale
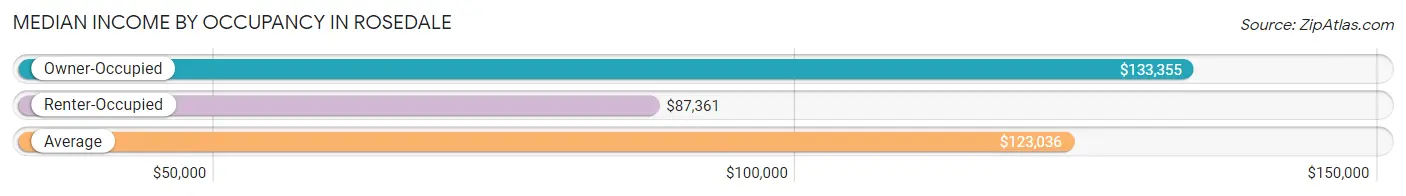
| Occupancy Type | # Households | Median Income |
| Owner-Occupied | 5,400 (86.4%) | $133,355 |
| Renter-Occupied | 852 (13.6%) | $87,361 |
| Average | 6,252 (100.0%) | $123,036 |
Occupancy by Householder Income Bracket in Rosedale
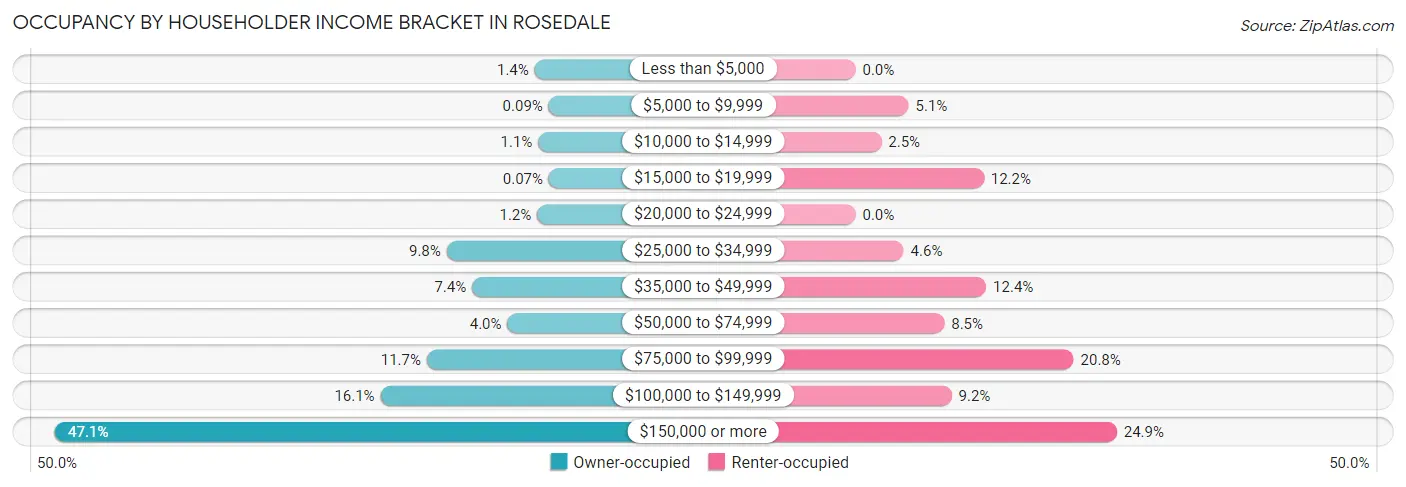
| Income Bracket | Owner-occupied | Renter-occupied |
| Less than $5,000 | 77 (1.4%) | 0 (0.0%) |
| $5,000 to $9,999 | 5 (0.1%) | 43 (5.1%) |
| $10,000 to $14,999 | 59 (1.1%) | 21 (2.5%) |
| $15,000 to $19,999 | 4 (0.1%) | 104 (12.2%) |
| $20,000 to $24,999 | 64 (1.2%) | 0 (0.0%) |
| $25,000 to $34,999 | 530 (9.8%) | 39 (4.6%) |
| $35,000 to $49,999 | 399 (7.4%) | 106 (12.4%) |
| $50,000 to $74,999 | 217 (4.0%) | 72 (8.5%) |
| $75,000 to $99,999 | 632 (11.7%) | 177 (20.8%) |
| $100,000 to $149,999 | 870 (16.1%) | 78 (9.1%) |
| $150,000 or more | 2,543 (47.1%) | 212 (24.9%) |
| Total | 5,400 (100.0%) | 852 (100.0%) |
Monthly Housing Cost Tiers in Rosedale
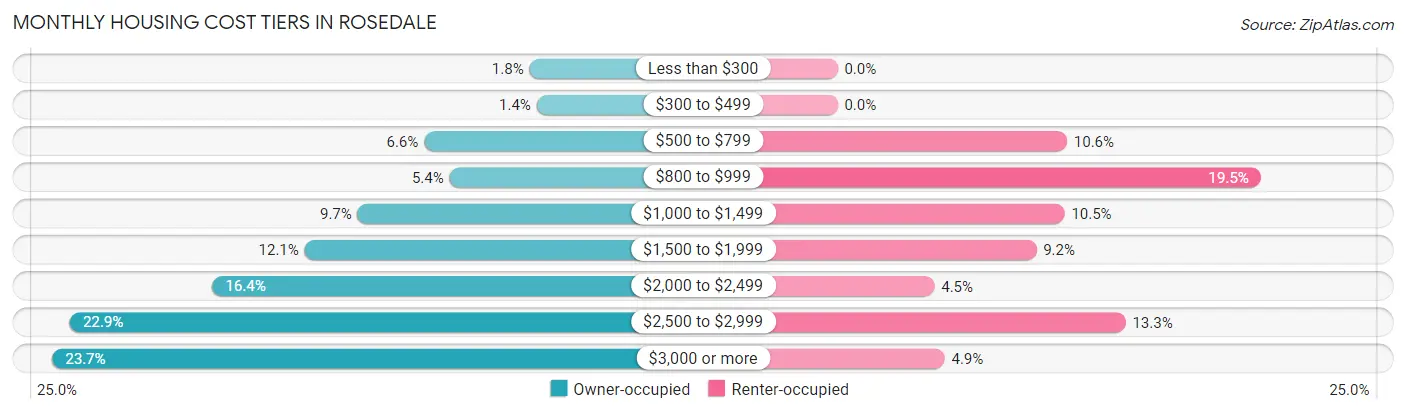
| Monthly Cost | Owner-occupied | Renter-occupied |
| Less than $300 | 95 (1.8%) | 0 (0.0%) |
| $300 to $499 | 77 (1.4%) | 0 (0.0%) |
| $500 to $799 | 357 (6.6%) | 90 (10.6%) |
| $800 to $999 | 294 (5.4%) | 166 (19.5%) |
| $1,000 to $1,499 | 522 (9.7%) | 89 (10.4%) |
| $1,500 to $1,999 | 654 (12.1%) | 78 (9.1%) |
| $2,000 to $2,499 | 883 (16.4%) | 38 (4.5%) |
| $2,500 to $2,999 | 1,237 (22.9%) | 113 (13.3%) |
| $3,000 or more | 1,281 (23.7%) | 42 (4.9%) |
| Total | 5,400 (100.0%) | 852 (100.0%) |
Physical Housing Characteristics in Rosedale
Housing Structures in Rosedale
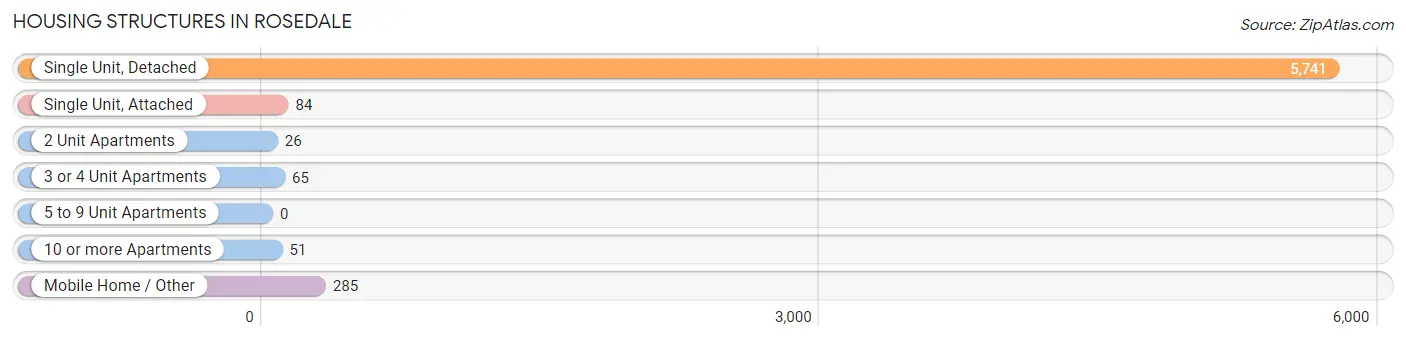
| Structure Type | # Housing Units | % Housing Units |
| Single Unit, Detached | 5,741 | 91.8% |
| Single Unit, Attached | 84 | 1.3% |
| 2 Unit Apartments | 26 | 0.4% |
| 3 or 4 Unit Apartments | 65 | 1.0% |
| 5 to 9 Unit Apartments | 0 | 0.0% |
| 10 or more Apartments | 51 | 0.8% |
| Mobile Home / Other | 285 | 4.6% |
| Total | 6,252 | 100.0% |
Housing Structures by Occupancy in Rosedale
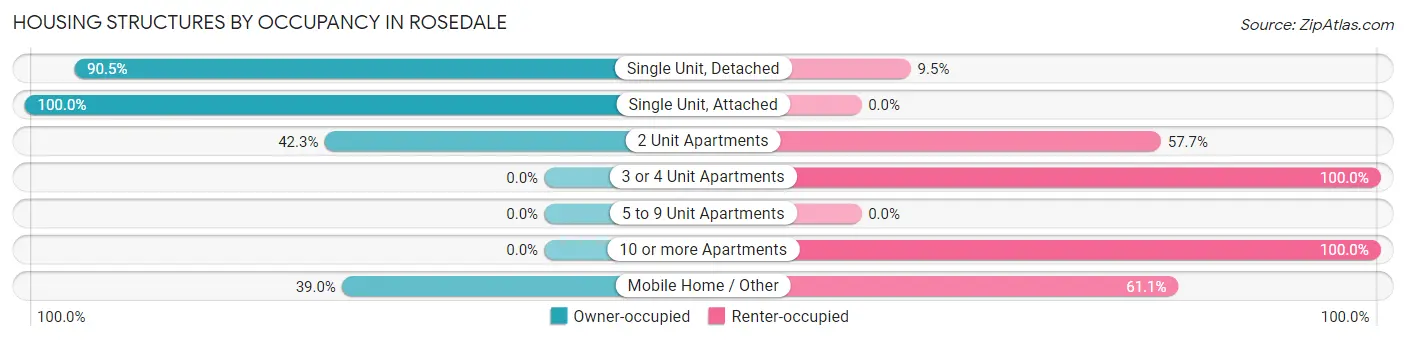
| Structure Type | Owner-occupied | Renter-occupied |
| Single Unit, Detached | 5,194 (90.5%) | 547 (9.5%) |
| Single Unit, Attached | 84 (100.0%) | 0 (0.0%) |
| 2 Unit Apartments | 11 (42.3%) | 15 (57.7%) |
| 3 or 4 Unit Apartments | 0 (0.0%) | 65 (100.0%) |
| 5 to 9 Unit Apartments | 0 (0.0%) | 0 (0.0%) |
| 10 or more Apartments | 0 (0.0%) | 51 (100.0%) |
| Mobile Home / Other | 111 (39.0%) | 174 (61.1%) |
| Total | 5,400 (86.4%) | 852 (13.6%) |
Housing Structures by Number of Rooms in Rosedale
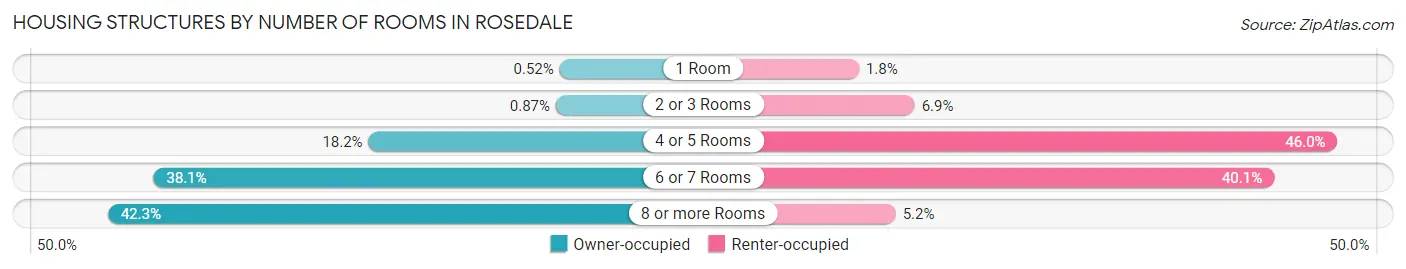
| Number of Rooms | Owner-occupied | Renter-occupied |
| 1 Room | 28 (0.5%) | 15 (1.8%) |
| 2 or 3 Rooms | 47 (0.9%) | 59 (6.9%) |
| 4 or 5 Rooms | 983 (18.2%) | 392 (46.0%) |
| 6 or 7 Rooms | 2,057 (38.1%) | 342 (40.1%) |
| 8 or more Rooms | 2,285 (42.3%) | 44 (5.2%) |
| Total | 5,400 (100.0%) | 852 (100.0%) |
Housing Structure by Heating Type in Rosedale
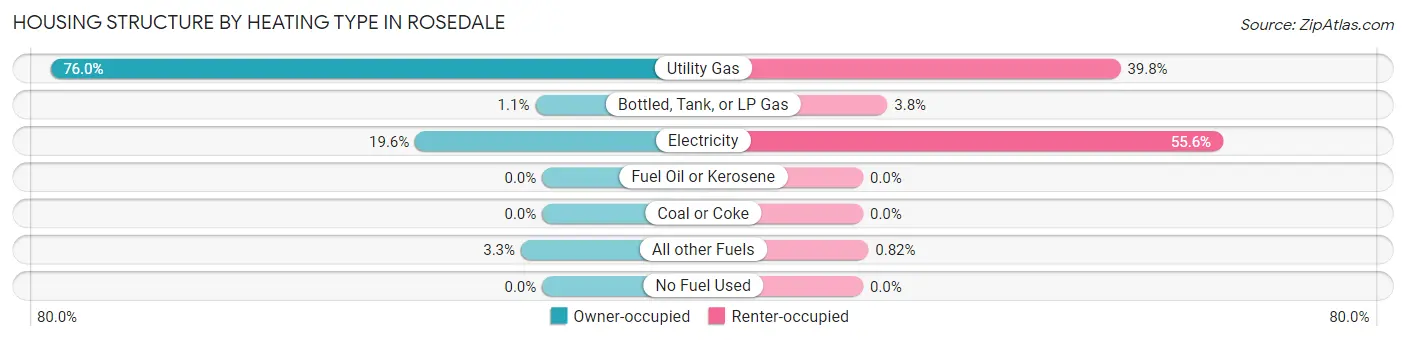
| Heating Type | Owner-occupied | Renter-occupied |
| Utility Gas | 4,106 (76.0%) | 339 (39.8%) |
| Bottled, Tank, or LP Gas | 57 (1.1%) | 32 (3.8%) |
| Electricity | 1,060 (19.6%) | 474 (55.6%) |
| Fuel Oil or Kerosene | 0 (0.0%) | 0 (0.0%) |
| Coal or Coke | 0 (0.0%) | 0 (0.0%) |
| All other Fuels | 177 (3.3%) | 7 (0.8%) |
| No Fuel Used | 0 (0.0%) | 0 (0.0%) |
| Total | 5,400 (100.0%) | 852 (100.0%) |
Household Vehicle Usage in Rosedale
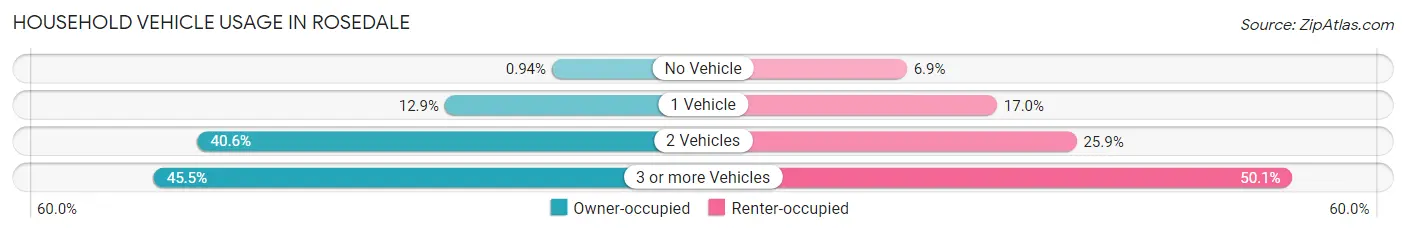
| Vehicles per Household | Owner-occupied | Renter-occupied |
| No Vehicle | 51 (0.9%) | 59 (6.9%) |
| 1 Vehicle | 698 (12.9%) | 145 (17.0%) |
| 2 Vehicles | 2,193 (40.6%) | 221 (25.9%) |
| 3 or more Vehicles | 2,458 (45.5%) | 427 (50.1%) |
| Total | 5,400 (100.0%) | 852 (100.0%) |
Real Estate & Mortgages in Rosedale
Real Estate and Mortgage Overview in Rosedale
| Characteristic | Without Mortgage | With Mortgage |
| Housing Units | 1,211 | 4,189 |
| Median Property Value | $467,300 | $551,400 |
| Median Household Income | $100,678 | $2,204 |
| Monthly Housing Costs | $843 | $1,274 |
| Real Estate Taxes | $3,949 | $32 |
Property Value by Mortgage Status in Rosedale
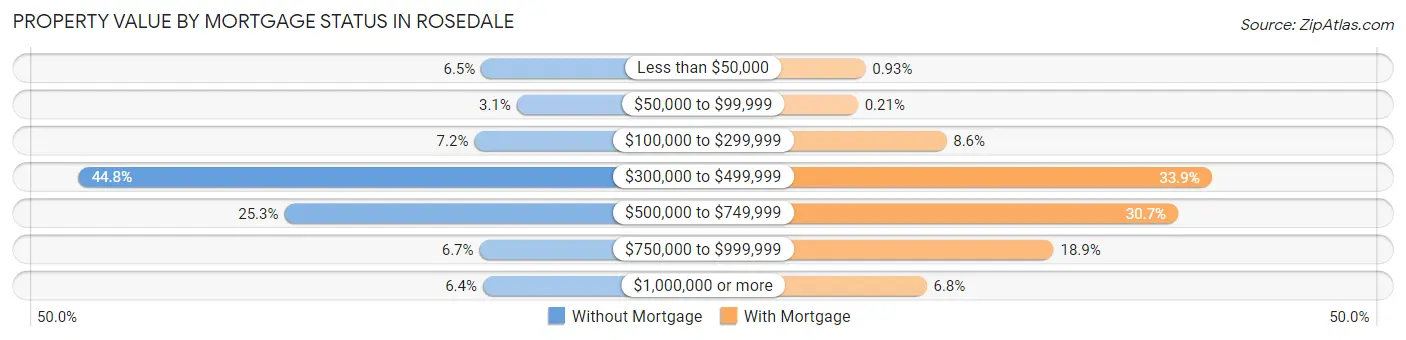
| Property Value | Without Mortgage | With Mortgage |
| Less than $50,000 | 79 (6.5%) | 39 (0.9%) |
| $50,000 to $99,999 | 38 (3.1%) | 9 (0.2%) |
| $100,000 to $299,999 | 87 (7.2%) | 362 (8.6%) |
| $300,000 to $499,999 | 543 (44.8%) | 1,420 (33.9%) |
| $500,000 to $749,999 | 306 (25.3%) | 1,286 (30.7%) |
| $750,000 to $999,999 | 81 (6.7%) | 790 (18.9%) |
| $1,000,000 or more | 77 (6.4%) | 283 (6.8%) |
| Total | 1,211 (100.0%) | 4,189 (100.0%) |
Household Income by Mortgage Status in Rosedale
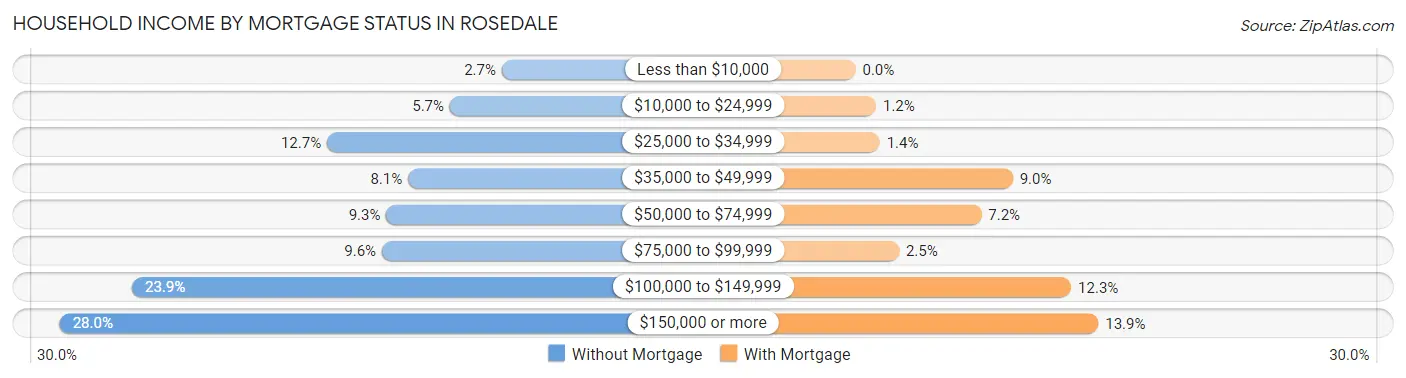
| Household Income | Without Mortgage | With Mortgage |
| Less than $10,000 | 33 (2.7%) | 0 (0.0%) |
| $10,000 to $24,999 | 69 (5.7%) | 49 (1.2%) |
| $25,000 to $34,999 | 154 (12.7%) | 58 (1.4%) |
| $35,000 to $49,999 | 98 (8.1%) | 376 (9.0%) |
| $50,000 to $74,999 | 113 (9.3%) | 301 (7.2%) |
| $75,000 to $99,999 | 116 (9.6%) | 104 (2.5%) |
| $100,000 to $149,999 | 289 (23.9%) | 516 (12.3%) |
| $150,000 or more | 339 (28.0%) | 581 (13.9%) |
| Total | 1,211 (100.0%) | 4,189 (100.0%) |
Property Value to Household Income Ratio in Rosedale
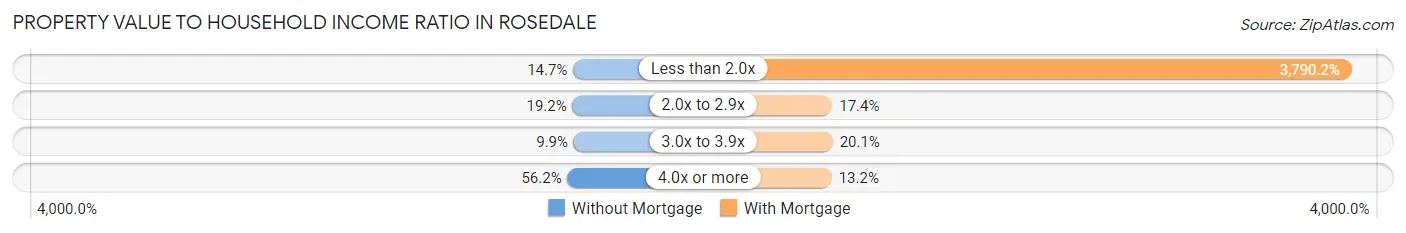
| Value-to-Income Ratio | Without Mortgage | With Mortgage |
| Less than 2.0x | 178 (14.7%) | 158,771 (3,790.2%) |
| 2.0x to 2.9x | 232 (19.2%) | 729 (17.4%) |
| 3.0x to 3.9x | 120 (9.9%) | 842 (20.1%) |
| 4.0x or more | 681 (56.2%) | 552 (13.2%) |
| Total | 1,211 (100.0%) | 4,189 (100.0%) |
Real Estate Taxes by Mortgage Status in Rosedale
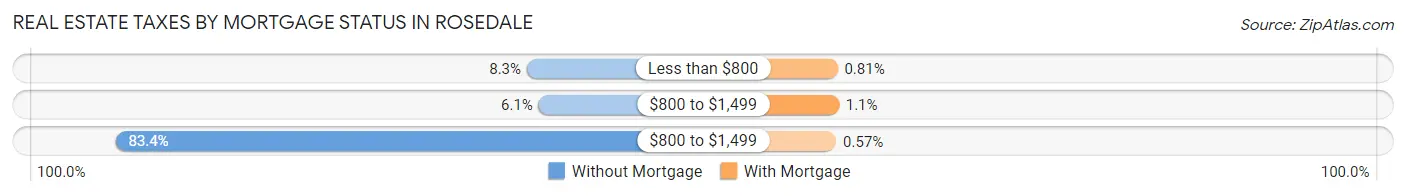
| Property Taxes | Without Mortgage | With Mortgage |
| Less than $800 | 100 (8.3%) | 34 (0.8%) |
| $800 to $1,499 | 74 (6.1%) | 44 (1.1%) |
| $800 to $1,499 | 1,010 (83.4%) | 24 (0.6%) |
| Total | 1,211 (100.0%) | 4,189 (100.0%) |
Health & Disability in Rosedale
Health Insurance Coverage by Age in Rosedale
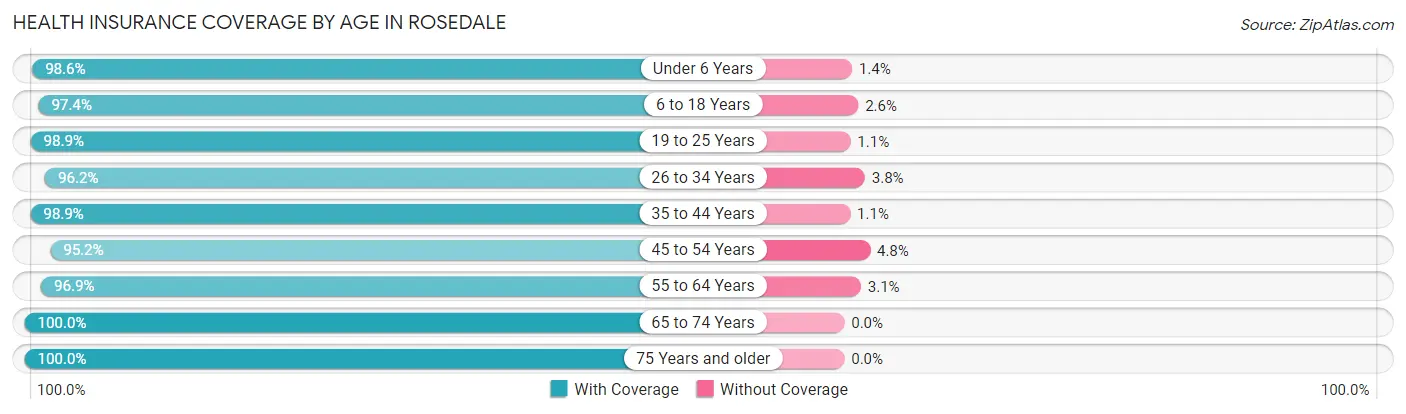
| Age Bracket | With Coverage | Without Coverage |
| Under 6 Years | 1,307 (98.6%) | 19 (1.4%) |
| 6 to 18 Years | 3,440 (97.4%) | 92 (2.6%) |
| 19 to 25 Years | 1,820 (98.9%) | 21 (1.1%) |
| 26 to 34 Years | 2,011 (96.2%) | 80 (3.8%) |
| 35 to 44 Years | 2,448 (98.9%) | 27 (1.1%) |
| 45 to 54 Years | 2,481 (95.2%) | 125 (4.8%) |
| 55 to 64 Years | 2,537 (96.9%) | 81 (3.1%) |
| 65 to 74 Years | 1,408 (100.0%) | 0 (0.0%) |
| 75 Years and older | 1,277 (100.0%) | 0 (0.0%) |
| Total | 18,729 (97.7%) | 445 (2.3%) |
Health Insurance Coverage by Citizenship Status in Rosedale
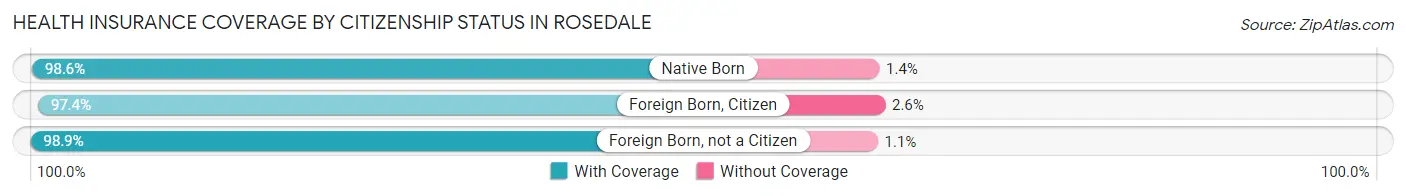
| Citizenship Status | With Coverage | Without Coverage |
| Native Born | 1,307 (98.6%) | 19 (1.4%) |
| Foreign Born, Citizen | 3,440 (97.4%) | 92 (2.6%) |
| Foreign Born, not a Citizen | 1,820 (98.9%) | 21 (1.1%) |
Health Insurance Coverage by Household Income in Rosedale
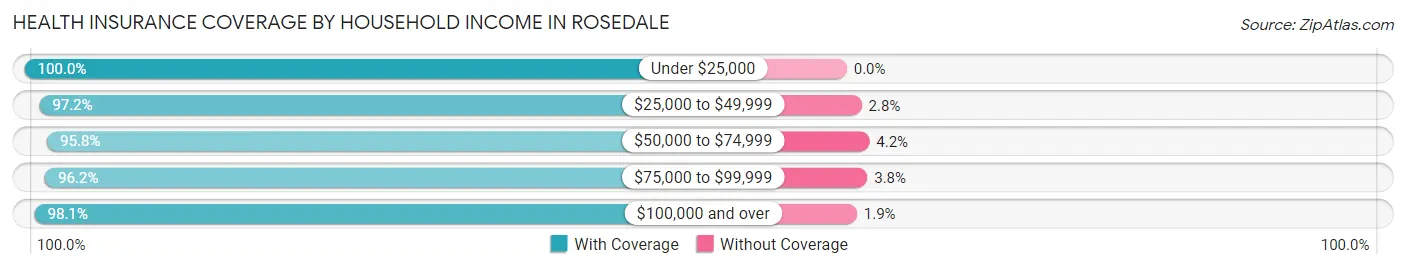
| Household Income | With Coverage | Without Coverage |
| Under $25,000 | 538 (100.0%) | 0 (0.0%) |
| $25,000 to $49,999 | 2,177 (97.2%) | 62 (2.8%) |
| $50,000 to $74,999 | 748 (95.8%) | 33 (4.2%) |
| $75,000 to $99,999 | 2,580 (96.2%) | 103 (3.8%) |
| $100,000 and over | 12,676 (98.1%) | 243 (1.9%) |
Public vs Private Health Insurance Coverage by Age in Rosedale
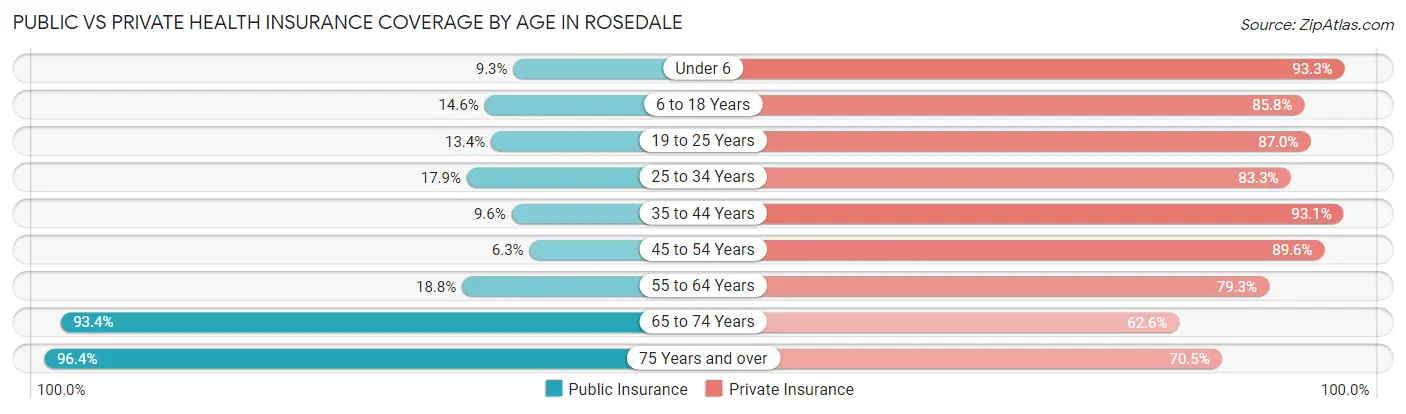
| Age Bracket | Public Insurance | Private Insurance |
| Under 6 | 123 (9.3%) | 1,237 (93.3%) |
| 6 to 18 Years | 517 (14.6%) | 3,032 (85.8%) |
| 19 to 25 Years | 247 (13.4%) | 1,601 (87.0%) |
| 25 to 34 Years | 375 (17.9%) | 1,741 (83.3%) |
| 35 to 44 Years | 238 (9.6%) | 2,305 (93.1%) |
| 45 to 54 Years | 164 (6.3%) | 2,334 (89.6%) |
| 55 to 64 Years | 492 (18.8%) | 2,075 (79.3%) |
| 65 to 74 Years | 1,315 (93.4%) | 882 (62.6%) |
| 75 Years and over | 1,231 (96.4%) | 900 (70.5%) |
| Total | 4,702 (24.5%) | 16,107 (84.0%) |
Disability Status by Sex by Age in Rosedale
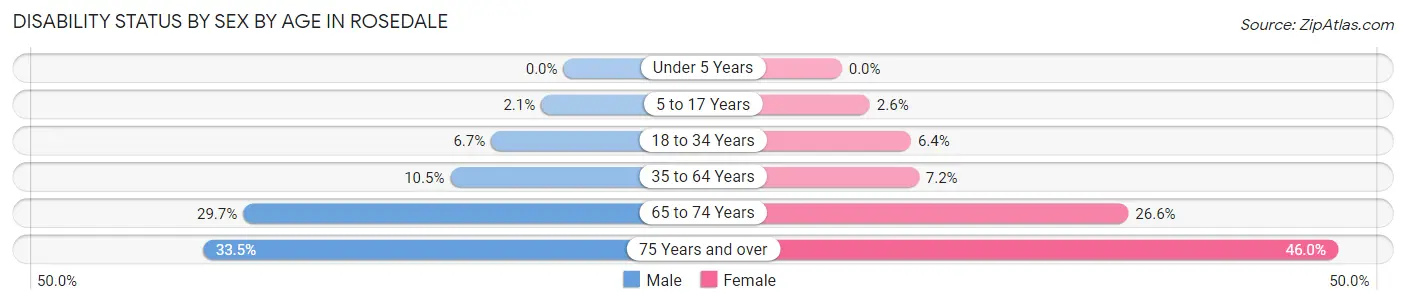
| Age Bracket | Male | Female |
| Under 5 Years | 0 (0.0%) | 0 (0.0%) |
| 5 to 17 Years | 32 (2.1%) | 51 (2.6%) |
| 18 to 34 Years | 162 (6.7%) | 114 (6.4%) |
| 35 to 64 Years | 413 (10.5%) | 269 (7.1%) |
| 65 to 74 Years | 242 (29.7%) | 158 (26.6%) |
| 75 Years and over | 183 (33.5%) | 336 (46.0%) |
Disability Class by Sex by Age in Rosedale
Disability Class: Hearing Difficulty
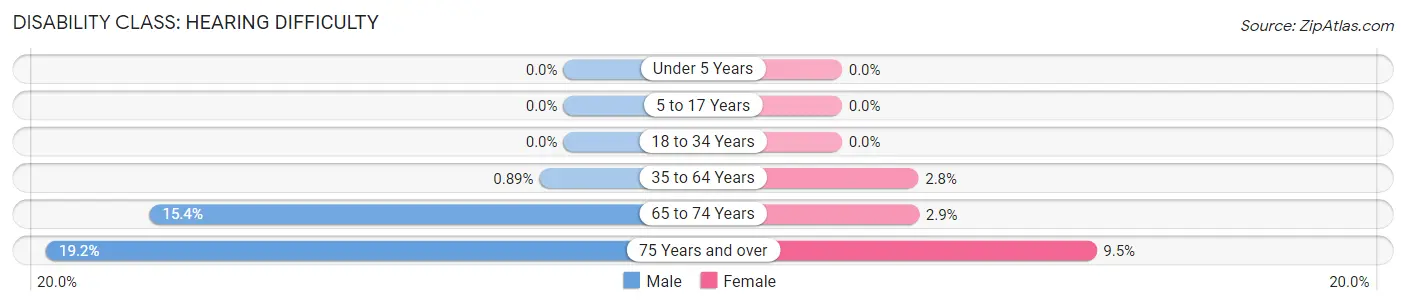
| Age Bracket | Male | Female |
| Under 5 Years | 0 (0.0%) | 0 (0.0%) |
| 5 to 17 Years | 0 (0.0%) | 0 (0.0%) |
| 18 to 34 Years | 0 (0.0%) | 0 (0.0%) |
| 35 to 64 Years | 35 (0.9%) | 107 (2.8%) |
| 65 to 74 Years | 125 (15.4%) | 17 (2.9%) |
| 75 Years and over | 105 (19.2%) | 69 (9.5%) |
Disability Class: Vision Difficulty
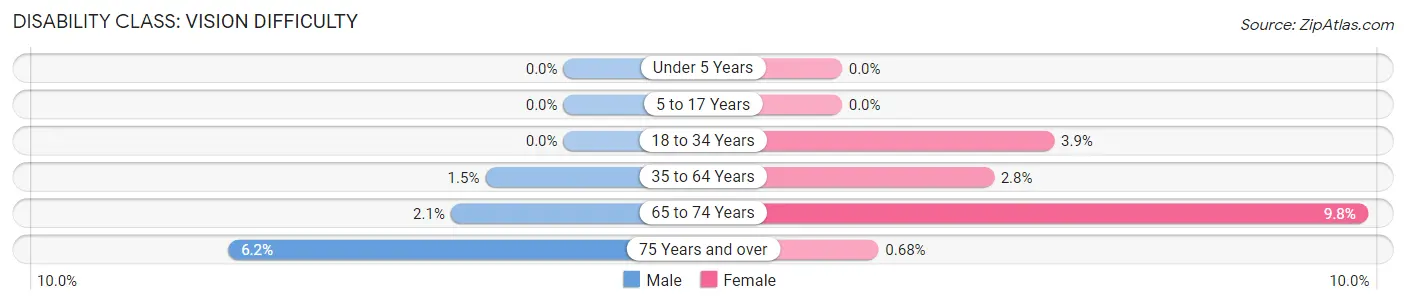
| Age Bracket | Male | Female |
| Under 5 Years | 0 (0.0%) | 0 (0.0%) |
| 5 to 17 Years | 0 (0.0%) | 0 (0.0%) |
| 18 to 34 Years | 0 (0.0%) | 70 (3.9%) |
| 35 to 64 Years | 57 (1.5%) | 106 (2.8%) |
| 65 to 74 Years | 17 (2.1%) | 58 (9.8%) |
| 75 Years and over | 34 (6.2%) | 5 (0.7%) |
Disability Class: Cognitive Difficulty
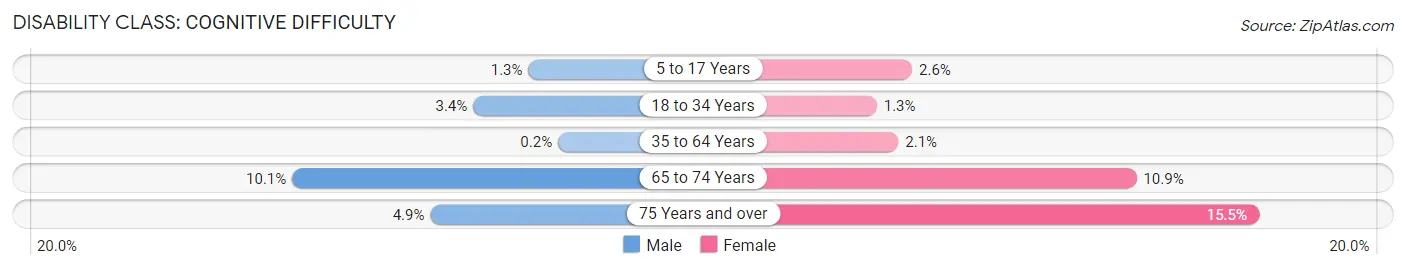
| Age Bracket | Male | Female |
| 5 to 17 Years | 20 (1.3%) | 51 (2.6%) |
| 18 to 34 Years | 81 (3.4%) | 23 (1.3%) |
| 35 to 64 Years | 8 (0.2%) | 79 (2.1%) |
| 65 to 74 Years | 82 (10.1%) | 65 (10.9%) |
| 75 Years and over | 27 (4.9%) | 113 (15.5%) |
Disability Class: Ambulatory Difficulty
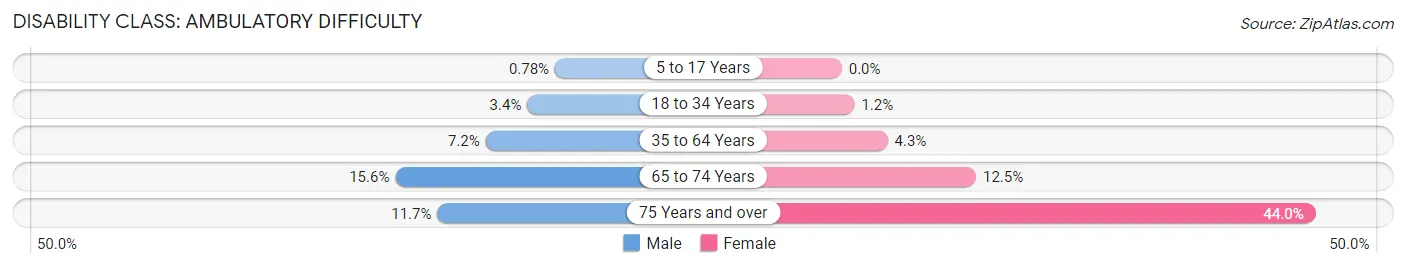
| Age Bracket | Male | Female |
| 5 to 17 Years | 12 (0.8%) | 0 (0.0%) |
| 18 to 34 Years | 81 (3.4%) | 21 (1.2%) |
| 35 to 64 Years | 284 (7.2%) | 160 (4.3%) |
| 65 to 74 Years | 127 (15.6%) | 74 (12.5%) |
| 75 Years and over | 64 (11.7%) | 321 (44.0%) |
Disability Class: Self-Care Difficulty
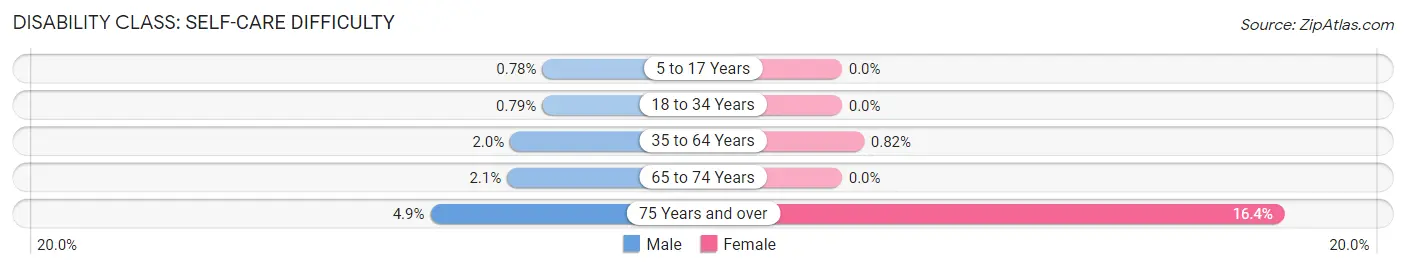
| Age Bracket | Male | Female |
| 5 to 17 Years | 12 (0.8%) | 0 (0.0%) |
| 18 to 34 Years | 19 (0.8%) | 0 (0.0%) |
| 35 to 64 Years | 78 (2.0%) | 31 (0.8%) |
| 65 to 74 Years | 17 (2.1%) | 0 (0.0%) |
| 75 Years and over | 27 (4.9%) | 120 (16.4%) |
Technology Access in Rosedale
Computing Device Access in Rosedale
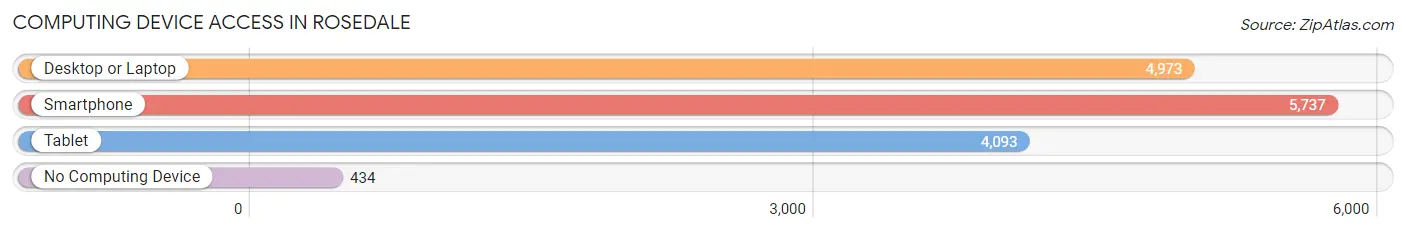
| Device Type | # Households | % Households |
| Desktop or Laptop | 4,973 | 79.5% |
| Smartphone | 5,737 | 91.8% |
| Tablet | 4,093 | 65.5% |
| No Computing Device | 434 | 6.9% |
| Total | 6,252 | 100.0% |
Internet Access in Rosedale
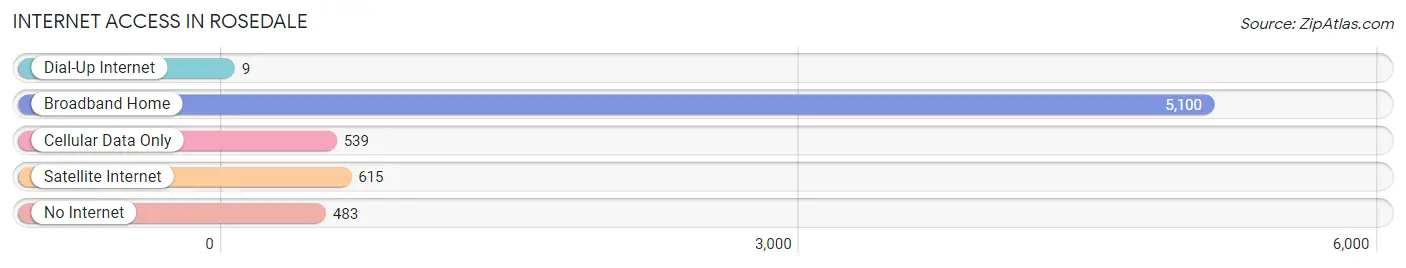
| Internet Type | # Households | % Households |
| Dial-Up Internet | 9 | 0.1% |
| Broadband Home | 5,100 | 81.6% |
| Cellular Data Only | 539 | 8.6% |
| Satellite Internet | 615 | 9.8% |
| No Internet | 483 | 7.7% |
| Total | 6,252 | 100.0% |
Rosedale Summary
Rosedale is a small unincorporated community located in Kern County, California. It is situated in the southern San Joaquin Valley, approximately 8 miles south of Bakersfield. The population of Rosedale was estimated to be around 8,000 in 2020.
History
Rosedale was founded in 1876 by William Rosedale, a rancher from Missouri. He purchased a large tract of land in the area and began to develop it for agricultural purposes. The town was named after him and was incorporated in 1891.
Rosedale was a thriving agricultural community for many years, with a variety of crops being grown in the area. The town was also home to a number of businesses, including a general store, a blacksmith shop, and a hotel.
In the early 1900s, the town began to experience a decline in population as many of the residents moved away to pursue other opportunities. By the 1950s, the population had dropped to just over 500.
Geography
Rosedale is located in the southern San Joaquin Valley, approximately 8 miles south of Bakersfield. The town is situated on the banks of the Kern River, which flows through the area. The terrain is mostly flat, with some rolling hills in the surrounding area.
The climate in Rosedale is semi-arid, with hot summers and mild winters. The average annual temperature is around 70 degrees Fahrenheit. The average annual precipitation is around 8 inches.
Economy
Rosedale’s economy is largely based on agriculture. The town is home to a number of farms and ranches, which produce a variety of crops, including cotton, alfalfa, and corn.
The town is also home to a number of businesses, including a grocery store, a hardware store, and a gas station. There are also a few restaurants and bars in the area.
Demographics
Rosedale’s population was estimated to be around 8,000 in 2020. The town is predominantly white, with a small Hispanic population. The median household income is around $50,000.
The town is served by the Kern County School District, which operates a number of elementary and middle schools in the area. There is also a high school located in the nearby town of Bakersfield.
Conclusion
Rosedale is a small unincorporated community located in Kern County, California. It was founded in 1876 by William Rosedale and was once a thriving agricultural community. The town is now home to a population of around 8,000 and is largely based on agriculture. The town is predominantly white, with a small Hispanic population, and the median household income is around $50,000. The town is served by the Kern County School District and is located near the Kern River.
Common Questions
What is Per Capita Income in Rosedale?
Per Capita income in Rosedale is $59,165.
What is the Median Family Income in Rosedale?
Median Family Income in Rosedale is $154,297.
What is the Median Household income in Rosedale?
Median Household Income in Rosedale is $123,036.
What is Income or Wage Gap in Rosedale?
Income or Wage Gap in Rosedale is 46.7%.
Women in Rosedale earn 53.3 cents for every dollar earned by a man.
What is Inequality or Gini Index in Rosedale?
Inequality or Gini Index in Rosedale is 0.49.
What is the Total Population of Rosedale?
Total Population of Rosedale is 19,174.
What is the Total Male Population of Rosedale?
Total Male Population of Rosedale is 10,100.
What is the Total Female Population of Rosedale?
Total Female Population of Rosedale is 9,074.
What is the Ratio of Males per 100 Females in Rosedale?
There are 111.31 Males per 100 Females in Rosedale.
What is the Ratio of Females per 100 Males in Rosedale?
There are 89.84 Females per 100 Males in Rosedale.
What is the Median Population Age in Rosedale?
Median Population Age in Rosedale is 37.6 Years.
What is the Average Family Size in Rosedale
Average Family Size in Rosedale is 3.5 People.
What is the Average Household Size in Rosedale
Average Household Size in Rosedale is 3.1 People.
How Large is the Labor Force in Rosedale?
There are 9,419 People in the Labor Forcein in Rosedale.
What is the Percentage of People in the Labor Force in Rosedale?
62.4% of People are in the Labor Force in Rosedale.
What is the Unemployment Rate in Rosedale?
Unemployment Rate in Rosedale is 3.2%.