Cities with the Fewest Births per 1,000 Women Over the Age of 35 in Minnesota
RELATED REPORTS & OPTIONS
Lowest Birth Rate | Women 35+
Minnesota
Compare Cities
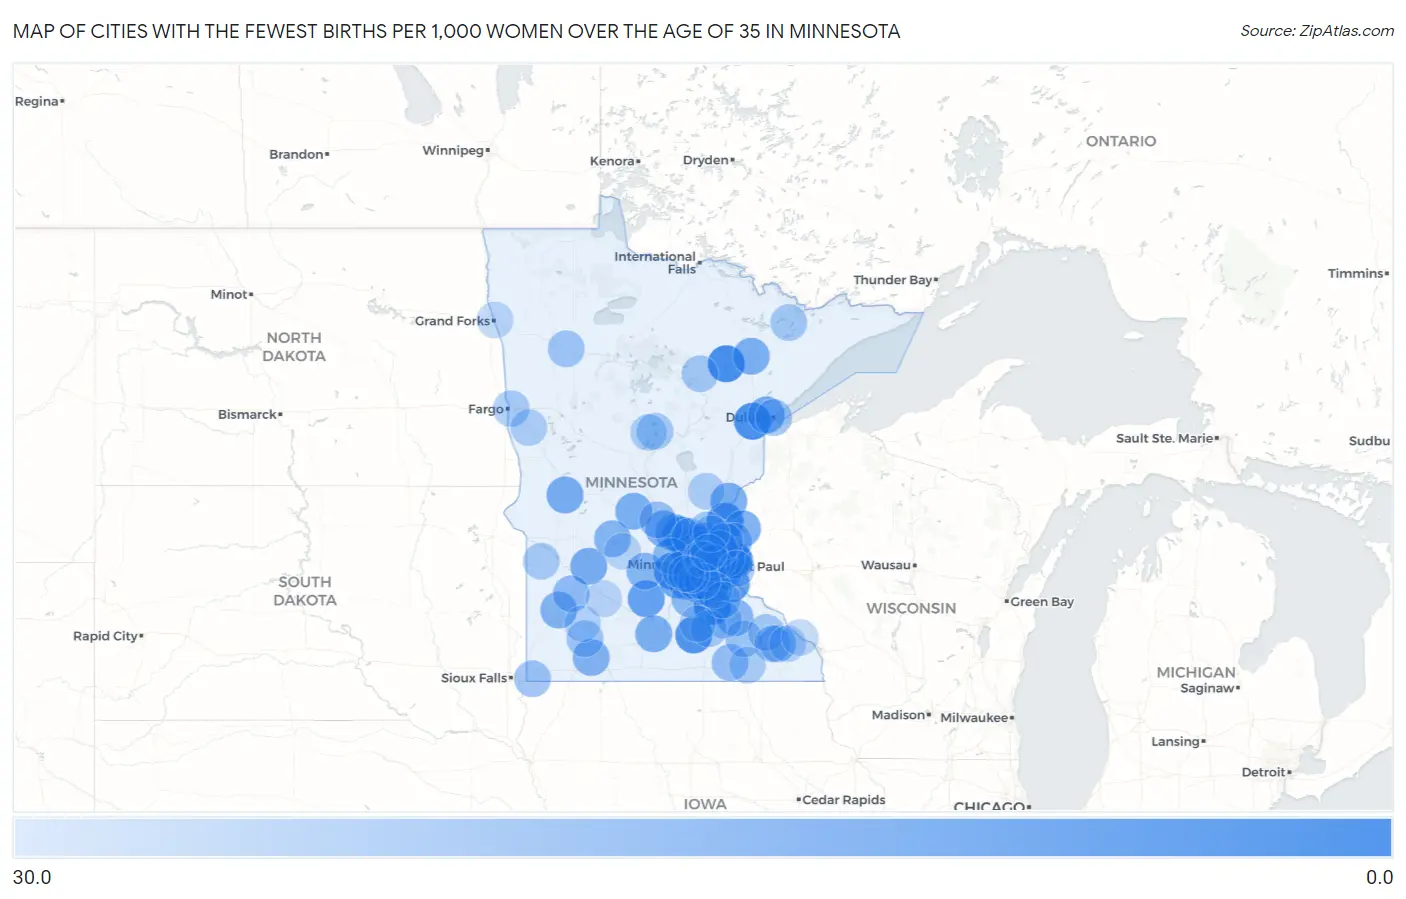
Map of Cities with the Fewest Births per 1,000 Women Over the Age of 35 in Minnesota
30.0
0.0
Cities with the Fewest Births per 1,000 Women Over the Age of 35 in Minnesota
| City | Births / 1,000 Women | vs State | vs National | |
| 1. | White Bear Lake | 1.0 | 35.0(-34.0)#1 | 32.0(-31.0)#3 |
| 2. | Mounds View | 2.0 | 35.0(-33.0)#2 | 32.0(-30.0)#21 |
| 3. | Rogers | 3.0 | 35.0(-32.0)#3 | 32.0(-29.0)#53 |
| 4. | Northfield | 4.0 | 35.0(-31.0)#4 | 32.0(-28.0)#88 |
| 5. | Hibbing | 4.0 | 35.0(-31.0)#5 | 32.0(-28.0)#96 |
| 6. | Cloquet | 5.0 | 35.0(-30.0)#6 | 32.0(-27.0)#144 |
| 7. | North Branch | 6.0 | 35.0(-29.0)#7 | 32.0(-26.0)#215 |
| 8. | Waseca | 6.0 | 35.0(-29.0)#8 | 32.0(-26.0)#223 |
| 9. | Big Lake | 7.0 | 35.0(-28.0)#9 | 32.0(-25.0)#281 |
| 10. | Mayer | 7.0 | 35.0(-28.0)#10 | 32.0(-25.0)#322 |
| 11. | West St Paul | 8.0 | 35.0(-27.0)#11 | 32.0(-24.0)#355 |
| 12. | Anoka | 8.0 | 35.0(-27.0)#12 | 32.0(-24.0)#364 |
| 13. | Hastings | 9.0 | 35.0(-26.0)#13 | 32.0(-23.0)#439 |
| 14. | Winthrop | 10.0 | 35.0(-25.0)#14 | 32.0(-22.0)#648 |
| 15. | Grant | 11.0 | 35.0(-24.0)#15 | 32.0(-21.0)#753 |
| 16. | Long Lake | 11.0 | 35.0(-24.0)#16 | 32.0(-21.0)#773 |
| 17. | Stillwater | 12.0 | 35.0(-23.0)#17 | 32.0(-20.0)#832 |
| 18. | Corcoran | 12.0 | 35.0(-23.0)#18 | 32.0(-20.0)#875 |
| 19. | Cologne | 12.0 | 35.0(-23.0)#19 | 32.0(-20.0)#893 |
| 20. | Andover | 13.0 | 35.0(-22.0)#20 | 32.0(-19.0)#930 |
| 21. | Prior Lake | 13.0 | 35.0(-22.0)#21 | 32.0(-19.0)#937 |
| 22. | South St Paul | 13.0 | 35.0(-22.0)#22 | 32.0(-19.0)#947 |
| 23. | Bayport | 13.0 | 35.0(-22.0)#23 | 32.0(-19.0)#1,010 |
| 24. | Hermantown | 14.0 | 35.0(-21.0)#24 | 32.0(-18.0)#1,108 |
| 25. | Rock Creek | 14.0 | 35.0(-21.0)#25 | 32.0(-18.0)#1,164 |
| 26. | Clara City | 14.0 | 35.0(-21.0)#26 | 32.0(-18.0)#1,166 |
| 27. | Taylors Falls | 14.0 | 35.0(-21.0)#27 | 32.0(-18.0)#1,171 |
| 28. | Hoffman | 14.0 | 35.0(-21.0)#28 | 32.0(-18.0)#1,175 |
| 29. | Virginia | 15.0 | 35.0(-20.0)#29 | 32.0(-17.0)#1,242 |
| 30. | Becker | 15.0 | 35.0(-20.0)#30 | 32.0(-17.0)#1,265 |
| 31. | Albany | 15.0 | 35.0(-20.0)#31 | 32.0(-17.0)#1,279 |
| 32. | Lake Crystal | 15.0 | 35.0(-20.0)#32 | 32.0(-17.0)#1,281 |
| 33. | Clearwater | 15.0 | 35.0(-20.0)#33 | 32.0(-17.0)#1,287 |
| 34. | Vadnais Heights | 16.0 | 35.0(-19.0)#34 | 32.0(-16.0)#1,360 |
| 35. | Newport | 16.0 | 35.0(-19.0)#35 | 32.0(-16.0)#1,409 |
| 36. | Heron Lake | 16.0 | 35.0(-19.0)#36 | 32.0(-16.0)#1,457 |
| 37. | Lynd | 16.0 | 35.0(-19.0)#37 | 32.0(-16.0)#1,458 |
| 38. | Crystal | 17.0 | 35.0(-18.0)#38 | 32.0(-15.0)#1,494 |
| 39. | Hutchinson | 17.0 | 35.0(-18.0)#39 | 32.0(-15.0)#1,515 |
| 40. | Carver | 17.0 | 35.0(-18.0)#40 | 32.0(-15.0)#1,559 |
| 41. | St Charles | 17.0 | 35.0(-18.0)#41 | 32.0(-15.0)#1,566 |
| 42. | New London | 17.0 | 35.0(-18.0)#42 | 32.0(-15.0)#1,611 |
| 43. | Wanamingo | 17.0 | 35.0(-18.0)#43 | 32.0(-15.0)#1,612 |
| 44. | New Prague | 18.0 | 35.0(-17.0)#44 | 32.0(-14.0)#1,716 |
| 45. | Oak Park Heights | 18.0 | 35.0(-17.0)#45 | 32.0(-14.0)#1,730 |
| 46. | Montrose | 18.0 | 35.0(-17.0)#46 | 32.0(-14.0)#1,739 |
| 47. | Coon Rapids | 19.0 | 35.0(-16.0)#47 | 32.0(-13.0)#1,812 |
| 48. | Scandia | 19.0 | 35.0(-16.0)#48 | 32.0(-13.0)#1,908 |
| 49. | Cottonwood | 19.0 | 35.0(-16.0)#49 | 32.0(-13.0)#1,958 |
| 50. | Pine Springs | 19.0 | 35.0(-16.0)#50 | 32.0(-13.0)#1,973 |
| 51. | Centerville | 20.0 | 35.0(-15.0)#51 | 32.0(-12.0)#2,082 |
| 52. | St Bonifacius | 20.0 | 35.0(-15.0)#52 | 32.0(-12.0)#2,103 |
| 53. | Brownsdale | 20.0 | 35.0(-15.0)#53 | 32.0(-12.0)#2,129 |
| 54. | Lakeville | 21.0 | 35.0(-14.0)#54 | 32.0(-11.0)#2,142 |
| 55. | St Cloud | 21.0 | 35.0(-14.0)#55 | 32.0(-11.0)#2,144 |
| 56. | Little Canada | 21.0 | 35.0(-14.0)#56 | 32.0(-11.0)#2,216 |
| 57. | Hills | 21.0 | 35.0(-14.0)#57 | 32.0(-11.0)#2,299 |
| 58. | Duluth | 22.0 | 35.0(-13.0)#58 | 32.0(-10.00)#2,320 |
| 59. | Shakopee | 22.0 | 35.0(-13.0)#59 | 32.0(-10.00)#2,334 |
| 60. | St Anthony City Hennepin And Ramsey Counties | 22.0 | 35.0(-13.0)#60 | 32.0(-10.00)#2,391 |
| 61. | Byron | 22.0 | 35.0(-13.0)#61 | 32.0(-10.00)#2,404 |
| 62. | Fosston | 22.0 | 35.0(-13.0)#62 | 32.0(-10.00)#2,458 |
| 63. | Westbrook | 22.0 | 35.0(-13.0)#63 | 32.0(-10.00)#2,475 |
| 64. | Bethel | 22.0 | 35.0(-13.0)#64 | 32.0(-10.00)#2,482 |
| 65. | Columbia Heights | 23.0 | 35.0(-12.0)#65 | 32.0(-9.00)#2,533 |
| 66. | Lino Lakes | 23.0 | 35.0(-12.0)#66 | 32.0(-9.00)#2,534 |
| 67. | Forest Lake | 23.0 | 35.0(-12.0)#67 | 32.0(-9.00)#2,538 |
| 68. | Ely | 23.0 | 35.0(-12.0)#68 | 32.0(-9.00)#2,599 |
| 69. | Breezy Point | 23.0 | 35.0(-12.0)#69 | 32.0(-9.00)#2,609 |
| 70. | Kenyon | 23.0 | 35.0(-12.0)#70 | 32.0(-9.00)#2,630 |
| 71. | Medford | 23.0 | 35.0(-12.0)#71 | 32.0(-9.00)#2,644 |
| 72. | Elgin | 23.0 | 35.0(-12.0)#72 | 32.0(-9.00)#2,649 |
| 73. | Dover | 23.0 | 35.0(-12.0)#73 | 32.0(-9.00)#2,657 |
| 74. | Bovey | 23.0 | 35.0(-12.0)#74 | 32.0(-9.00)#2,658 |
| 75. | Moorhead | 24.0 | 35.0(-11.0)#75 | 32.0(-8.00)#2,698 |
| 76. | Richfield | 24.0 | 35.0(-11.0)#76 | 32.0(-8.00)#2,701 |
| 77. | Elk River | 24.0 | 35.0(-11.0)#77 | 32.0(-8.00)#2,713 |
| 78. | New Hope | 24.0 | 35.0(-11.0)#78 | 32.0(-8.00)#2,725 |
| 79. | Robbinsdale | 24.0 | 35.0(-11.0)#79 | 32.0(-8.00)#2,742 |
| 80. | Falcon Heights | 24.0 | 35.0(-11.0)#80 | 32.0(-8.00)#2,788 |
| 81. | Madison | 24.0 | 35.0(-11.0)#81 | 32.0(-8.00)#2,830 |
| 82. | Lake St Croix Beach | 24.0 | 35.0(-11.0)#82 | 32.0(-8.00)#2,839 |
| 83. | Farmington | 25.0 | 35.0(-10.00)#83 | 32.0(-7.00)#2,905 |
| 84. | East Bethel | 25.0 | 35.0(-10.00)#84 | 32.0(-7.00)#2,935 |
| 85. | Mora | 25.0 | 35.0(-10.00)#85 | 32.0(-7.00)#2,970 |
| 86. | Barnesville | 25.0 | 35.0(-10.00)#86 | 32.0(-7.00)#2,980 |
| 87. | Pequot Lakes | 25.0 | 35.0(-10.00)#87 | 32.0(-7.00)#2,989 |
| 88. | Grand Meadow | 25.0 | 35.0(-10.00)#88 | 32.0(-7.00)#3,012 |
| 89. | Randolph | 25.0 | 35.0(-10.00)#89 | 32.0(-7.00)#3,022 |
| 90. | Savage | 26.0 | 35.0(-9.00)#90 | 32.0(-6.00)#3,060 |
| 91. | Chanhassen | 26.0 | 35.0(-9.00)#91 | 32.0(-6.00)#3,064 |
| 92. | Victoria | 26.0 | 35.0(-9.00)#92 | 32.0(-6.00)#3,098 |
| 93. | Lewiston | 26.0 | 35.0(-9.00)#93 | 32.0(-6.00)#3,166 |
| 94. | Morristown | 26.0 | 35.0(-9.00)#94 | 32.0(-6.00)#3,185 |
| 95. | Walnut Grove | 26.0 | 35.0(-9.00)#95 | 32.0(-6.00)#3,191 |
| 96. | Winona | 27.0 | 35.0(-8.00)#96 | 32.0(-5.00)#3,239 |
| 97. | East Grand Forks | 27.0 | 35.0(-8.00)#97 | 32.0(-5.00)#3,285 |
| 98. | Spring Lake Park | 27.0 | 35.0(-8.00)#98 | 32.0(-5.00)#3,300 |
| 99. | Redwood Falls | 27.0 | 35.0(-8.00)#99 | 32.0(-5.00)#3,314 |
| 100. | Atwater | 27.0 | 35.0(-8.00)#100 | 32.0(-5.00)#3,355 |
Common Questions
What are the Top 10 Cities with the Fewest Births per 1,000 Women Over the Age of 35 in Minnesota?
Top 10 Cities with the Fewest Births per 1,000 Women Over the Age of 35 in Minnesota are:
#1
1.0
#2
2.0
#3
3.0
#4
4.0
#5
4.0
#6
5.0
#7
6.0
#8
6.0
#9
7.0
#10
7.0
What city has the Fewest Births per 1,000 Women Over the Age of 35 in Minnesota?
White Bear Lake has the Fewest Births per 1,000 Women Over the Age of 35 in Minnesota with 1.0.
What is the Number of Births per 1,000 Women Over the Age of 35 in the State of Minnesota?
Number of Births per 1,000 Women Over the Age of 35 in Minnesota is 35.0.
What is the Number of Births per 1,000 Women Over the Age of 35 in the United States?
Number of Births per 1,000 Women Over the Age of 35 in the United States is 32.0.