Dana Point, CA Map & Demographics
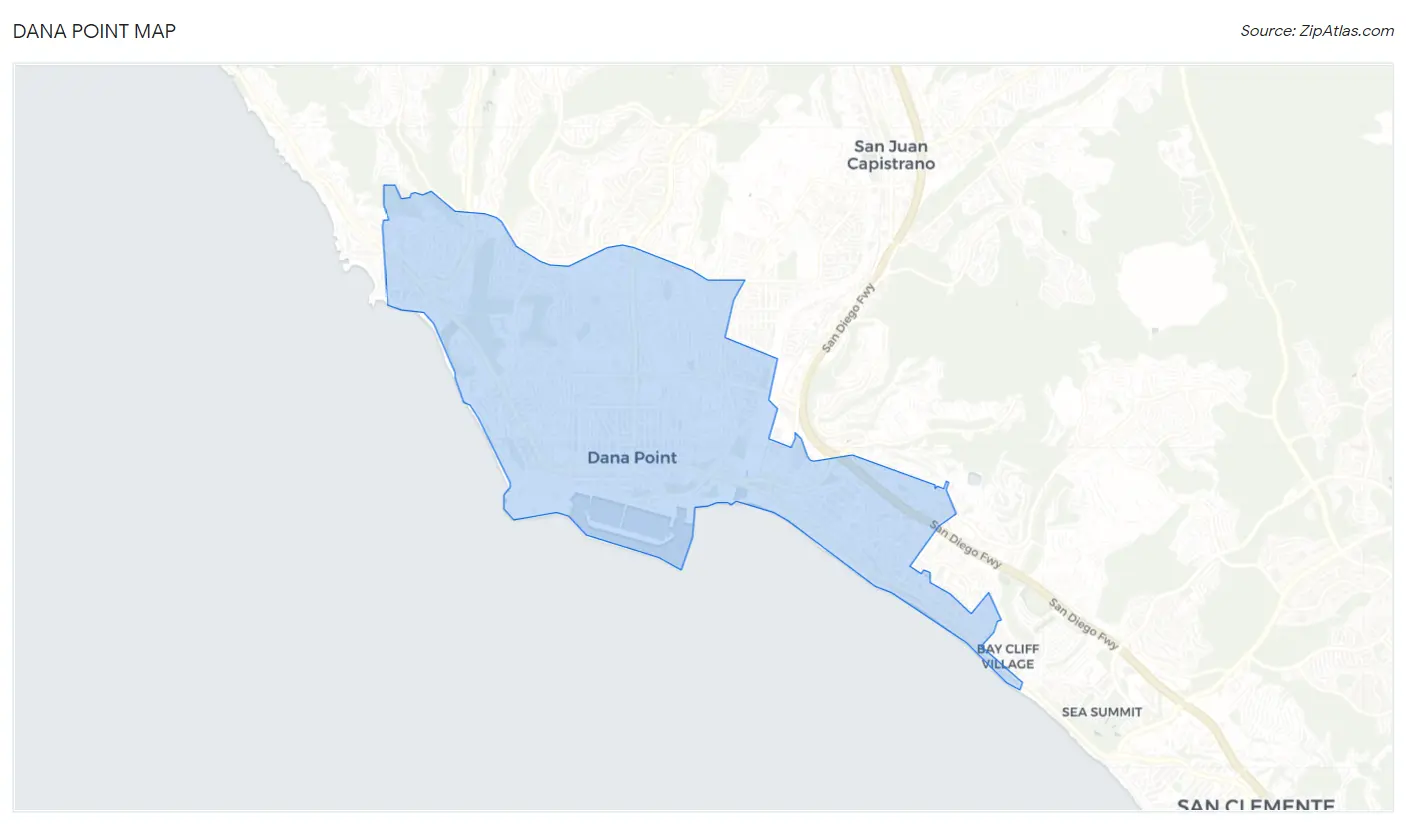
Dana Point Map
Dana Point Overview
$74,878
PER CAPITA INCOME
$139,567
AVG FAMILY INCOME
$119,632
AVG HOUSEHOLD INCOME
23.9%
WAGE / INCOME GAP [ % ]
76.1¢/ $1
WAGE / INCOME GAP [ $ ]
0.47
INEQUALITY / GINI INDEX
33,025
TOTAL POPULATION
15,998
MALE POPULATION
17,027
FEMALE POPULATION
93.96
MALES / 100 FEMALES
106.43
FEMALES / 100 MALES
49.5
MEDIAN AGE
2.8
AVG FAMILY SIZE
2.3
AVG HOUSEHOLD SIZE
17,448
LABOR FORCE [ PEOPLE ]
61.6%
PERCENT IN LABOR FORCE
4.5%
UNEMPLOYMENT RATE
Dana Point Zip Codes
Income in Dana Point
Income Overview in Dana Point
Per Capita Income in Dana Point is $74,878, while median incomes of families and households are $139,567 and $119,632 respectively.
| Characteristic | Number | Measure |
| Per Capita Income | 33,025 | $74,878 |
| Median Family Income | 9,203 | $139,567 |
| Mean Family Income | 9,203 | $201,237 |
| Median Household Income | 14,177 | $119,632 |
| Mean Household Income | 14,177 | $173,120 |
| Income Deficit | 9,203 | $0 |
| Wage / Income Gap (%) | 33,025 | 23.91% |
| Wage / Income Gap ($) | 33,025 | 76.09¢ per $1 |
| Gini / Inequality Index | 33,025 | 0.47 |
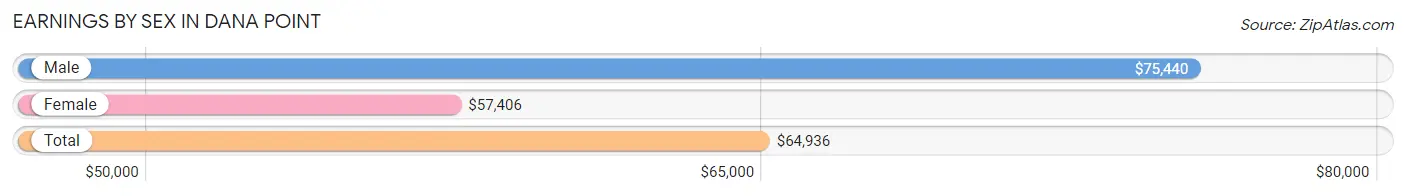
Earnings by Sex in Dana Point
Average Earnings in Dana Point are $64,936, $75,440 for men and $57,406 for women, a difference of 23.9%.
| Sex | Number | Average Earnings |
| Male | 9,355 (52.5%) | $75,440 |
| Female | 8,473 (47.5%) | $57,406 |
| Total | 17,828 (100.0%) | $64,936 |
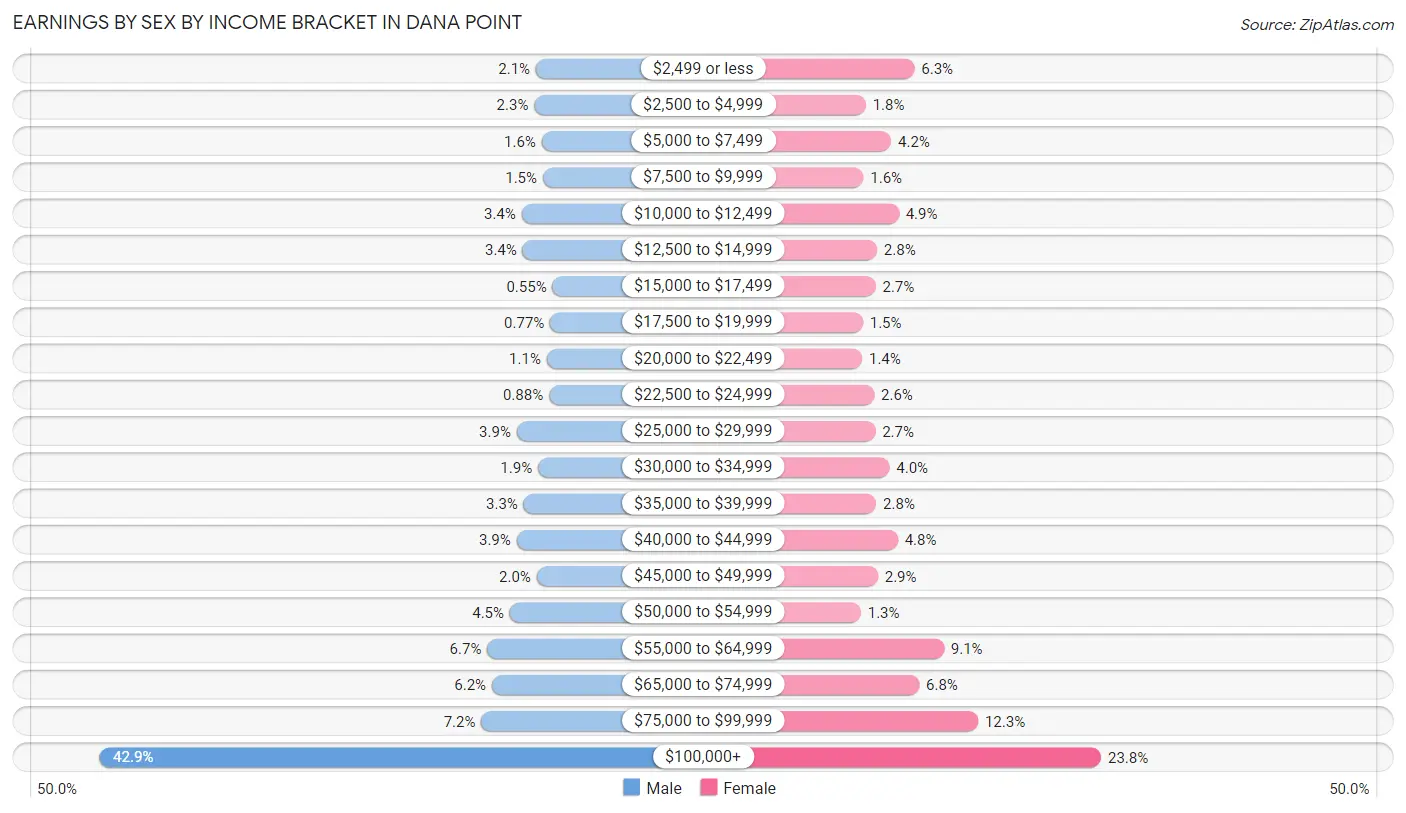
Earnings by Sex by Income Bracket in Dana Point
The most common earnings brackets in Dana Point are $100,000+ for men (4,015 | 42.9%) and $100,000+ for women (2,018 | 23.8%).
| Income | Male | Female |
| $2,499 or less | 196 (2.1%) | 536 (6.3%) |
| $2,500 to $4,999 | 211 (2.3%) | 150 (1.8%) |
| $5,000 to $7,499 | 146 (1.6%) | 352 (4.2%) |
| $7,500 to $9,999 | 136 (1.5%) | 131 (1.5%) |
| $10,000 to $12,499 | 322 (3.4%) | 412 (4.9%) |
| $12,500 to $14,999 | 313 (3.4%) | 239 (2.8%) |
| $15,000 to $17,499 | 51 (0.5%) | 228 (2.7%) |
| $17,500 to $19,999 | 72 (0.8%) | 127 (1.5%) |
| $20,000 to $22,499 | 102 (1.1%) | 121 (1.4%) |
| $22,500 to $24,999 | 82 (0.9%) | 217 (2.6%) |
| $25,000 to $29,999 | 365 (3.9%) | 225 (2.7%) |
| $30,000 to $34,999 | 179 (1.9%) | 338 (4.0%) |
| $35,000 to $39,999 | 304 (3.3%) | 233 (2.8%) |
| $40,000 to $44,999 | 366 (3.9%) | 404 (4.8%) |
| $45,000 to $49,999 | 190 (2.0%) | 246 (2.9%) |
| $50,000 to $54,999 | 425 (4.5%) | 111 (1.3%) |
| $55,000 to $64,999 | 623 (6.7%) | 770 (9.1%) |
| $65,000 to $74,999 | 582 (6.2%) | 574 (6.8%) |
| $75,000 to $99,999 | 675 (7.2%) | 1,041 (12.3%) |
| $100,000+ | 4,015 (42.9%) | 2,018 (23.8%) |
| Total | 9,355 (100.0%) | 8,473 (100.0%) |
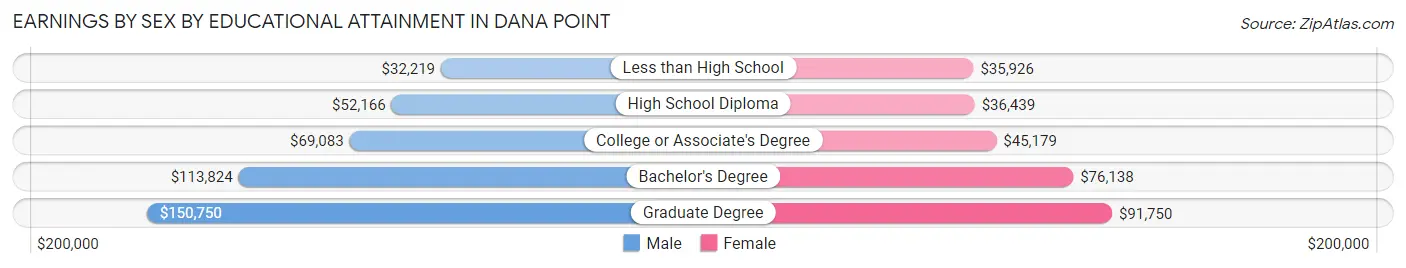
Earnings by Sex by Educational Attainment in Dana Point
Average earnings in Dana Point are $82,179 for men and $62,964 for women, a difference of 23.4%. Men with an educational attainment of graduate degree enjoy the highest average annual earnings of $150,750, while those with less than high school education earn the least with $32,219. Women with an educational attainment of graduate degree earn the most with the average annual earnings of $91,750, while those with less than high school education have the smallest earnings of $35,926.
| Educational Attainment | Male Income | Female Income |
| Less than High School | $32,219 | $35,926 |
| High School Diploma | $52,166 | $36,439 |
| College or Associate's Degree | $69,083 | $45,179 |
| Bachelor's Degree | $113,824 | $76,138 |
| Graduate Degree | $150,750 | $91,750 |
| Total | $82,179 | $62,964 |
Family Income in Dana Point
Family Income Brackets in Dana Point
According to the Dana Point family income data, there are 3,129 families falling into the $200,000+ income range, which is the most common income bracket and makes up 34.0% of all families. Conversely, the less than $10,000 income bracket is the least frequent group with only 120 families (1.3%) belonging to this category.
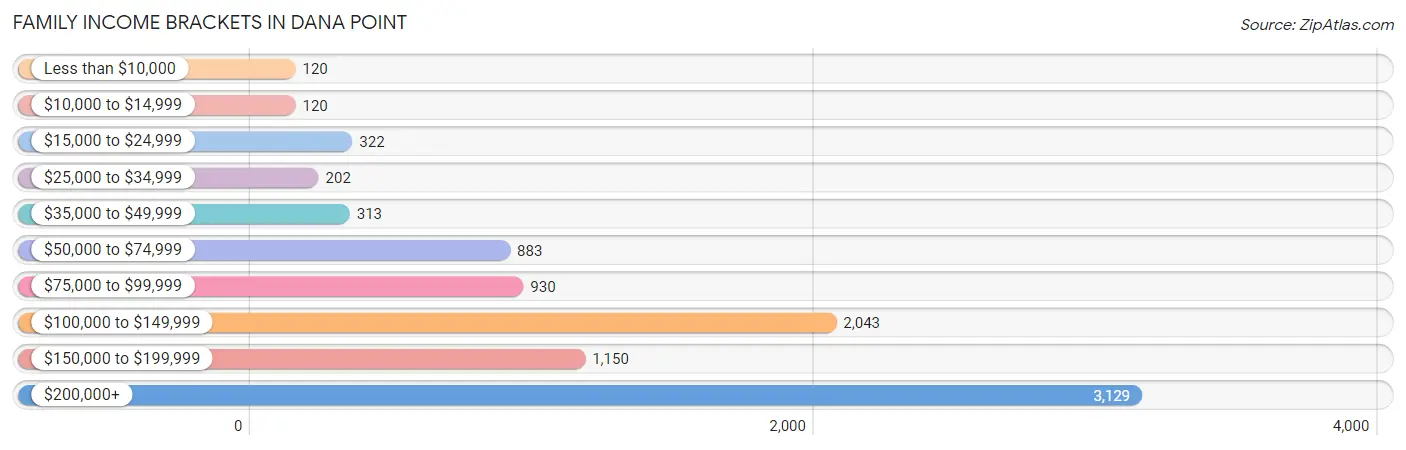
| Income Bracket | # Families | % Families |
| Less than $10,000 | 120 | 1.3% |
| $10,000 to $14,999 | 120 | 1.3% |
| $15,000 to $24,999 | 322 | 3.5% |
| $25,000 to $34,999 | 202 | 2.2% |
| $35,000 to $49,999 | 313 | 3.4% |
| $50,000 to $74,999 | 883 | 9.6% |
| $75,000 to $99,999 | 930 | 10.1% |
| $100,000 to $149,999 | 2,043 | 22.2% |
| $150,000 to $199,999 | 1,150 | 12.5% |
| $200,000+ | 3,129 | 34.0% |
Family Income by Famaliy Size in Dana Point
6-person families (105 | 1.1%) account for the highest median family income in Dana Point with $250,001 per family, while 2-person families (5,093 | 55.3%) have the highest median income of $67,463 per family member.
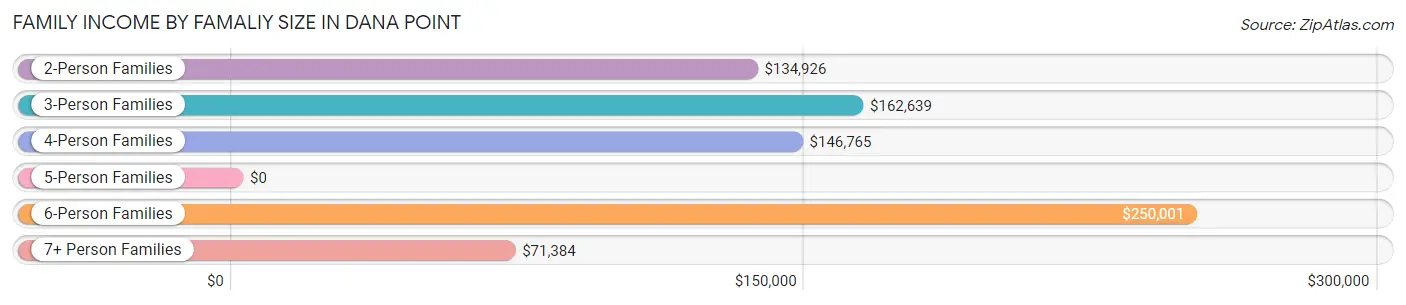
| Income Bracket | # Families | Median Income |
| 2-Person Families | 5,093 (55.3%) | $134,926 |
| 3-Person Families | 2,055 (22.3%) | $162,639 |
| 4-Person Families | 1,538 (16.7%) | $146,765 |
| 5-Person Families | 320 (3.5%) | $0 |
| 6-Person Families | 105 (1.1%) | $250,001 |
| 7+ Person Families | 92 (1.0%) | $71,384 |
| Total | 9,203 (100.0%) | $139,567 |
Family Income by Number of Earners in Dana Point
The median family income in Dana Point is $139,567, with families comprising 3+ earners (822) having the highest median family income of $178,750, while families with no earners (1,749) have the lowest median family income of $95,368, accounting for 8.9% and 19.0% of families, respectively.
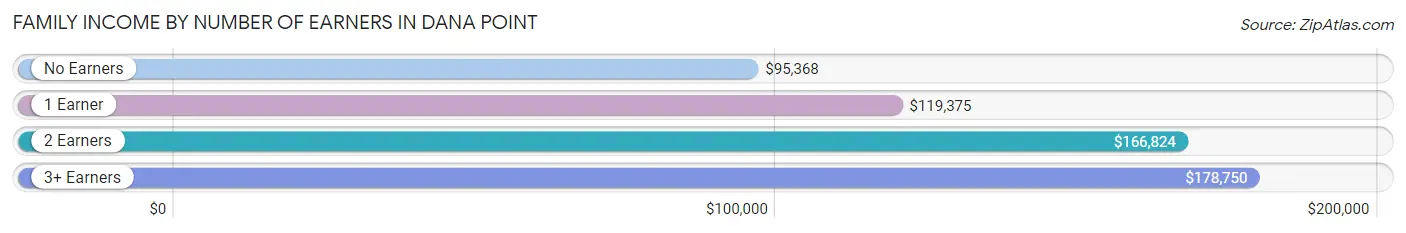
| Number of Earners | # Families | Median Income |
| No Earners | 1,749 (19.0%) | $95,368 |
| 1 Earner | 2,898 (31.5%) | $119,375 |
| 2 Earners | 3,734 (40.6%) | $166,824 |
| 3+ Earners | 822 (8.9%) | $178,750 |
| Total | 9,203 (100.0%) | $139,567 |
Household Income in Dana Point
Household Income Brackets in Dana Point
With 3,870 households falling in the category, the $200,000+ income range is the most frequent in Dana Point, accounting for 27.3% of all households. In contrast, only 284 households (2.0%) fall into the $10,000 to $14,999 income bracket, making it the least populous group.
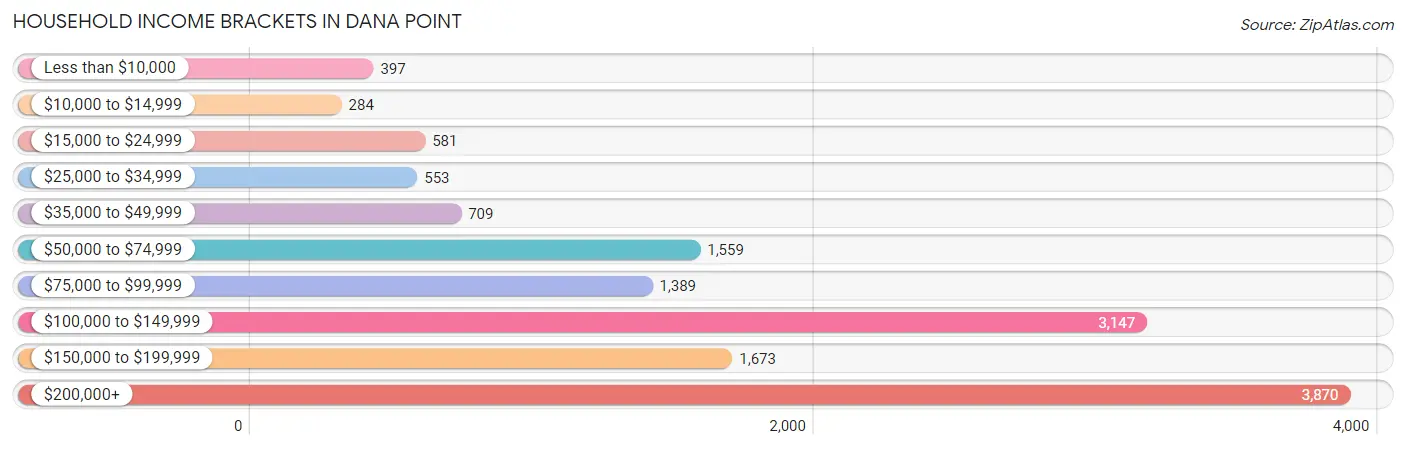
| Income Bracket | # Households | % Households |
| Less than $10,000 | 397 | 2.8% |
| $10,000 to $14,999 | 284 | 2.0% |
| $15,000 to $24,999 | 581 | 4.1% |
| $25,000 to $34,999 | 553 | 3.9% |
| $35,000 to $49,999 | 709 | 5.0% |
| $50,000 to $74,999 | 1,559 | 11.0% |
| $75,000 to $99,999 | 1,389 | 9.8% |
| $100,000 to $149,999 | 3,147 | 22.2% |
| $150,000 to $199,999 | 1,673 | 11.8% |
| $200,000+ | 3,870 | 27.3% |
Household Income by Householder Age in Dana Point
The median household income in Dana Point is $119,632, with the highest median household income of $131,111 found in the 45 to 64 years age bracket for the primary householder. A total of 6,380 households (45.0%) fall into this category. Meanwhile, the 15 to 24 years age bracket for the primary householder has the lowest median household income of $0, with 101 households (0.7%) in this group.
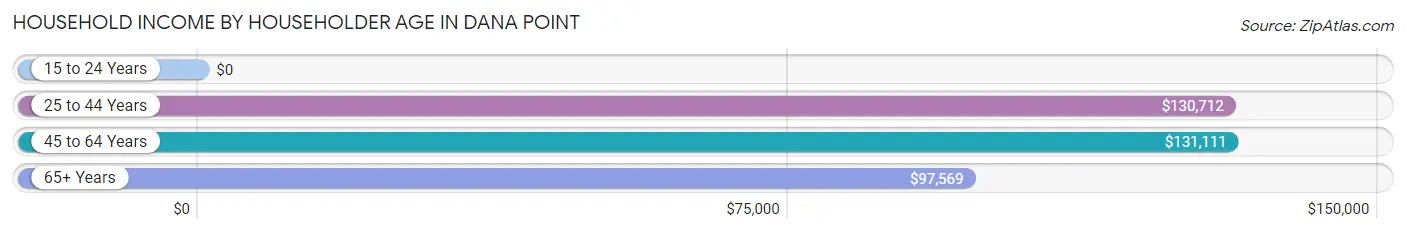
| Income Bracket | # Households | Median Income |
| 15 to 24 Years | 101 (0.7%) | $0 |
| 25 to 44 Years | 2,935 (20.7%) | $130,712 |
| 45 to 64 Years | 6,380 (45.0%) | $131,111 |
| 65+ Years | 4,761 (33.6%) | $97,569 |
| Total | 14,177 (100.0%) | $119,632 |
Poverty in Dana Point
Income Below Poverty by Sex and Age in Dana Point
With 5.9% poverty level for males and 6.6% for females among the residents of Dana Point, 5 year old males and 15 year old females are the most vulnerable to poverty, with 40 males (63.5%) and 23 females (79.3%) in their respective age groups living below the poverty level.
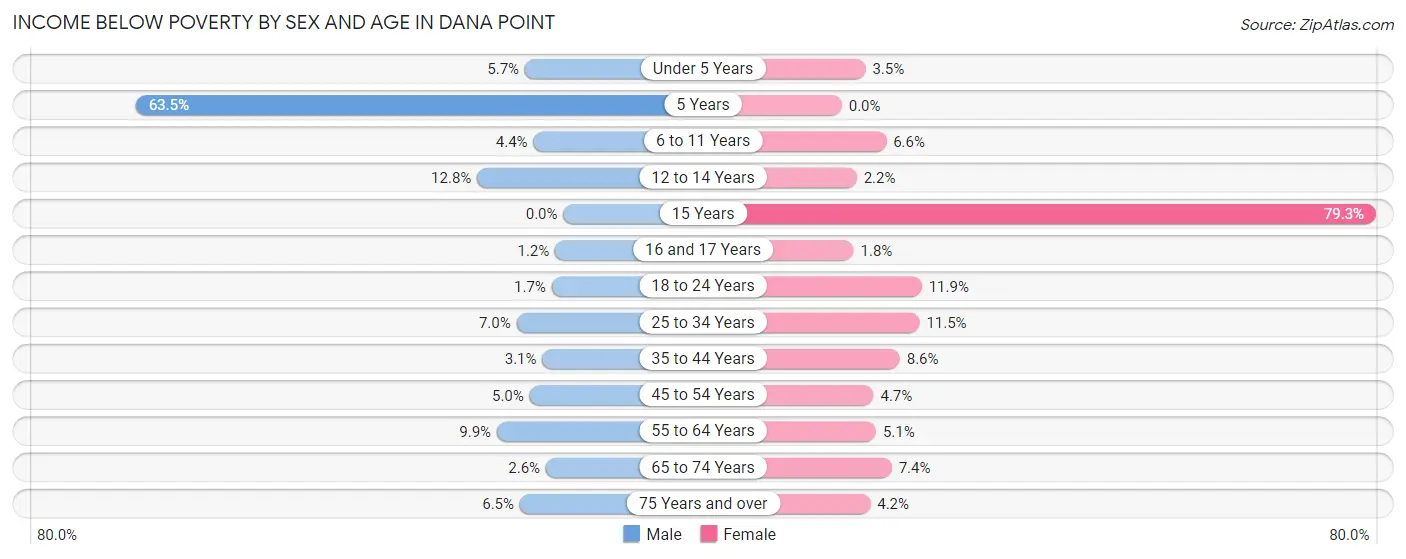
| Age Bracket | Male | Female |
| Under 5 Years | 52 (5.7%) | 19 (3.5%) |
| 5 Years | 40 (63.5%) | 0 (0.0%) |
| 6 to 11 Years | 39 (4.4%) | 55 (6.6%) |
| 12 to 14 Years | 69 (12.8%) | 16 (2.2%) |
| 15 Years | 0 (0.0%) | 23 (79.3%) |
| 16 and 17 Years | 9 (1.2%) | 8 (1.8%) |
| 18 to 24 Years | 14 (1.7%) | 125 (11.9%) |
| 25 to 34 Years | 119 (7.0%) | 194 (11.5%) |
| 35 to 44 Years | 49 (3.1%) | 143 (8.6%) |
| 45 to 54 Years | 114 (5.0%) | 138 (4.7%) |
| 55 to 64 Years | 286 (9.9%) | 147 (5.1%) |
| 65 to 74 Years | 56 (2.6%) | 194 (7.4%) |
| 75 Years and over | 84 (6.5%) | 62 (4.2%) |
| Total | 931 (5.9%) | 1,124 (6.6%) |
Income Above Poverty by Sex and Age in Dana Point
According to the poverty statistics in Dana Point, males aged 15 years and females aged 5 years are the age groups that are most secure financially, with 100.0% of males and 100.0% of females in these age groups living above the poverty line.
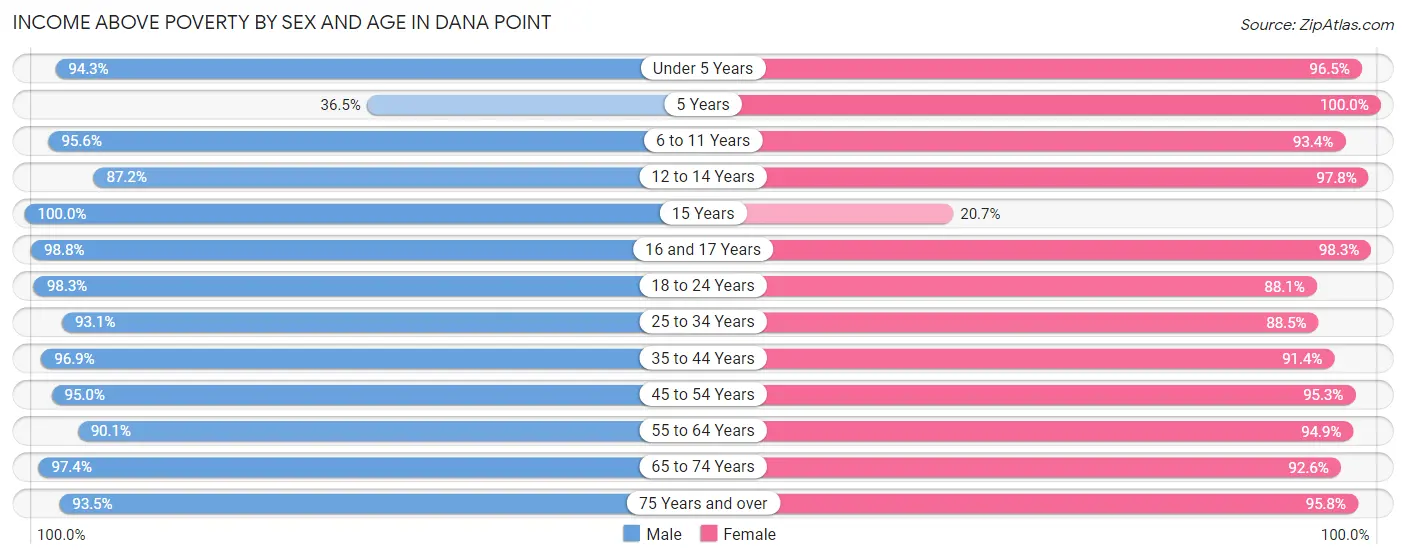
| Age Bracket | Male | Female |
| Under 5 Years | 858 (94.3%) | 522 (96.5%) |
| 5 Years | 23 (36.5%) | 69 (100.0%) |
| 6 to 11 Years | 840 (95.6%) | 779 (93.4%) |
| 12 to 14 Years | 470 (87.2%) | 704 (97.8%) |
| 15 Years | 61 (100.0%) | 6 (20.7%) |
| 16 and 17 Years | 731 (98.8%) | 450 (98.3%) |
| 18 to 24 Years | 795 (98.3%) | 928 (88.1%) |
| 25 to 34 Years | 1,593 (93.0%) | 1,489 (88.5%) |
| 35 to 44 Years | 1,522 (96.9%) | 1,517 (91.4%) |
| 45 to 54 Years | 2,162 (95.0%) | 2,794 (95.3%) |
| 55 to 64 Years | 2,616 (90.1%) | 2,753 (94.9%) |
| 65 to 74 Years | 2,105 (97.4%) | 2,424 (92.6%) |
| 75 Years and over | 1,216 (93.5%) | 1,405 (95.8%) |
| Total | 14,992 (94.2%) | 15,840 (93.4%) |
Income Below Poverty Among Married-Couple Families in Dana Point
The poverty statistics for married-couple families in Dana Point show that 3.8% or 288 of the total 7,477 families live below the poverty line. Families with no children have the highest poverty rate of 4.6%, comprising of 239 families. On the other hand, families with 3 or 4 children have the lowest poverty rate of 1.9%, which includes 6 families.
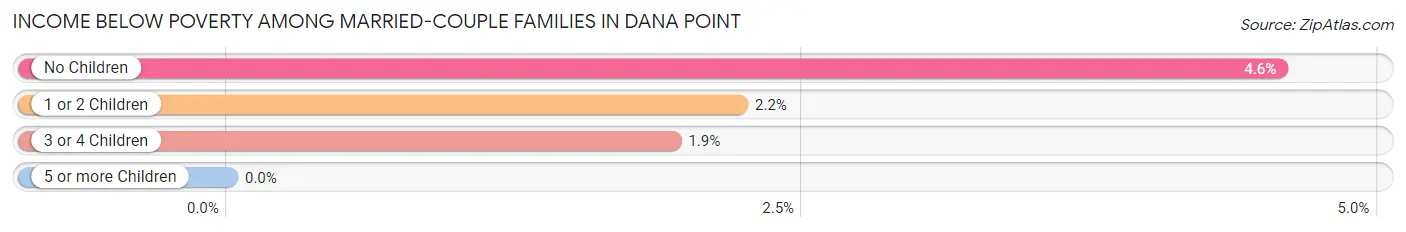
| Children | Above Poverty | Below Poverty |
| No Children | 4,994 (95.4%) | 239 (4.6%) |
| 1 or 2 Children | 1,890 (97.8%) | 43 (2.2%) |
| 3 or 4 Children | 305 (98.1%) | 6 (1.9%) |
| 5 or more Children | 0 (0.0%) | 0 (0.0%) |
| Total | 7,189 (96.2%) | 288 (3.8%) |
Income Below Poverty Among Single-Parent Households in Dana Point
According to the poverty data in Dana Point, 5.7% or 32 single-father households and 10.5% or 123 single-mother households are living below the poverty line. Among single-father households, those with 1 or 2 children have the highest poverty rate, with 32 households (11.1%) experiencing poverty. Likewise, among single-mother households, those with 3 or 4 children have the highest poverty rate, with 16 households (42.1%) falling below the poverty line.
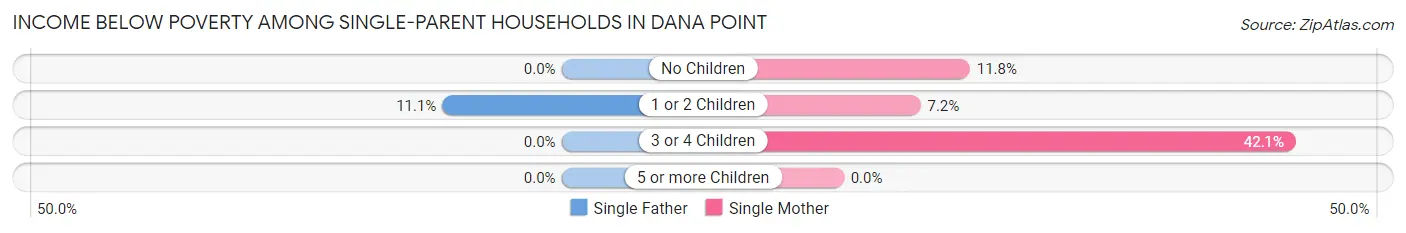
| Children | Single Father | Single Mother |
| No Children | 0 (0.0%) | 67 (11.7%) |
| 1 or 2 Children | 32 (11.1%) | 40 (7.2%) |
| 3 or 4 Children | 0 (0.0%) | 16 (42.1%) |
| 5 or more Children | 0 (0.0%) | 0 (0.0%) |
| Total | 32 (5.7%) | 123 (10.5%) |
Income Below Poverty Among Married-Couple vs Single-Parent Households in Dana Point
The poverty data for Dana Point shows that 288 of the married-couple family households (3.8%) and 155 of the single-parent households (9.0%) are living below the poverty level. Within the married-couple family households, those with no children have the highest poverty rate, with 239 households (4.6%) falling below the poverty line. Among the single-parent households, those with 3 or 4 children have the highest poverty rate, with 16 household (19.3%) living below poverty.
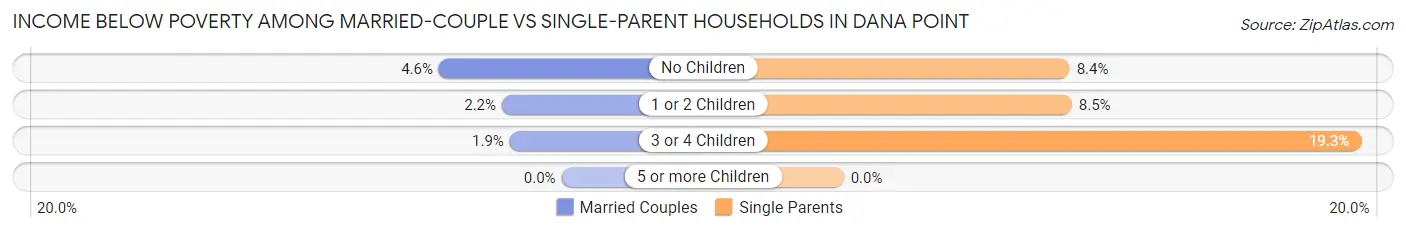
| Children | Married-Couple Families | Single-Parent Households |
| No Children | 239 (4.6%) | 67 (8.4%) |
| 1 or 2 Children | 43 (2.2%) | 72 (8.5%) |
| 3 or 4 Children | 6 (1.9%) | 16 (19.3%) |
| 5 or more Children | 0 (0.0%) | 0 (0.0%) |
| Total | 288 (3.8%) | 155 (9.0%) |
Race in Dana Point
The most populous races in Dana Point are White / Caucasian (27,373 | 82.9%), Hispanic or Latino (5,206 | 15.8%), and Two or more Races (2,155 | 6.5%).
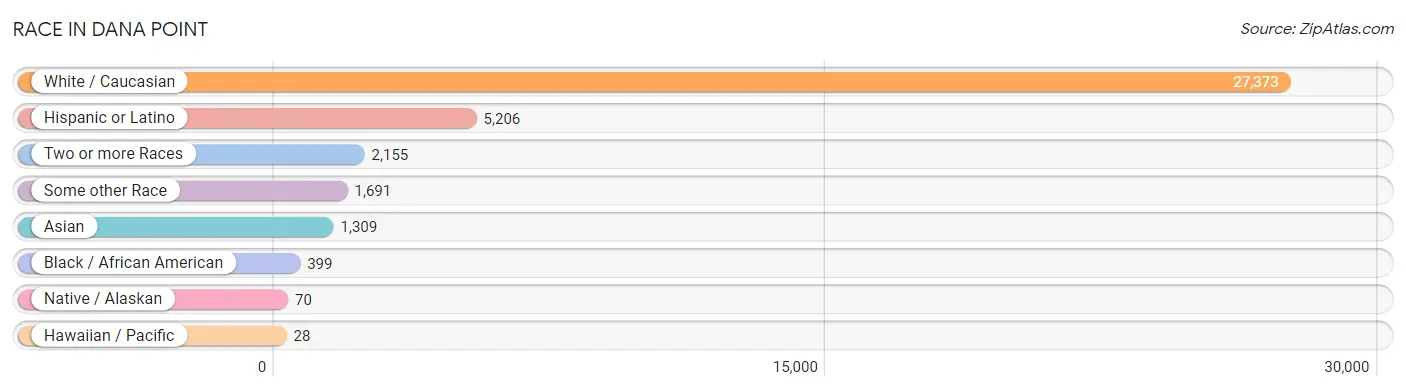
| Race | # Population | % Population |
| Asian | 1,309 | 4.0% |
| Black / African American | 399 | 1.2% |
| Hawaiian / Pacific | 28 | 0.1% |
| Hispanic or Latino | 5,206 | 15.8% |
| Native / Alaskan | 70 | 0.2% |
| White / Caucasian | 27,373 | 82.9% |
| Two or more Races | 2,155 | 6.5% |
| Some other Race | 1,691 | 5.1% |
| Total | 33,025 | 100.0% |
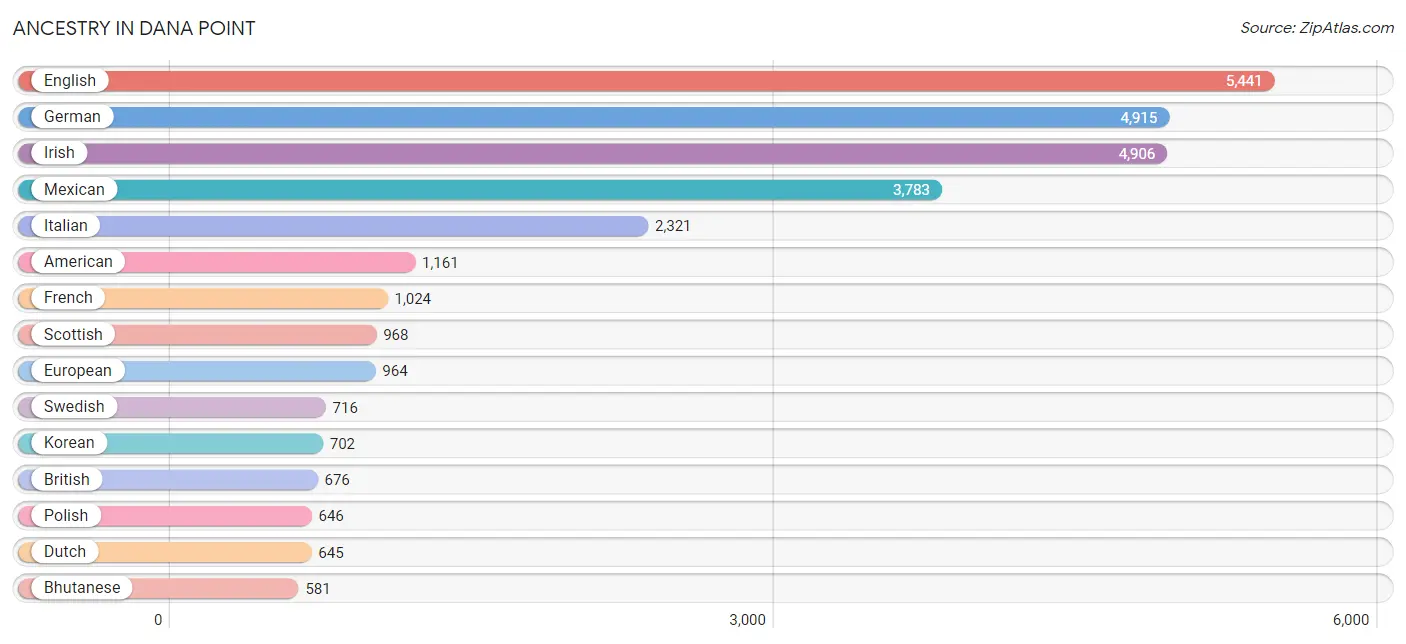
Ancestry in Dana Point
The most populous ancestries reported in Dana Point are English (5,441 | 16.5%), German (4,915 | 14.9%), Irish (4,906 | 14.9%), Mexican (3,783 | 11.5%), and Italian (2,321 | 7.0%), together accounting for 64.7% of all Dana Point residents.
| Ancestry | # Population | % Population |
| African | 101 | 0.3% |
| American | 1,161 | 3.5% |
| Arab | 386 | 1.2% |
| Argentinean | 36 | 0.1% |
| Armenian | 21 | 0.1% |
| Assyrian / Chaldean / Syriac | 42 | 0.1% |
| Australian | 53 | 0.2% |
| Austrian | 65 | 0.2% |
| Basque | 80 | 0.2% |
| Belgian | 30 | 0.1% |
| Bhutanese | 581 | 1.8% |
| Bolivian | 54 | 0.2% |
| Brazilian | 36 | 0.1% |
| British | 676 | 2.1% |
| Bulgarian | 29 | 0.1% |
| Burmese | 42 | 0.1% |
| Canadian | 107 | 0.3% |
| Central American | 131 | 0.4% |
| Central American Indian | 10 | 0.0% |
| Cherokee | 59 | 0.2% |
| Chilean | 22 | 0.1% |
| Colombian | 65 | 0.2% |
| Croatian | 67 | 0.2% |
| Cuban | 22 | 0.1% |
| Czech | 54 | 0.2% |
| Czechoslovakian | 55 | 0.2% |
| Danish | 380 | 1.1% |
| Dominican | 3 | 0.0% |
| Dutch | 645 | 1.9% |
| Eastern European | 333 | 1.0% |
| Ecuadorian | 47 | 0.1% |
| Egyptian | 33 | 0.1% |
| English | 5,441 | 16.5% |
| Estonian | 75 | 0.2% |
| Ethiopian | 73 | 0.2% |
| European | 964 | 2.9% |
| Filipino | 105 | 0.3% |
| Finnish | 108 | 0.3% |
| French | 1,024 | 3.1% |
| French Canadian | 578 | 1.8% |
| German | 4,915 | 14.9% |
| Greek | 112 | 0.3% |
| Guamanian / Chamorro | 13 | 0.0% |
| Honduran | 10 | 0.0% |
| Hungarian | 107 | 0.3% |
| Icelander | 50 | 0.2% |
| Indian (Asian) | 367 | 1.1% |
| Iranian | 526 | 1.6% |
| Irish | 4,906 | 14.9% |
| Iroquois | 59 | 0.2% |
| Israeli | 78 | 0.2% |
| Italian | 2,321 | 7.0% |
| Japanese | 34 | 0.1% |
| Jordanian | 7 | 0.0% |
| Korean | 702 | 2.1% |
| Laotian | 92 | 0.3% |
| Lebanese | 147 | 0.4% |
| Lithuanian | 25 | 0.1% |
| Luxembourger | 15 | 0.1% |
| Macedonian | 55 | 0.2% |
| Malaysian | 14 | 0.0% |
| Mexican | 3,783 | 11.5% |
| Mexican American Indian | 9 | 0.0% |
| Native Hawaiian | 15 | 0.1% |
| New Zealander | 27 | 0.1% |
| Nicaraguan | 81 | 0.3% |
| Northern European | 380 | 1.1% |
| Norwegian | 472 | 1.4% |
| Paiute | 11 | 0.0% |
| Pakistani | 26 | 0.1% |
| Palestinian | 8 | 0.0% |
| Paraguayan | 30 | 0.1% |
| Peruvian | 22 | 0.1% |
| Polish | 646 | 2.0% |
| Portuguese | 325 | 1.0% |
| Puerto Rican | 72 | 0.2% |
| Romanian | 75 | 0.2% |
| Russian | 492 | 1.5% |
| Salvadoran | 40 | 0.1% |
| Samoan | 36 | 0.1% |
| Scandinavian | 339 | 1.0% |
| Scotch-Irish | 412 | 1.3% |
| Scottish | 968 | 2.9% |
| Slovak | 34 | 0.1% |
| Slovene | 13 | 0.0% |
| South American | 308 | 0.9% |
| South American Indian | 19 | 0.1% |
| Spaniard | 483 | 1.5% |
| Spanish | 289 | 0.9% |
| Sri Lankan | 187 | 0.6% |
| Subsaharan African | 174 | 0.5% |
| Swedish | 716 | 2.2% |
| Swiss | 71 | 0.2% |
| Syrian | 165 | 0.5% |
| Thai | 64 | 0.2% |
| Tongan | 20 | 0.1% |
| Turkish | 28 | 0.1% |
| Ukrainian | 136 | 0.4% |
| Uruguayan | 19 | 0.1% |
| Welsh | 226 | 0.7% | View All 100 Rows |
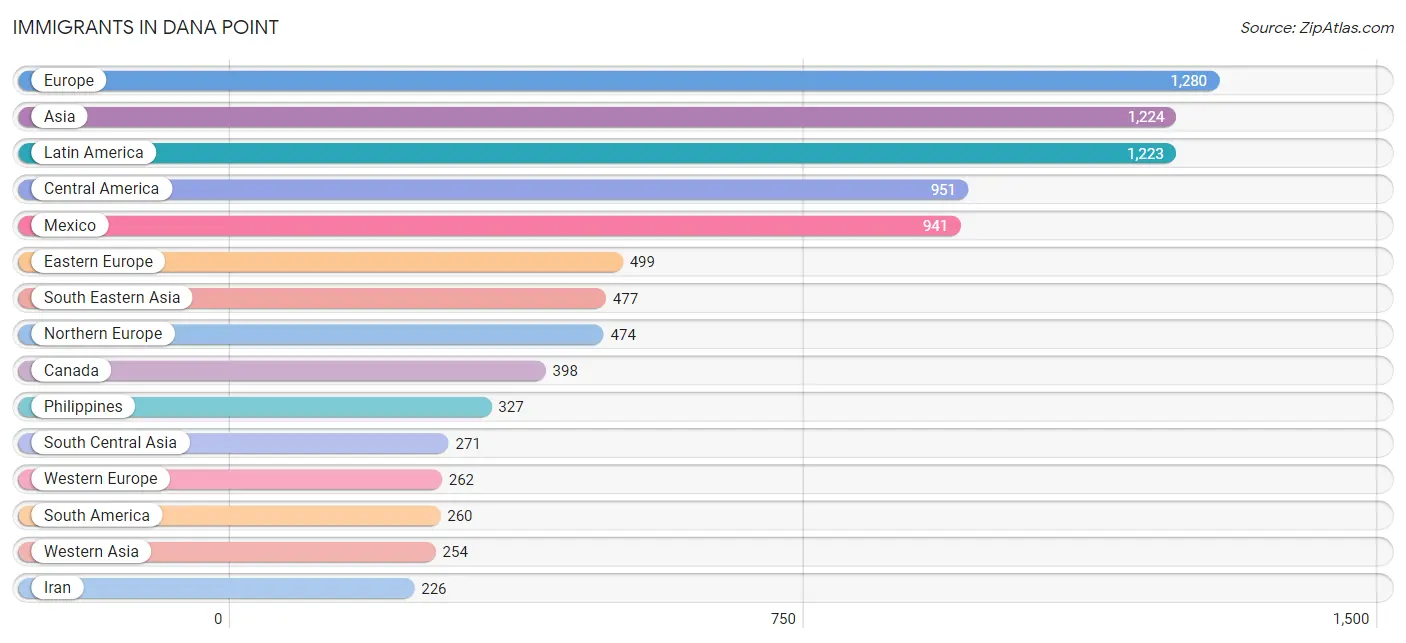
Immigrants in Dana Point
The most numerous immigrant groups reported in Dana Point came from Europe (1,280 | 3.9%), Asia (1,224 | 3.7%), Latin America (1,223 | 3.7%), Central America (951 | 2.9%), and Mexico (941 | 2.9%), together accounting for 17.0% of all Dana Point residents.
| Immigration Origin | # Population | % Population |
| Africa | 152 | 0.5% |
| Argentina | 24 | 0.1% |
| Asia | 1,224 | 3.7% |
| Australia | 42 | 0.1% |
| Austria | 47 | 0.1% |
| Brazil | 66 | 0.2% |
| Bulgaria | 29 | 0.1% |
| Cambodia | 15 | 0.1% |
| Canada | 398 | 1.2% |
| Caribbean | 12 | 0.0% |
| Central America | 951 | 2.9% |
| China | 135 | 0.4% |
| Colombia | 86 | 0.3% |
| Croatia | 43 | 0.1% |
| Cuba | 9 | 0.0% |
| Czechoslovakia | 55 | 0.2% |
| Denmark | 8 | 0.0% |
| Dominican Republic | 3 | 0.0% |
| Eastern Africa | 47 | 0.1% |
| Eastern Asia | 222 | 0.7% |
| Eastern Europe | 499 | 1.5% |
| Ecuador | 47 | 0.1% |
| Egypt | 44 | 0.1% |
| England | 191 | 0.6% |
| Eritrea | 23 | 0.1% |
| Ethiopia | 24 | 0.1% |
| Europe | 1,280 | 3.9% |
| France | 85 | 0.3% |
| Germany | 60 | 0.2% |
| Honduras | 10 | 0.0% |
| Hong Kong | 19 | 0.1% |
| Hungary | 42 | 0.1% |
| India | 45 | 0.1% |
| Indonesia | 23 | 0.1% |
| Iran | 226 | 0.7% |
| Ireland | 59 | 0.2% |
| Israel | 86 | 0.3% |
| Italy | 29 | 0.1% |
| Japan | 56 | 0.2% |
| Korea | 31 | 0.1% |
| Latin America | 1,223 | 3.7% |
| Lebanon | 66 | 0.2% |
| Mexico | 941 | 2.9% |
| Netherlands | 70 | 0.2% |
| Nigeria | 15 | 0.1% |
| North Macedonia | 43 | 0.1% |
| Northern Africa | 44 | 0.1% |
| Northern Europe | 474 | 1.4% |
| Norway | 32 | 0.1% |
| Oceania | 146 | 0.4% |
| Peru | 7 | 0.0% |
| Philippines | 327 | 1.0% |
| Poland | 29 | 0.1% |
| Romania | 84 | 0.3% |
| Russia | 123 | 0.4% |
| Scotland | 11 | 0.0% |
| South Africa | 46 | 0.1% |
| South America | 260 | 0.8% |
| South Central Asia | 271 | 0.8% |
| South Eastern Asia | 477 | 1.4% |
| Southern Europe | 45 | 0.1% |
| Spain | 16 | 0.1% |
| Sweden | 9 | 0.0% |
| Syria | 74 | 0.2% |
| Taiwan | 12 | 0.0% |
| Thailand | 26 | 0.1% |
| Turkey | 28 | 0.1% |
| Ukraine | 24 | 0.1% |
| Vietnam | 86 | 0.3% |
| Western Africa | 15 | 0.1% |
| Western Asia | 254 | 0.8% |
| Western Europe | 262 | 0.8% | View All 72 Rows |
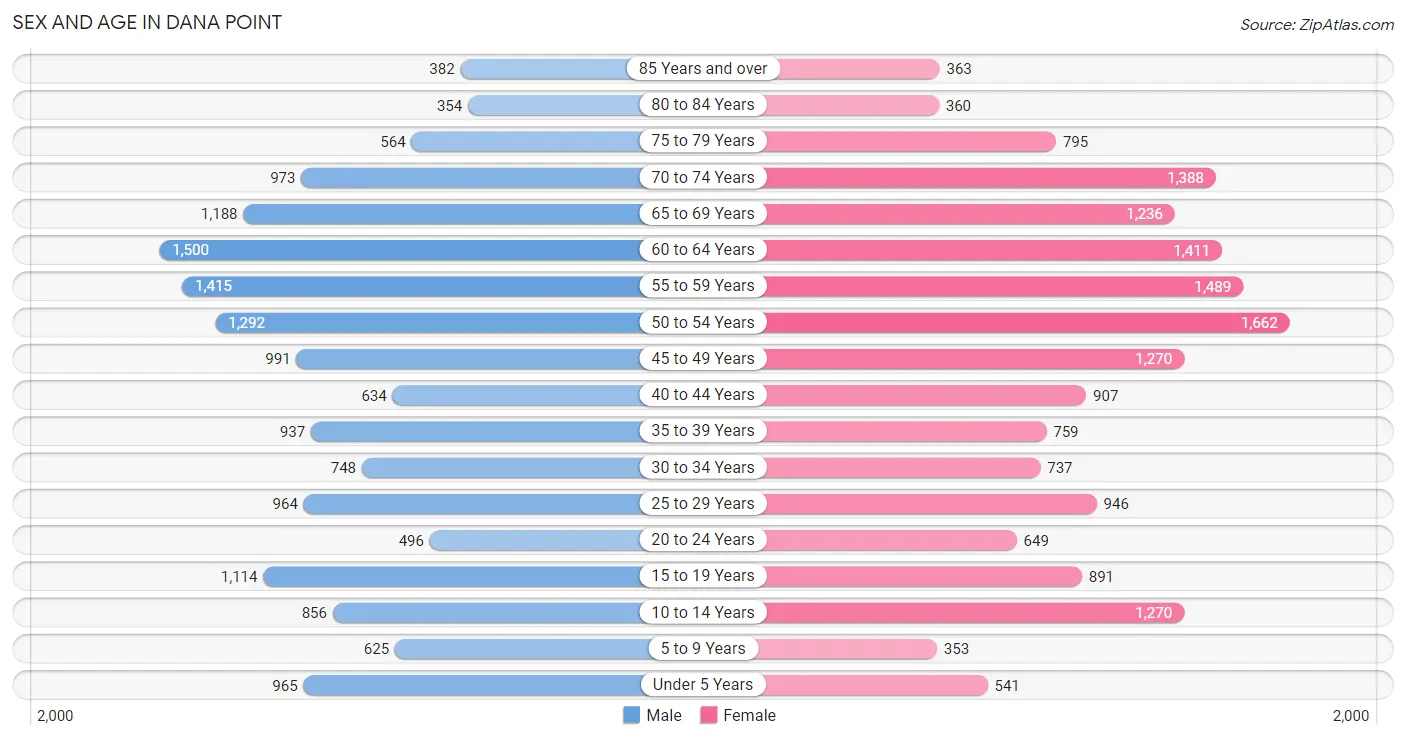
Sex and Age in Dana Point
Sex and Age in Dana Point
The most populous age groups in Dana Point are 60 to 64 Years (1,500 | 9.4%) for men and 50 to 54 Years (1,662 | 9.8%) for women.
| Age Bracket | Male | Female |
| Under 5 Years | 965 (6.0%) | 541 (3.2%) |
| 5 to 9 Years | 625 (3.9%) | 353 (2.1%) |
| 10 to 14 Years | 856 (5.3%) | 1,270 (7.5%) |
| 15 to 19 Years | 1,114 (7.0%) | 891 (5.2%) |
| 20 to 24 Years | 496 (3.1%) | 649 (3.8%) |
| 25 to 29 Years | 964 (6.0%) | 946 (5.6%) |
| 30 to 34 Years | 748 (4.7%) | 737 (4.3%) |
| 35 to 39 Years | 937 (5.9%) | 759 (4.5%) |
| 40 to 44 Years | 634 (4.0%) | 907 (5.3%) |
| 45 to 49 Years | 991 (6.2%) | 1,270 (7.5%) |
| 50 to 54 Years | 1,292 (8.1%) | 1,662 (9.8%) |
| 55 to 59 Years | 1,415 (8.8%) | 1,489 (8.7%) |
| 60 to 64 Years | 1,500 (9.4%) | 1,411 (8.3%) |
| 65 to 69 Years | 1,188 (7.4%) | 1,236 (7.3%) |
| 70 to 74 Years | 973 (6.1%) | 1,388 (8.2%) |
| 75 to 79 Years | 564 (3.5%) | 795 (4.7%) |
| 80 to 84 Years | 354 (2.2%) | 360 (2.1%) |
| 85 Years and over | 382 (2.4%) | 363 (2.1%) |
| Total | 15,998 (100.0%) | 17,027 (100.0%) |
Families and Households in Dana Point
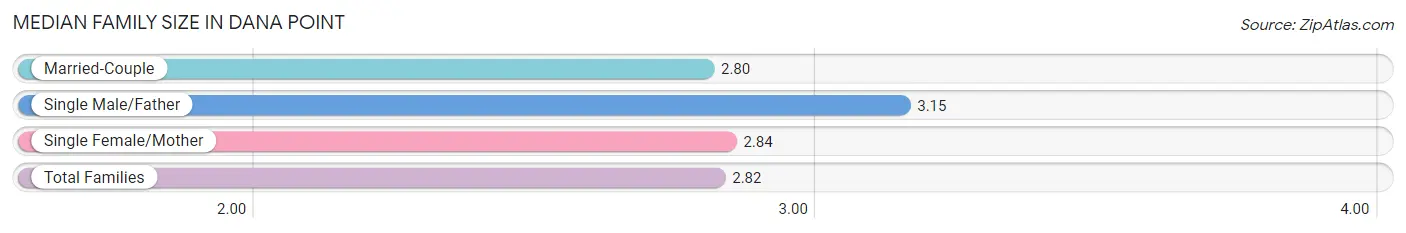
Median Family Size in Dana Point
The median family size in Dana Point is 2.82 persons per family, with single male/father families (559 | 6.1%) accounting for the largest median family size of 3.15 persons per family. On the other hand, married-couple families (7,477 | 81.2%) represent the smallest median family size with 2.80 persons per family.
| Family Type | # Families | Family Size |
| Married-Couple | 7,477 (81.2%) | 2.80 |
| Single Male/Father | 559 (6.1%) | 3.15 |
| Single Female/Mother | 1,167 (12.7%) | 2.84 |
| Total Families | 9,203 (100.0%) | 2.82 |
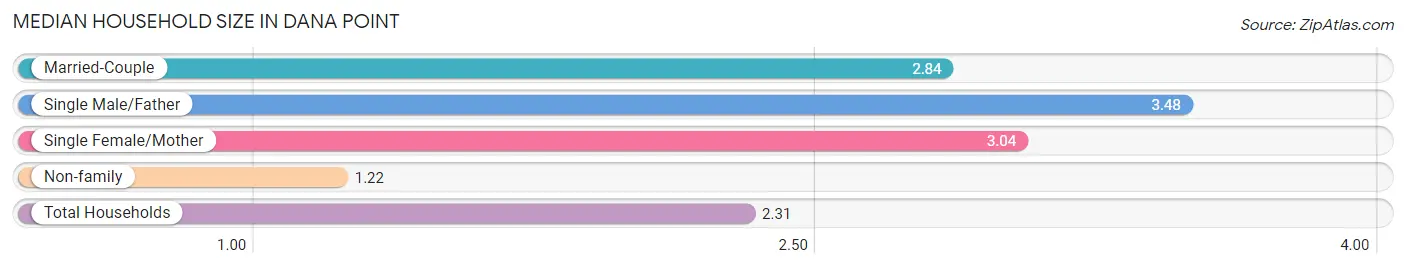
Median Household Size in Dana Point
The median household size in Dana Point is 2.31 persons per household, with single male/father households (559 | 3.9%) accounting for the largest median household size of 3.48 persons per household. non-family households (4,974 | 35.1%) represent the smallest median household size with 1.22 persons per household.
| Household Type | # Households | Household Size |
| Married-Couple | 7,477 (52.7%) | 2.84 |
| Single Male/Father | 559 (3.9%) | 3.48 |
| Single Female/Mother | 1,167 (8.2%) | 3.04 |
| Non-family | 4,974 (35.1%) | 1.22 |
| Total Households | 14,177 (100.0%) | 2.31 |
Household Size by Marriage Status in Dana Point
Out of a total of 14,177 households in Dana Point, 9,203 (64.9%) are family households, while 4,974 (35.1%) are nonfamily households. The most numerous type of family households are 2-person households, comprising 4,854, and the most common type of nonfamily households are 1-person households, comprising 3,978.
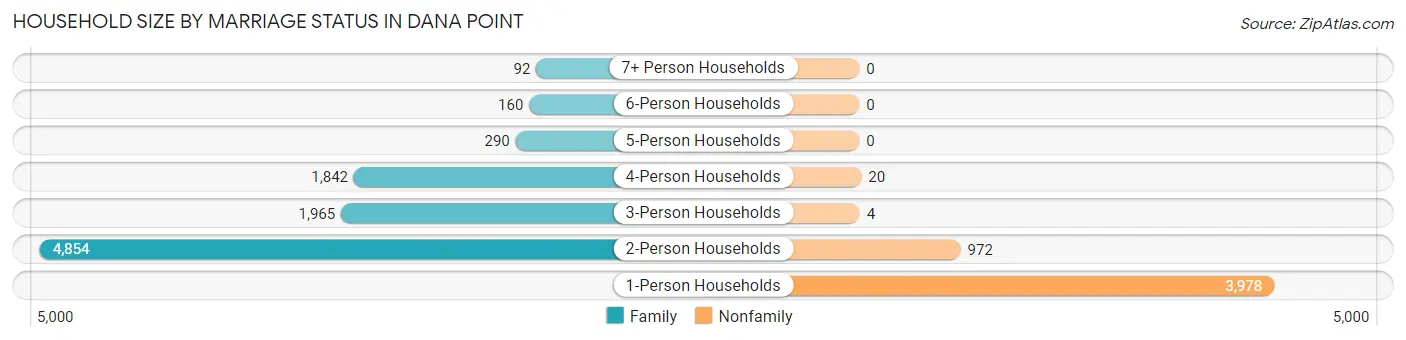
| Household Size | Family Households | Nonfamily Households |
| 1-Person Households | - | 3,978 (28.1%) |
| 2-Person Households | 4,854 (34.2%) | 972 (6.9%) |
| 3-Person Households | 1,965 (13.9%) | 4 (0.0%) |
| 4-Person Households | 1,842 (13.0%) | 20 (0.1%) |
| 5-Person Households | 290 (2.1%) | 0 (0.0%) |
| 6-Person Households | 160 (1.1%) | 0 (0.0%) |
| 7+ Person Households | 92 (0.6%) | 0 (0.0%) |
| Total | 9,203 (64.9%) | 4,974 (35.1%) |
Female Fertility in Dana Point
Fertility by Age in Dana Point
Average fertility rate in Dana Point is 48.0 births per 1,000 women. Women in the age bracket of 20 to 34 years have the highest fertility rate with 117.0 births per 1,000 women. Women in the age bracket of 20 to 34 years acount for 86.7% of all women with births.
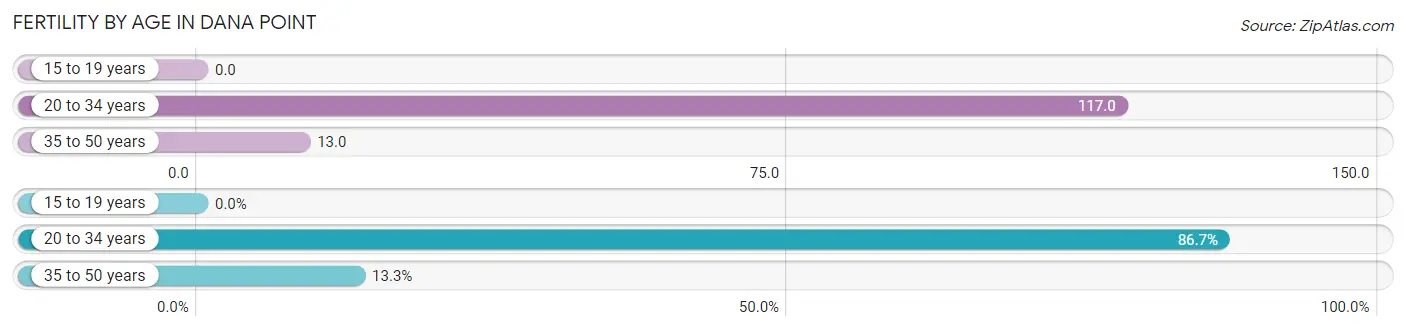
| Age Bracket | Women with Births | Births / 1,000 Women |
| 15 to 19 years | 0 (0.0%) | 0.0 |
| 20 to 34 years | 273 (86.7%) | 117.0 |
| 35 to 50 years | 42 (13.3%) | 13.0 |
| Total | 315 (100.0%) | 48.0 |
Fertility by Age by Marriage Status in Dana Point
92.1% of women with births (315) in Dana Point are married. The highest percentage of unmarried women with births falls into 20 to 34 years age bracket with 9.2% of them unmarried at the time of birth, while the lowest percentage of unmarried women with births belong to 35 to 50 years age bracket with 0.0% of them unmarried.
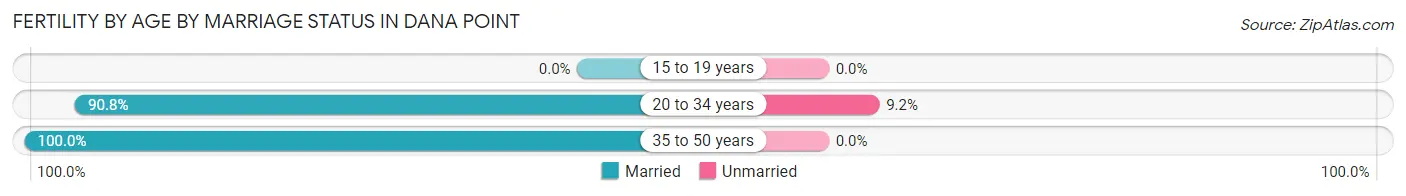
| Age Bracket | Married | Unmarried |
| 15 to 19 years | 0 (0.0%) | 0 (0.0%) |
| 20 to 34 years | 248 (90.8%) | 25 (9.2%) |
| 35 to 50 years | 42 (100.0%) | 0 (0.0%) |
| Total | 290 (92.1%) | 25 (7.9%) |
Fertility by Education in Dana Point
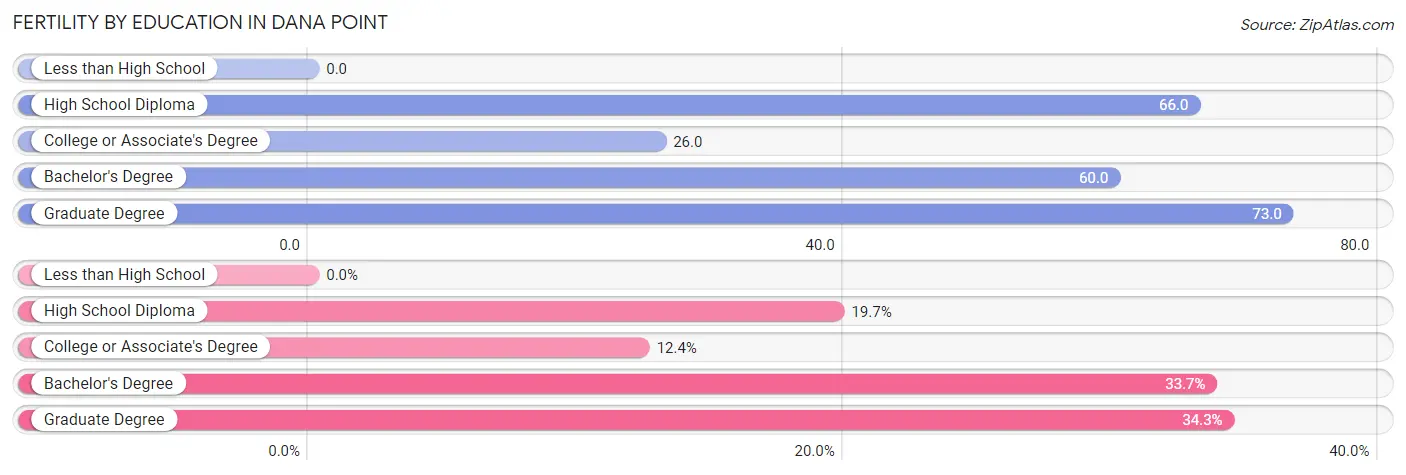
| Educational Attainment | Women with Births | Births / 1,000 Women |
| Less than High School | 0 (0.0%) | 0.0 |
| High School Diploma | 62 (19.7%) | 66.0 |
| College or Associate's Degree | 39 (12.4%) | 26.0 |
| Bachelor's Degree | 106 (33.7%) | 60.0 |
| Graduate Degree | 108 (34.3%) | 73.0 |
| Total | 315 (100.0%) | 48.0 |
Fertility by Education by Marriage Status in Dana Point
7.9% of women with births in Dana Point are unmarried. Women with the educational attainment of high school diploma are most likely to be married with 100.0% of them married at childbirth, while women with the educational attainment of college or associate's degree are least likely to be married with 64.1% of them unmarried at childbirth.
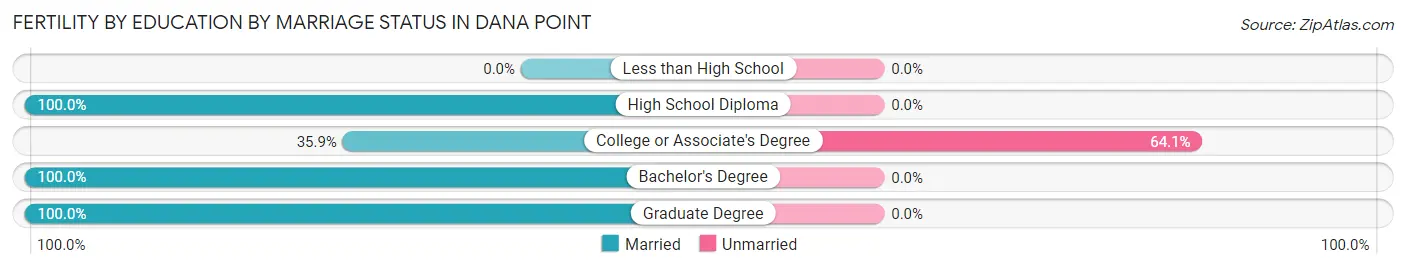
| Educational Attainment | Married | Unmarried |
| Less than High School | 0 (0.0%) | 0 (0.0%) |
| High School Diploma | 62 (100.0%) | 0 (0.0%) |
| College or Associate's Degree | 14 (35.9%) | 25 (64.1%) |
| Bachelor's Degree | 106 (100.0%) | 0 (0.0%) |
| Graduate Degree | 108 (100.0%) | 0 (0.0%) |
| Total | 290 (92.1%) | 25 (7.9%) |
Employment Characteristics in Dana Point
Employment by Class of Employer in Dana Point
Among the 16,466 employed individuals in Dana Point, private company employees (9,556 | 58.0%), self-employed (not incorporated) (1,885 | 11.5%), and self-employed (incorporated) (1,471 | 8.9%) make up the most common classes of employment.
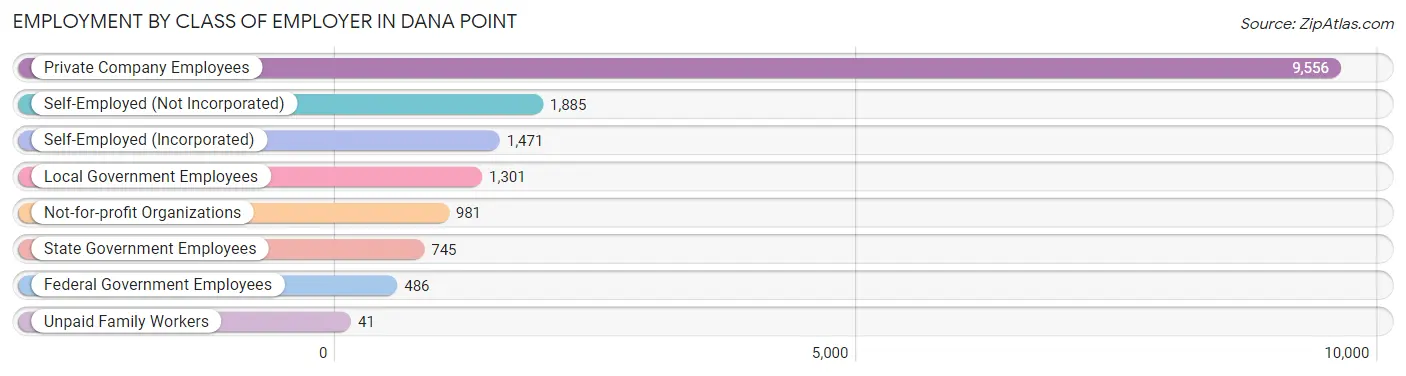
| Employer Class | # Employees | % Employees |
| Private Company Employees | 9,556 | 58.0% |
| Self-Employed (Incorporated) | 1,471 | 8.9% |
| Self-Employed (Not Incorporated) | 1,885 | 11.5% |
| Not-for-profit Organizations | 981 | 6.0% |
| Local Government Employees | 1,301 | 7.9% |
| State Government Employees | 745 | 4.5% |
| Federal Government Employees | 486 | 2.9% |
| Unpaid Family Workers | 41 | 0.3% |
| Total | 16,466 | 100.0% |
Employment Status by Age in Dana Point
According to the labor force statistics for Dana Point, out of the total population over 16 years of age (28,325), 61.6% or 17,448 individuals are in the labor force, with 4.5% or 785 of them unemployed. The age group with the highest labor force participation rate is 35 to 44 years, with 86.5% or 2,800 individuals in the labor force. Within the labor force, the 25 to 29 years age range has the highest percentage of unemployed individuals, with 11.8% or 188 of them being unemployed.
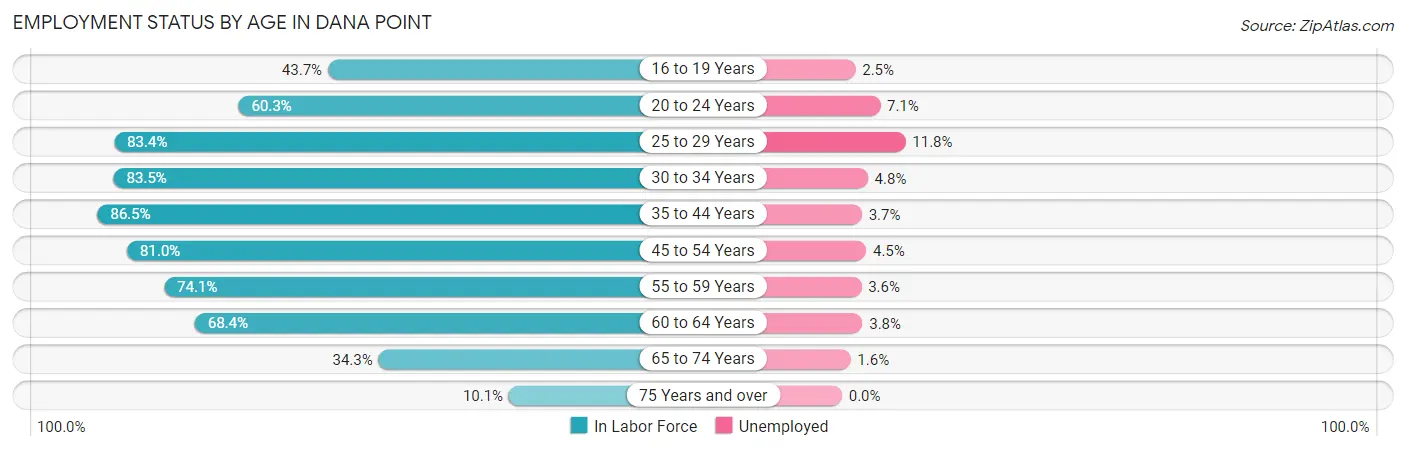
| Age Bracket | In Labor Force | Unemployed |
| 16 to 19 Years | 837 (43.7%) | 21 (2.5%) |
| 20 to 24 Years | 690 (60.3%) | 49 (7.1%) |
| 25 to 29 Years | 1,593 (83.4%) | 188 (11.8%) |
| 30 to 34 Years | 1,240 (83.5%) | 60 (4.8%) |
| 35 to 44 Years | 2,800 (86.5%) | 104 (3.7%) |
| 45 to 54 Years | 4,224 (81.0%) | 190 (4.5%) |
| 55 to 59 Years | 2,152 (74.1%) | 77 (3.6%) |
| 60 to 64 Years | 1,991 (68.4%) | 76 (3.8%) |
| 65 to 74 Years | 1,641 (34.3%) | 26 (1.6%) |
| 75 Years and over | 285 (10.1%) | 0 (0.0%) |
| Total | 17,448 (61.6%) | 785 (4.5%) |
Employment Status by Educational Attainment in Dana Point
According to labor force statistics for Dana Point, 79.2% of individuals (13,988) out of the total population between 25 and 64 years of age (17,662) are in the labor force, with 4.9% or 685 of them being unemployed. The group with the highest labor force participation rate are those with the educational attainment of bachelor's degree or higher, with 82.1% or 8,387 individuals in the labor force. Within the labor force, individuals with high school diploma education have the highest percentage of unemployment, with 10.5% or 197 of them being unemployed.
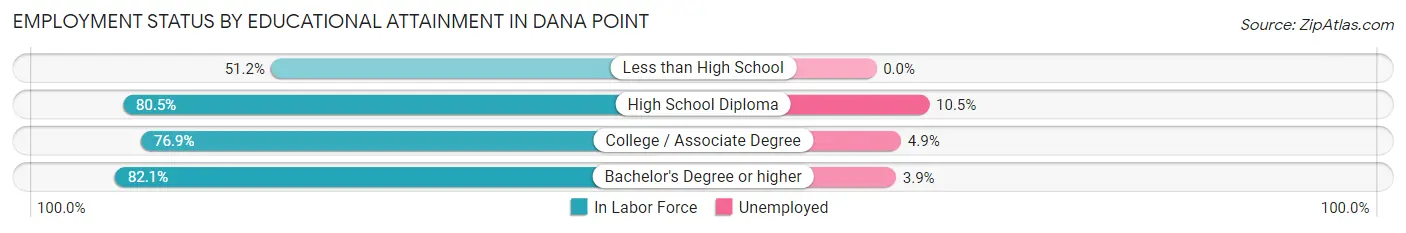
| Educational Attainment | In Labor Force | Unemployed |
| Less than High School | 411 (51.2%) | 0 (0.0%) |
| High School Diploma | 1,875 (80.5%) | 245 (10.5%) |
| College / Associate Degree | 3,318 (76.9%) | 211 (4.9%) |
| Bachelor's Degree or higher | 8,387 (82.1%) | 398 (3.9%) |
| Total | 13,988 (79.2%) | 865 (4.9%) |
Employment Occupations by Sex in Dana Point
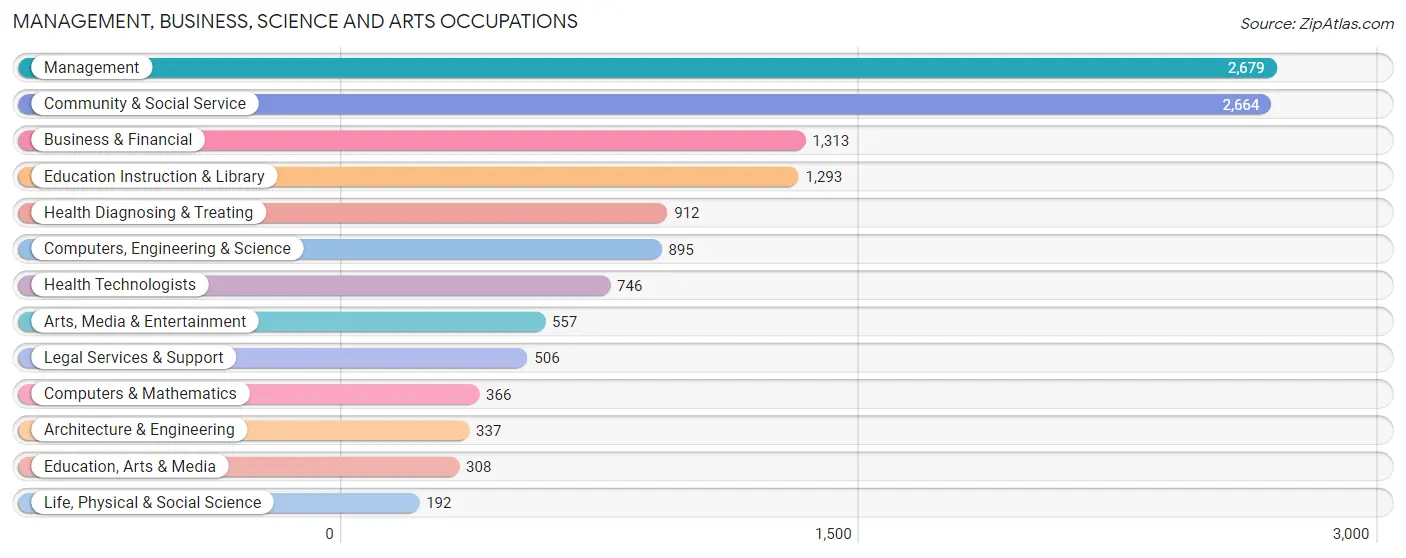
Management, Business, Science and Arts Occupations
The most common Management, Business, Science and Arts occupations in Dana Point are Management (2,679 | 16.2%), Community & Social Service (2,664 | 16.1%), Business & Financial (1,313 | 7.9%), Education Instruction & Library (1,293 | 7.8%), and Health Diagnosing & Treating (912 | 5.5%).
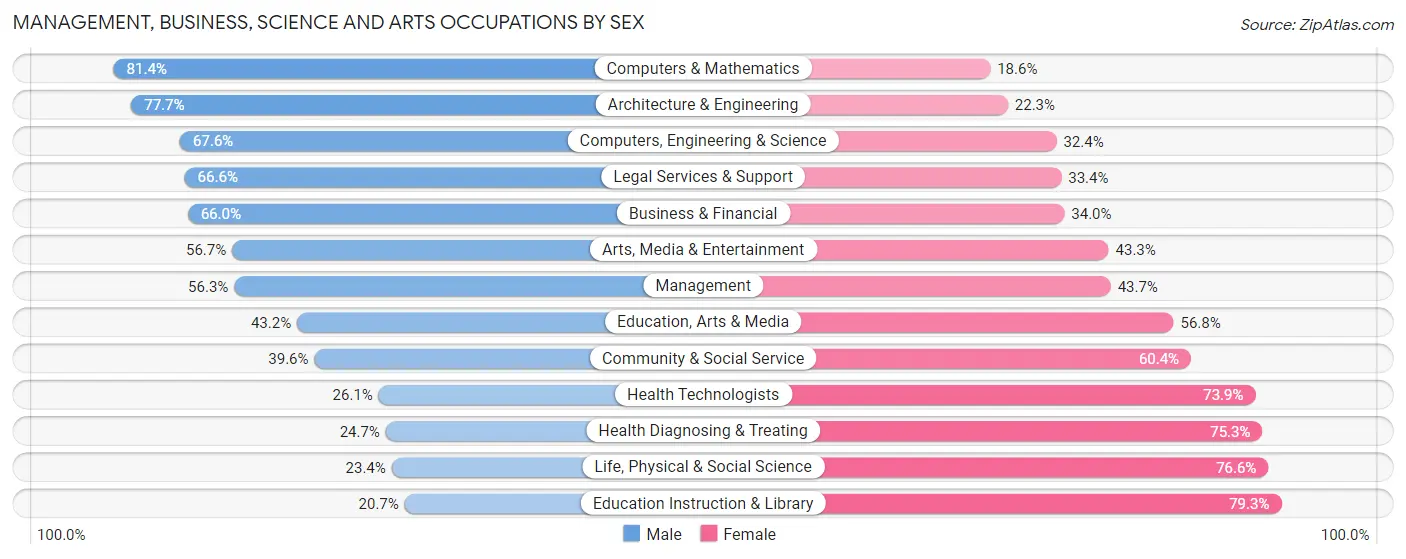
Management, Business, Science and Arts Occupations by Sex
Within the Management, Business, Science and Arts occupations in Dana Point, the most male-oriented occupations are Computers & Mathematics (81.4%), Architecture & Engineering (77.7%), and Computers, Engineering & Science (67.6%), while the most female-oriented occupations are Education Instruction & Library (79.3%), Life, Physical & Social Science (76.6%), and Health Diagnosing & Treating (75.3%).
| Occupation | Male | Female |
| Management | 1,508 (56.3%) | 1,171 (43.7%) |
| Business & Financial | 866 (66.0%) | 447 (34.0%) |
| Computers, Engineering & Science | 605 (67.6%) | 290 (32.4%) |
| Computers & Mathematics | 298 (81.4%) | 68 (18.6%) |
| Architecture & Engineering | 262 (77.7%) | 75 (22.3%) |
| Life, Physical & Social Science | 45 (23.4%) | 147 (76.6%) |
| Community & Social Service | 1,054 (39.6%) | 1,610 (60.4%) |
| Education, Arts & Media | 133 (43.2%) | 175 (56.8%) |
| Legal Services & Support | 337 (66.6%) | 169 (33.4%) |
| Education Instruction & Library | 268 (20.7%) | 1,025 (79.3%) |
| Arts, Media & Entertainment | 316 (56.7%) | 241 (43.3%) |
| Health Diagnosing & Treating | 225 (24.7%) | 687 (75.3%) |
| Health Technologists | 195 (26.1%) | 551 (73.9%) |
| Total (Category) | 4,258 (50.3%) | 4,205 (49.7%) |
| Total (Overall) | 8,668 (52.4%) | 7,878 (47.6%) |
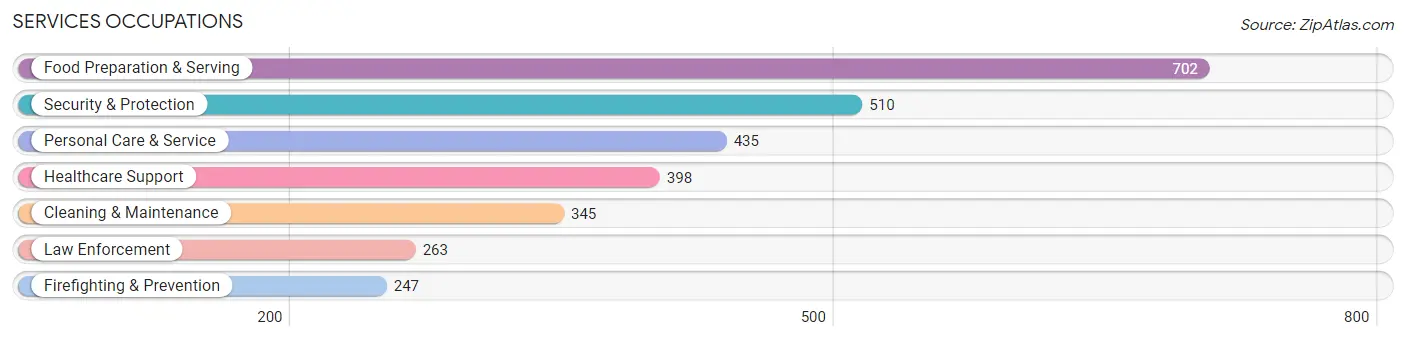
Services Occupations
The most common Services occupations in Dana Point are Food Preparation & Serving (702 | 4.2%), Security & Protection (510 | 3.1%), Personal Care & Service (435 | 2.6%), Healthcare Support (398 | 2.4%), and Cleaning & Maintenance (345 | 2.1%).
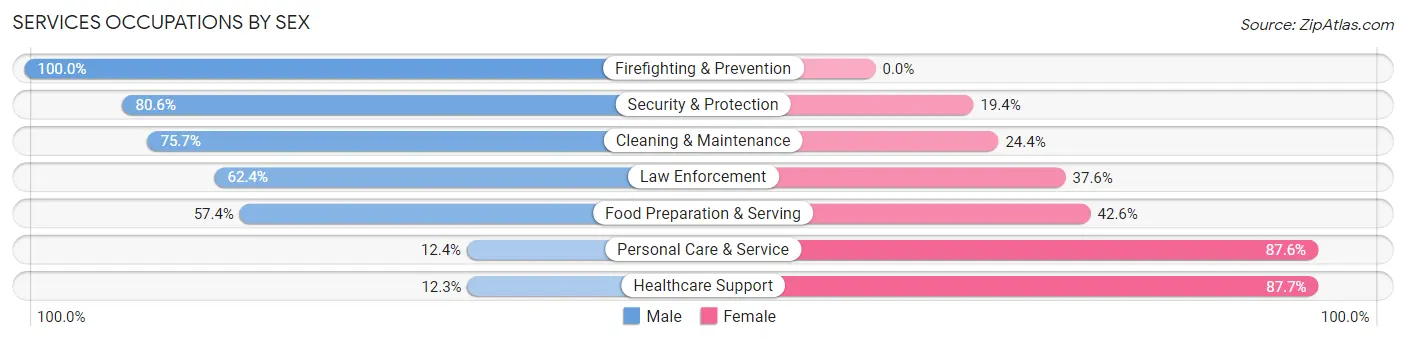
Services Occupations by Sex
Within the Services occupations in Dana Point, the most male-oriented occupations are Firefighting & Prevention (100.0%), Security & Protection (80.6%), and Cleaning & Maintenance (75.6%), while the most female-oriented occupations are Healthcare Support (87.7%), Personal Care & Service (87.6%), and Food Preparation & Serving (42.6%).
| Occupation | Male | Female |
| Healthcare Support | 49 (12.3%) | 349 (87.7%) |
| Security & Protection | 411 (80.6%) | 99 (19.4%) |
| Firefighting & Prevention | 247 (100.0%) | 0 (0.0%) |
| Law Enforcement | 164 (62.4%) | 99 (37.6%) |
| Food Preparation & Serving | 403 (57.4%) | 299 (42.6%) |
| Cleaning & Maintenance | 261 (75.6%) | 84 (24.3%) |
| Personal Care & Service | 54 (12.4%) | 381 (87.6%) |
| Total (Category) | 1,178 (49.3%) | 1,212 (50.7%) |
| Total (Overall) | 8,668 (52.4%) | 7,878 (47.6%) |
Sales and Office Occupations
The most common Sales and Office occupations in Dana Point are Sales & Related (2,534 | 15.3%), and Office & Administration (1,419 | 8.6%).

Sales and Office Occupations by Sex
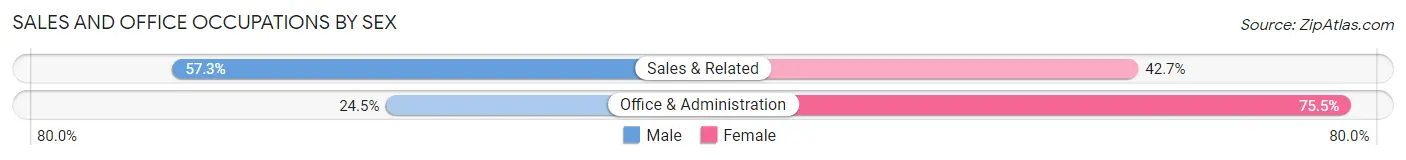
| Occupation | Male | Female |
| Sales & Related | 1,451 (57.3%) | 1,083 (42.7%) |
| Office & Administration | 348 (24.5%) | 1,071 (75.5%) |
| Total (Category) | 1,799 (45.5%) | 2,154 (54.5%) |
| Total (Overall) | 8,668 (52.4%) | 7,878 (47.6%) |
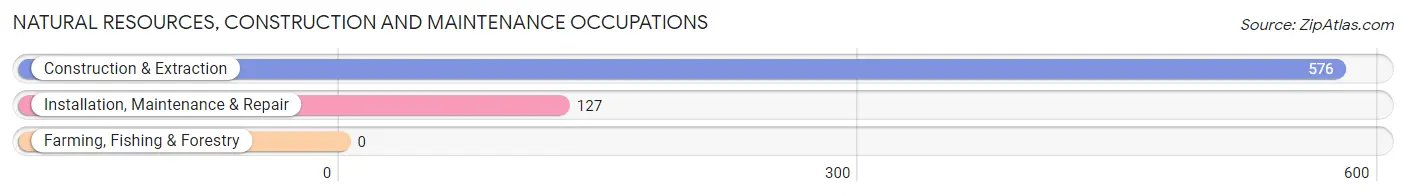
Natural Resources, Construction and Maintenance Occupations
The most common Natural Resources, Construction and Maintenance occupations in Dana Point are Construction & Extraction (576 | 3.5%), and Installation, Maintenance & Repair (127 | 0.8%).
Natural Resources, Construction and Maintenance Occupations by Sex
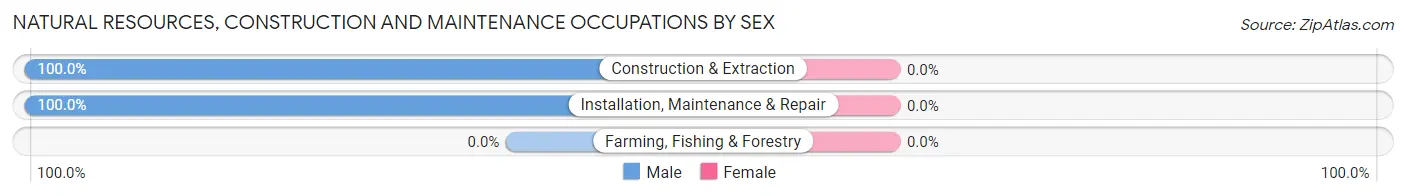
| Occupation | Male | Female |
| Farming, Fishing & Forestry | 0 (0.0%) | 0 (0.0%) |
| Construction & Extraction | 576 (100.0%) | 0 (0.0%) |
| Installation, Maintenance & Repair | 127 (100.0%) | 0 (0.0%) |
| Total (Category) | 703 (100.0%) | 0 (0.0%) |
| Total (Overall) | 8,668 (52.4%) | 7,878 (47.6%) |
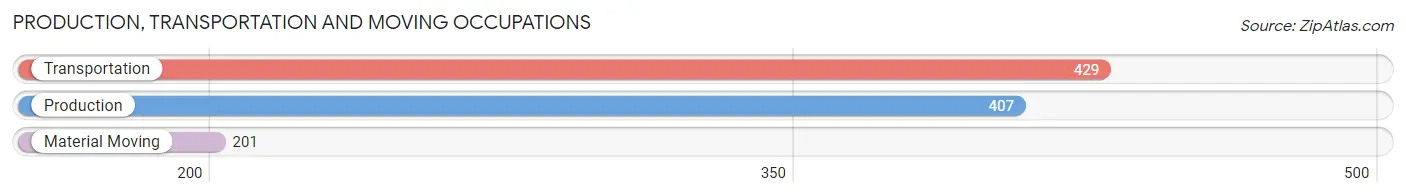
Production, Transportation and Moving Occupations
The most common Production, Transportation and Moving occupations in Dana Point are Transportation (429 | 2.6%), Production (407 | 2.5%), and Material Moving (201 | 1.2%).
Production, Transportation and Moving Occupations by Sex
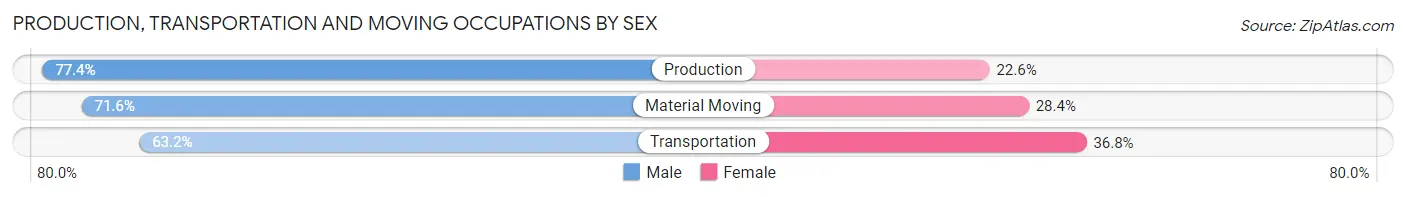
| Occupation | Male | Female |
| Production | 315 (77.4%) | 92 (22.6%) |
| Transportation | 271 (63.2%) | 158 (36.8%) |
| Material Moving | 144 (71.6%) | 57 (28.4%) |
| Total (Category) | 730 (70.4%) | 307 (29.6%) |
| Total (Overall) | 8,668 (52.4%) | 7,878 (47.6%) |
Employment Industries by Sex in Dana Point
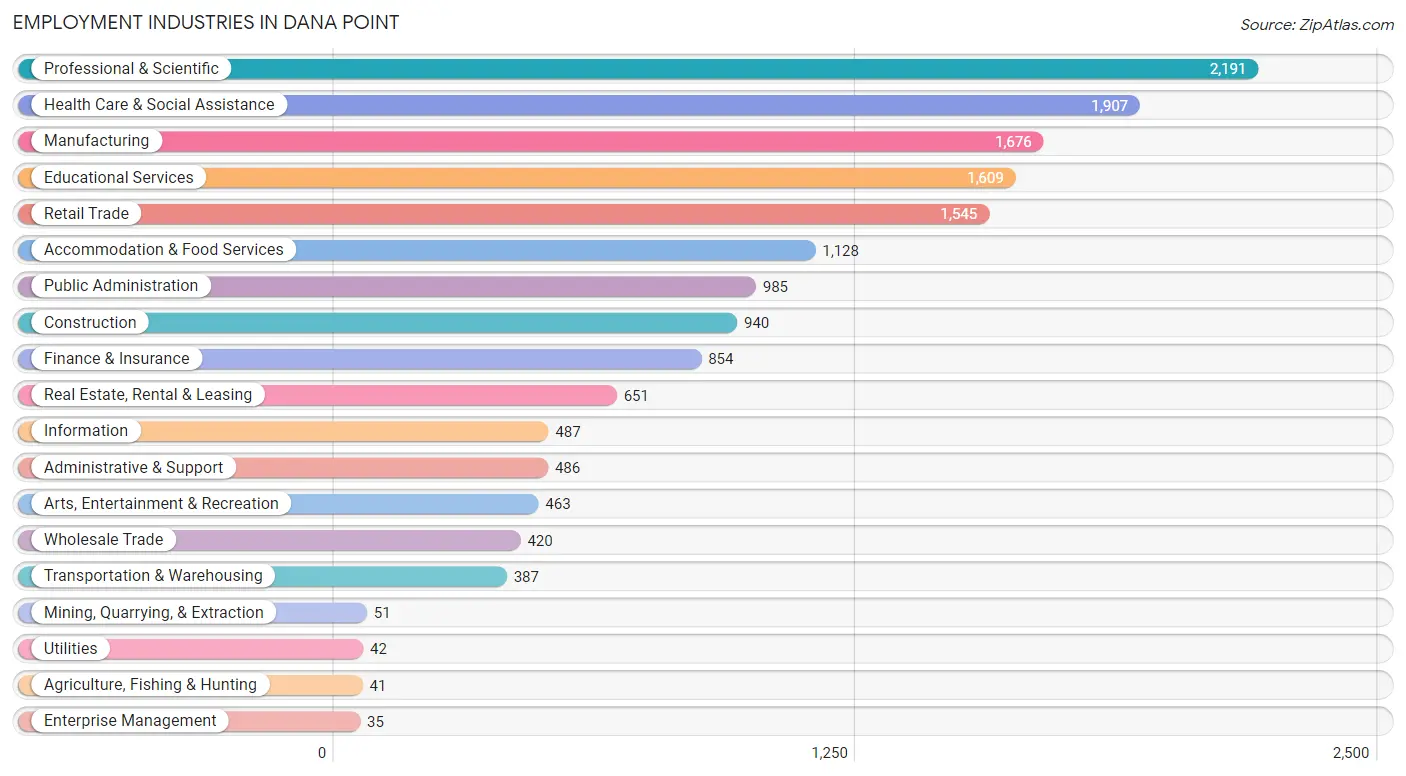
Employment Industries in Dana Point
The major employment industries in Dana Point include Professional & Scientific (2,191 | 13.2%), Health Care & Social Assistance (1,907 | 11.5%), Manufacturing (1,676 | 10.1%), Educational Services (1,609 | 9.7%), and Retail Trade (1,545 | 9.3%).
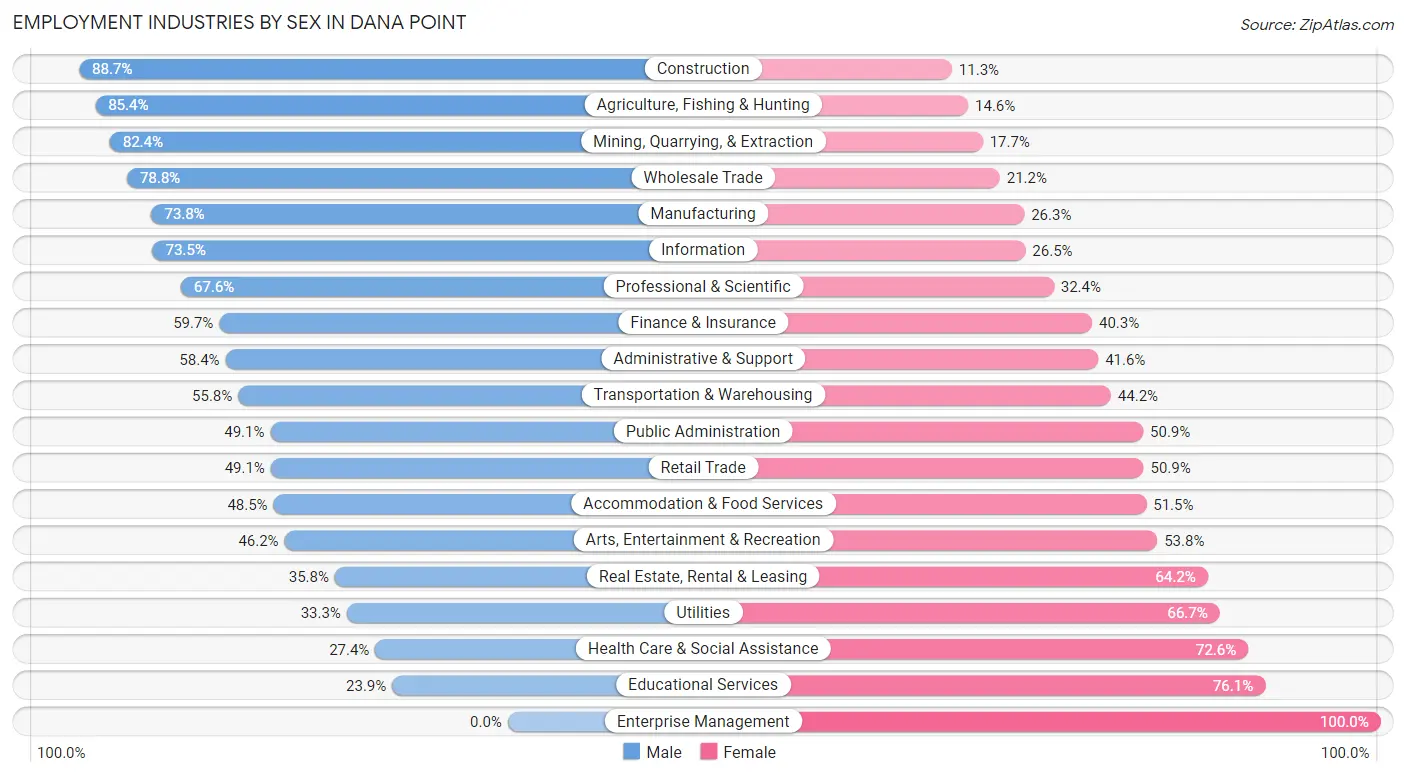
Employment Industries by Sex in Dana Point
The Dana Point industries that see more men than women are Construction (88.7%), Agriculture, Fishing & Hunting (85.4%), and Mining, Quarrying, & Extraction (82.4%), whereas the industries that tend to have a higher number of women are Enterprise Management (100.0%), Educational Services (76.1%), and Health Care & Social Assistance (72.6%).
| Industry | Male | Female |
| Agriculture, Fishing & Hunting | 35 (85.4%) | 6 (14.6%) |
| Mining, Quarrying, & Extraction | 42 (82.4%) | 9 (17.6%) |
| Construction | 834 (88.7%) | 106 (11.3%) |
| Manufacturing | 1,236 (73.8%) | 440 (26.3%) |
| Wholesale Trade | 331 (78.8%) | 89 (21.2%) |
| Retail Trade | 758 (49.1%) | 787 (50.9%) |
| Transportation & Warehousing | 216 (55.8%) | 171 (44.2%) |
| Utilities | 14 (33.3%) | 28 (66.7%) |
| Information | 358 (73.5%) | 129 (26.5%) |
| Finance & Insurance | 510 (59.7%) | 344 (40.3%) |
| Real Estate, Rental & Leasing | 233 (35.8%) | 418 (64.2%) |
| Professional & Scientific | 1,482 (67.6%) | 709 (32.4%) |
| Enterprise Management | 0 (0.0%) | 35 (100.0%) |
| Administrative & Support | 284 (58.4%) | 202 (41.6%) |
| Educational Services | 385 (23.9%) | 1,224 (76.1%) |
| Health Care & Social Assistance | 523 (27.4%) | 1,384 (72.6%) |
| Arts, Entertainment & Recreation | 214 (46.2%) | 249 (53.8%) |
| Accommodation & Food Services | 547 (48.5%) | 581 (51.5%) |
| Public Administration | 484 (49.1%) | 501 (50.9%) |
| Total | 8,668 (52.4%) | 7,878 (47.6%) |
Education in Dana Point
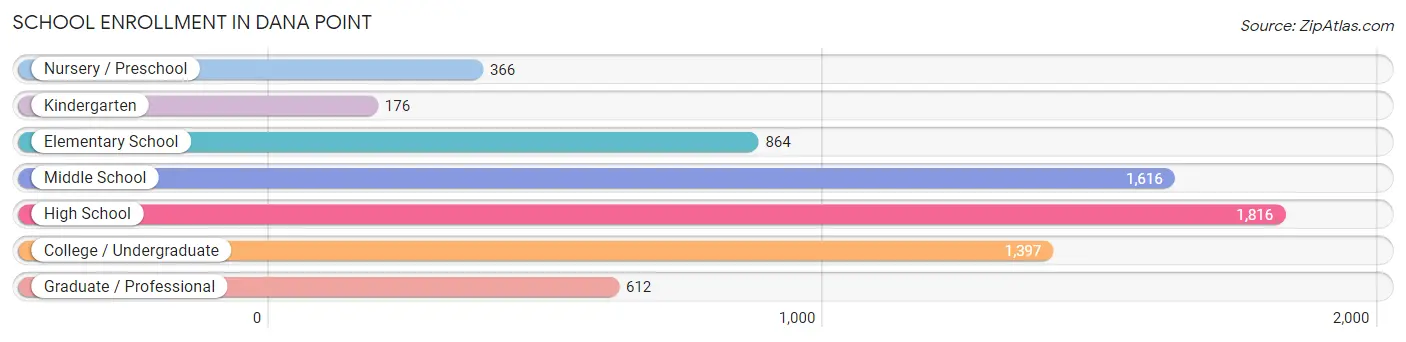
School Enrollment in Dana Point
The most common levels of schooling among the 6,847 students in Dana Point are high school (1,816 | 26.5%), middle school (1,616 | 23.6%), and college / undergraduate (1,397 | 20.4%).
| School Level | # Students | % Students |
| Nursery / Preschool | 366 | 5.3% |
| Kindergarten | 176 | 2.6% |
| Elementary School | 864 | 12.6% |
| Middle School | 1,616 | 23.6% |
| High School | 1,816 | 26.5% |
| College / Undergraduate | 1,397 | 20.4% |
| Graduate / Professional | 612 | 8.9% |
| Total | 6,847 | 100.0% |
School Enrollment by Age by Funding Source in Dana Point
Out of a total of 6,847 students who are enrolled in schools in Dana Point, 1,589 (23.2%) attend a private institution, while the remaining 5,258 (76.8%) are enrolled in public schools. The age group of 3 to 4 year olds has the highest likelihood of being enrolled in private schools, with 219 (73.0% in the age bracket) enrolled. Conversely, the age group of 18 to 19 year olds has the lowest likelihood of being enrolled in a private school, with 607 (91.7% in the age bracket) attending a public institution.
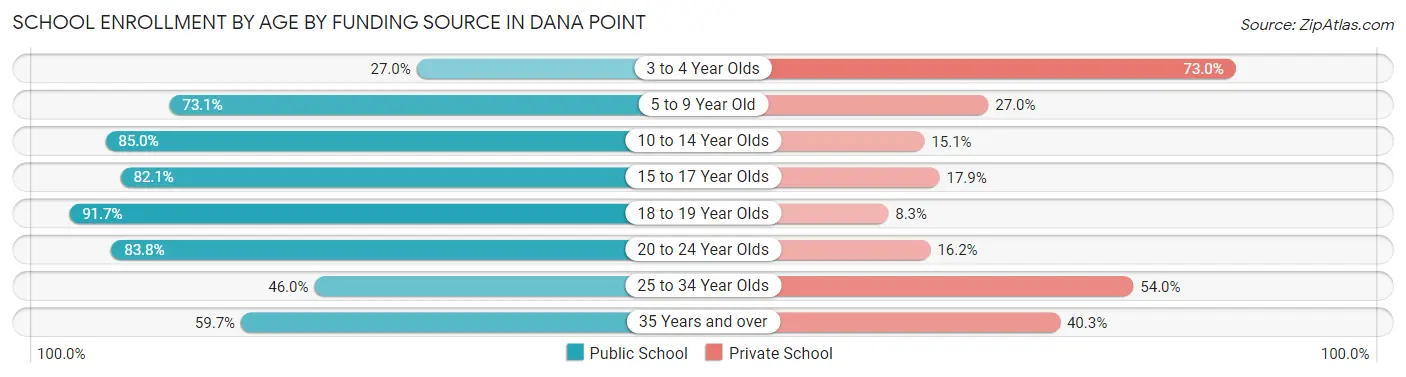
| Age Bracket | Public School | Private School |
| 3 to 4 Year Olds | 81 (27.0%) | 219 (73.0%) |
| 5 to 9 Year Old | 702 (73.1%) | 259 (27.0%) |
| 10 to 14 Year Olds | 1,806 (85.0%) | 320 (15.0%) |
| 15 to 17 Year Olds | 1,058 (82.1%) | 230 (17.9%) |
| 18 to 19 Year Olds | 607 (91.7%) | 55 (8.3%) |
| 20 to 24 Year Olds | 581 (83.8%) | 112 (16.2%) |
| 25 to 34 Year Olds | 215 (46.0%) | 252 (54.0%) |
| 35 Years and over | 209 (59.7%) | 141 (40.3%) |
| Total | 5,258 (76.8%) | 1,589 (23.2%) |
Educational Attainment by Field of Study in Dana Point
Business (3,103 | 20.6%), social sciences (1,858 | 12.4%), education (1,279 | 8.5%), communications (1,114 | 7.4%), and liberal arts & history (923 | 6.1%) are the most common fields of study among 15,028 individuals in Dana Point who have obtained a bachelor's degree or higher.
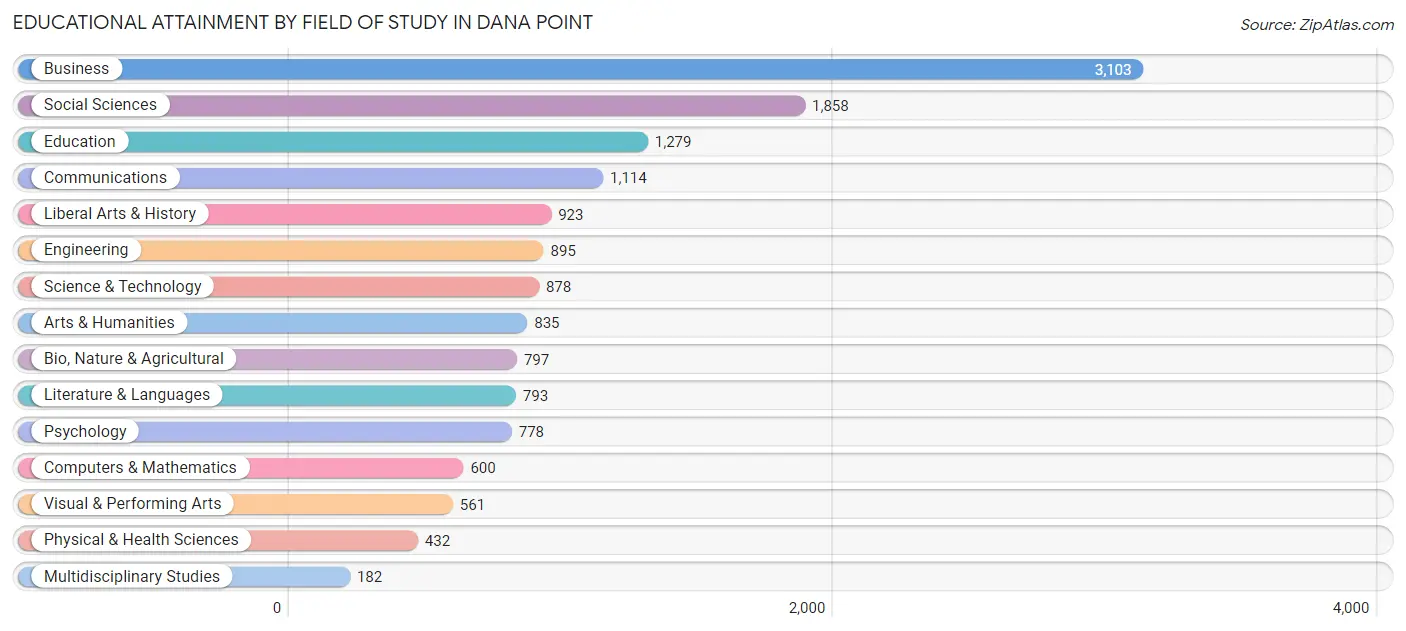
| Field of Study | # Graduates | % Graduates |
| Computers & Mathematics | 600 | 4.0% |
| Bio, Nature & Agricultural | 797 | 5.3% |
| Physical & Health Sciences | 432 | 2.9% |
| Psychology | 778 | 5.2% |
| Social Sciences | 1,858 | 12.4% |
| Engineering | 895 | 6.0% |
| Multidisciplinary Studies | 182 | 1.2% |
| Science & Technology | 878 | 5.8% |
| Business | 3,103 | 20.6% |
| Education | 1,279 | 8.5% |
| Literature & Languages | 793 | 5.3% |
| Liberal Arts & History | 923 | 6.1% |
| Visual & Performing Arts | 561 | 3.7% |
| Communications | 1,114 | 7.4% |
| Arts & Humanities | 835 | 5.6% |
| Total | 15,028 | 100.0% |
Transportation & Commute in Dana Point
Vehicle Availability by Sex in Dana Point
The most prevalent vehicle ownership categories in Dana Point are males with 2 vehicles (4,302, accounting for 49.3%) and females with 2 vehicles (3,045, making up 55.6%).
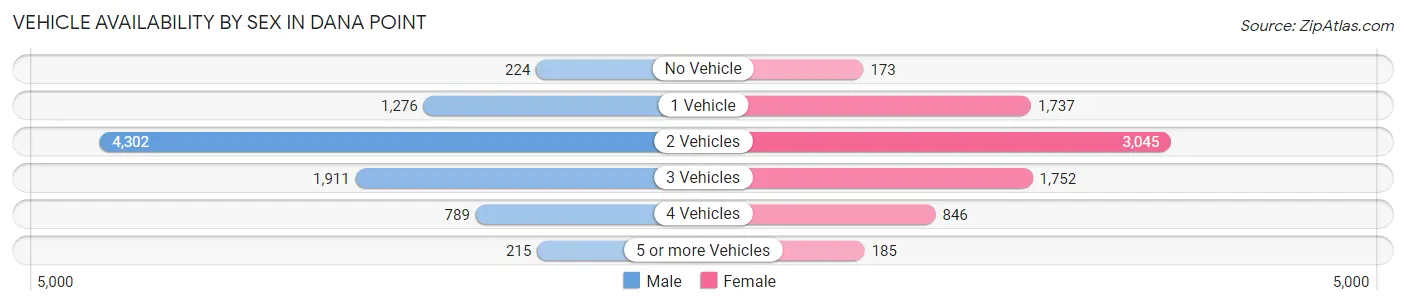
| Vehicles Available | Male | Female |
| No Vehicle | 224 (2.6%) | 173 (2.2%) |
| 1 Vehicle | 1,276 (14.6%) | 1,737 (22.5%) |
| 2 Vehicles | 4,302 (49.3%) | 3,045 (39.4%) |
| 3 Vehicles | 1,911 (21.9%) | 1,752 (22.6%) |
| 4 Vehicles | 789 (9.0%) | 846 (10.9%) |
| 5 or more Vehicles | 215 (2.5%) | 185 (2.4%) |
| Total | 8,717 (100.0%) | 7,738 (100.0%) |
Commute Time in Dana Point
The most frequently occuring commute durations in Dana Point are 15 to 19 minutes (1,884 commuters, 15.4%), 30 to 34 minutes (1,455 commuters, 11.9%), and 10 to 14 minutes (1,454 commuters, 11.9%).
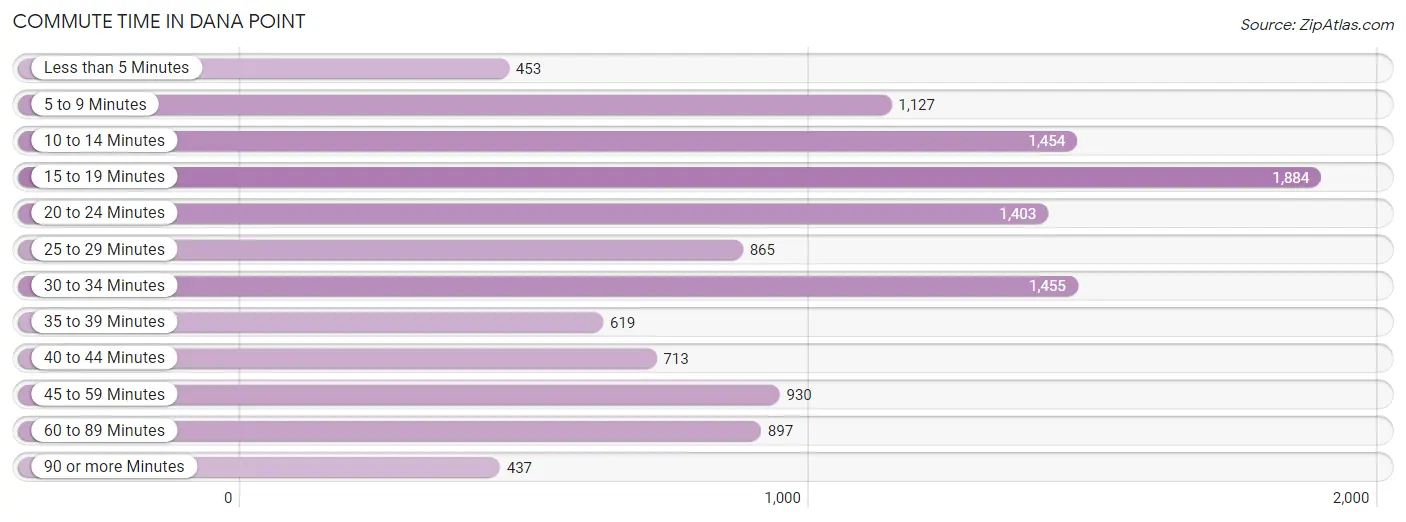
| Commute Time | # Commuters | % Commuters |
| Less than 5 Minutes | 453 | 3.7% |
| 5 to 9 Minutes | 1,127 | 9.2% |
| 10 to 14 Minutes | 1,454 | 11.9% |
| 15 to 19 Minutes | 1,884 | 15.4% |
| 20 to 24 Minutes | 1,403 | 11.5% |
| 25 to 29 Minutes | 865 | 7.1% |
| 30 to 34 Minutes | 1,455 | 11.9% |
| 35 to 39 Minutes | 619 | 5.1% |
| 40 to 44 Minutes | 713 | 5.8% |
| 45 to 59 Minutes | 930 | 7.6% |
| 60 to 89 Minutes | 897 | 7.3% |
| 90 or more Minutes | 437 | 3.6% |
Commute Time by Sex in Dana Point
The most common commute times in Dana Point are 15 to 19 minutes (1,133 commuters, 17.3%) for males and 10 to 14 minutes (927 commuters, 16.3%) for females.
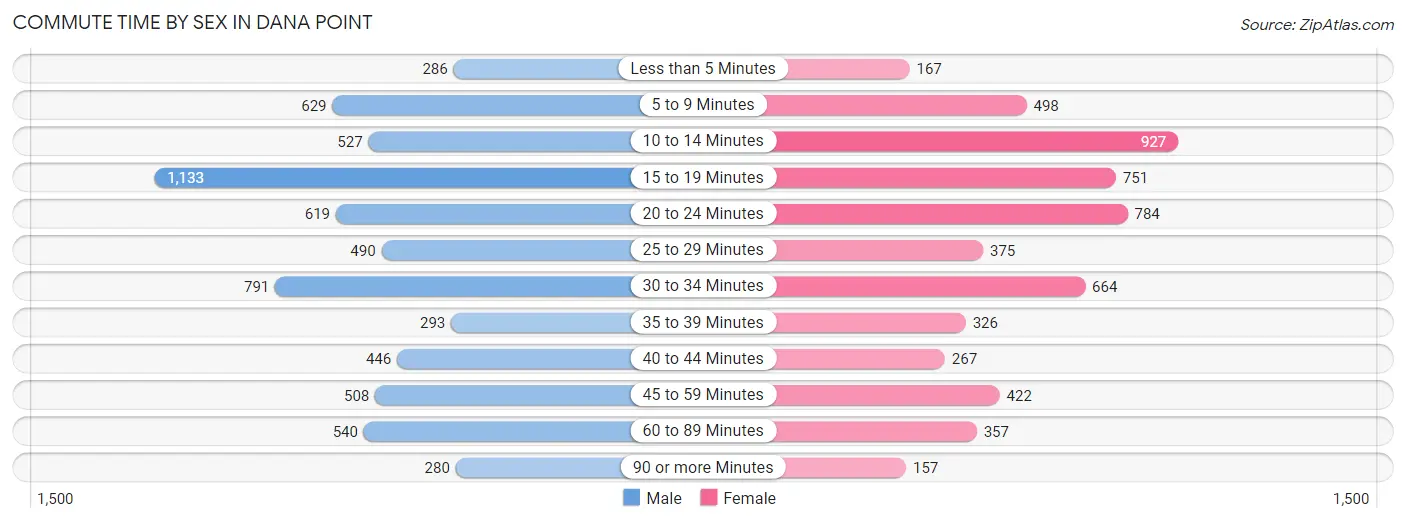
| Commute Time | Male | Female |
| Less than 5 Minutes | 286 (4.4%) | 167 (2.9%) |
| 5 to 9 Minutes | 629 (9.6%) | 498 (8.7%) |
| 10 to 14 Minutes | 527 (8.1%) | 927 (16.3%) |
| 15 to 19 Minutes | 1,133 (17.3%) | 751 (13.2%) |
| 20 to 24 Minutes | 619 (9.5%) | 784 (13.8%) |
| 25 to 29 Minutes | 490 (7.5%) | 375 (6.6%) |
| 30 to 34 Minutes | 791 (12.1%) | 664 (11.7%) |
| 35 to 39 Minutes | 293 (4.5%) | 326 (5.7%) |
| 40 to 44 Minutes | 446 (6.8%) | 267 (4.7%) |
| 45 to 59 Minutes | 508 (7.8%) | 422 (7.4%) |
| 60 to 89 Minutes | 540 (8.3%) | 357 (6.3%) |
| 90 or more Minutes | 280 (4.3%) | 157 (2.8%) |
Time of Departure to Work by Sex in Dana Point
The most frequent times of departure to work in Dana Point are 7:00 AM to 7:29 AM (1,078, 16.5%) for males and 7:30 AM to 7:59 AM (1,211, 21.3%) for females.
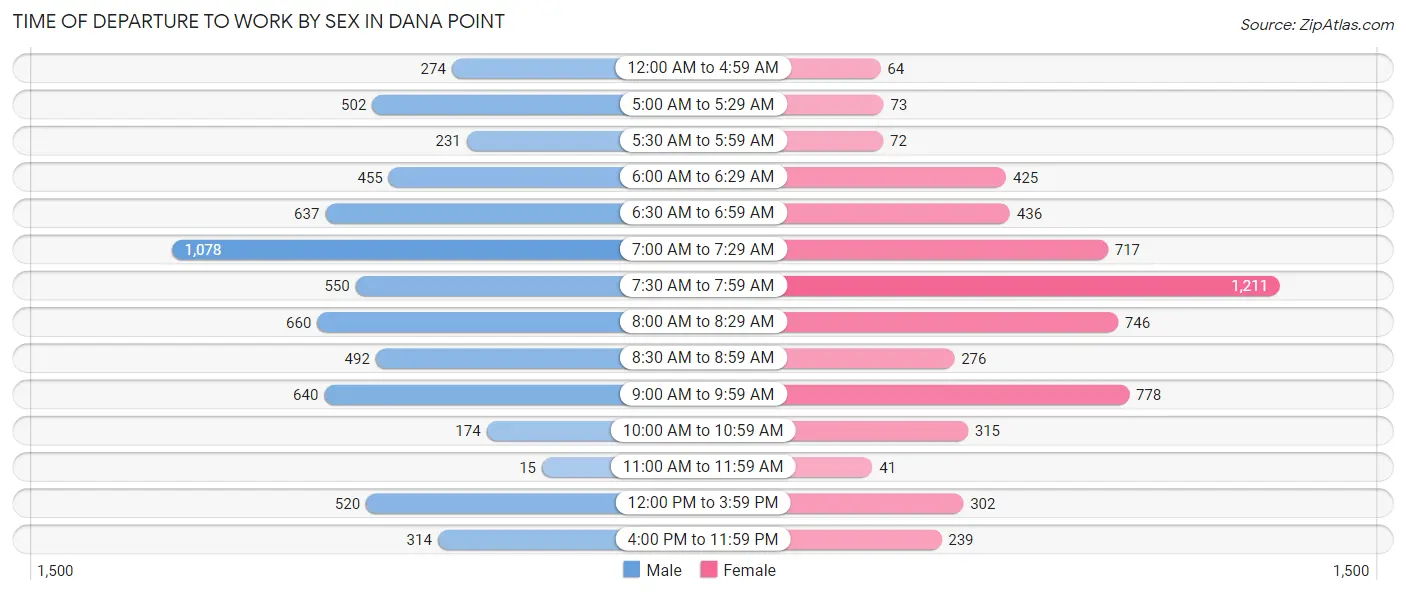
| Time of Departure | Male | Female |
| 12:00 AM to 4:59 AM | 274 (4.2%) | 64 (1.1%) |
| 5:00 AM to 5:29 AM | 502 (7.7%) | 73 (1.3%) |
| 5:30 AM to 5:59 AM | 231 (3.5%) | 72 (1.3%) |
| 6:00 AM to 6:29 AM | 455 (7.0%) | 425 (7.5%) |
| 6:30 AM to 6:59 AM | 637 (9.7%) | 436 (7.7%) |
| 7:00 AM to 7:29 AM | 1,078 (16.5%) | 717 (12.6%) |
| 7:30 AM to 7:59 AM | 550 (8.4%) | 1,211 (21.3%) |
| 8:00 AM to 8:29 AM | 660 (10.1%) | 746 (13.1%) |
| 8:30 AM to 8:59 AM | 492 (7.5%) | 276 (4.9%) |
| 9:00 AM to 9:59 AM | 640 (9.8%) | 778 (13.7%) |
| 10:00 AM to 10:59 AM | 174 (2.7%) | 315 (5.5%) |
| 11:00 AM to 11:59 AM | 15 (0.2%) | 41 (0.7%) |
| 12:00 PM to 3:59 PM | 520 (8.0%) | 302 (5.3%) |
| 4:00 PM to 11:59 PM | 314 (4.8%) | 239 (4.2%) |
| Total | 6,542 (100.0%) | 5,695 (100.0%) |
Housing Occupancy in Dana Point
Occupancy by Ownership in Dana Point
Of the total 14,177 dwellings in Dana Point, owner-occupied units account for 8,925 (62.9%), while renter-occupied units make up 5,252 (37.0%).
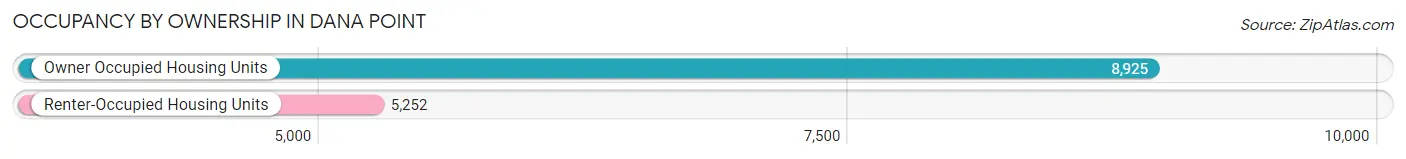
| Occupancy | # Housing Units | % Housing Units |
| Owner Occupied Housing Units | 8,925 | 62.9% |
| Renter-Occupied Housing Units | 5,252 | 37.0% |
| Total Occupied Housing Units | 14,177 | 100.0% |
Occupancy by Household Size in Dana Point
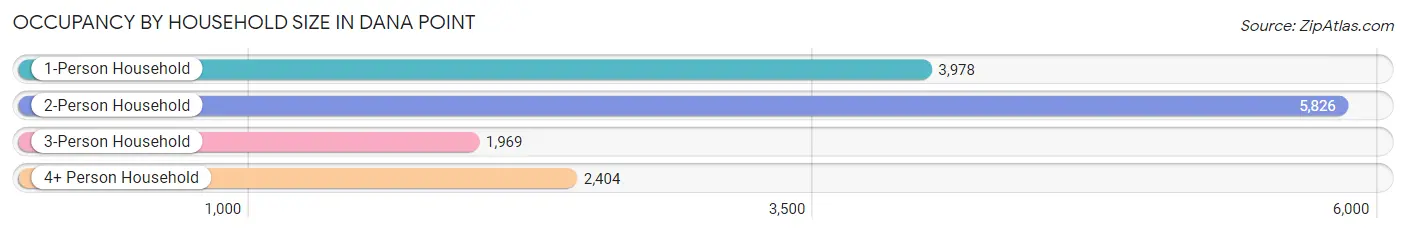
| Household Size | # Housing Units | % Housing Units |
| 1-Person Household | 3,978 | 28.1% |
| 2-Person Household | 5,826 | 41.1% |
| 3-Person Household | 1,969 | 13.9% |
| 4+ Person Household | 2,404 | 17.0% |
| Total Housing Units | 14,177 | 100.0% |
Occupancy by Ownership by Household Size in Dana Point
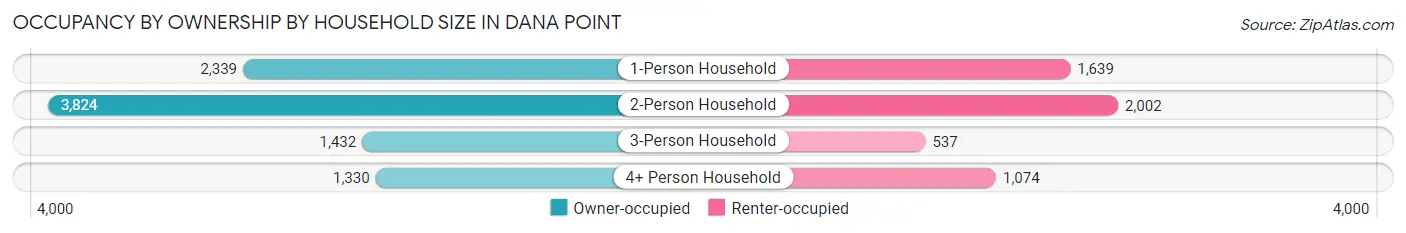
| Household Size | Owner-occupied | Renter-occupied |
| 1-Person Household | 2,339 (58.8%) | 1,639 (41.2%) |
| 2-Person Household | 3,824 (65.6%) | 2,002 (34.4%) |
| 3-Person Household | 1,432 (72.7%) | 537 (27.3%) |
| 4+ Person Household | 1,330 (55.3%) | 1,074 (44.7%) |
| Total Housing Units | 8,925 (62.9%) | 5,252 (37.0%) |
Occupancy by Educational Attainment in Dana Point
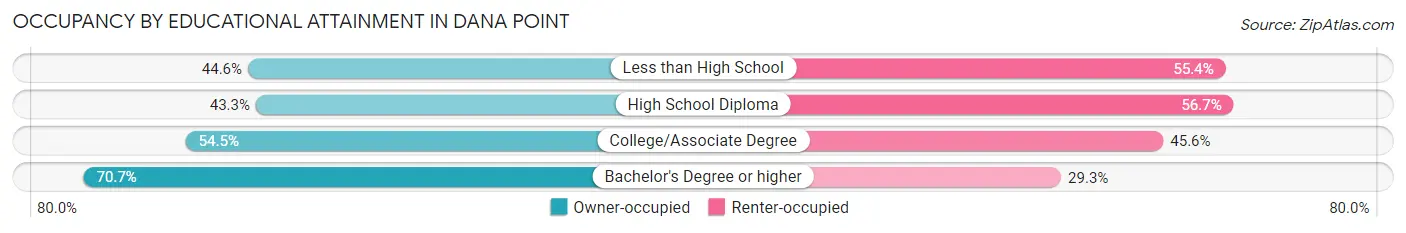
| Household Size | Owner-occupied | Renter-occupied |
| Less than High School | 235 (44.6%) | 292 (55.4%) |
| High School Diploma | 539 (43.3%) | 705 (56.7%) |
| College/Associate Degree | 2,066 (54.4%) | 1,728 (45.6%) |
| Bachelor's Degree or higher | 6,085 (70.7%) | 2,527 (29.3%) |
Occupancy by Age of Householder in Dana Point
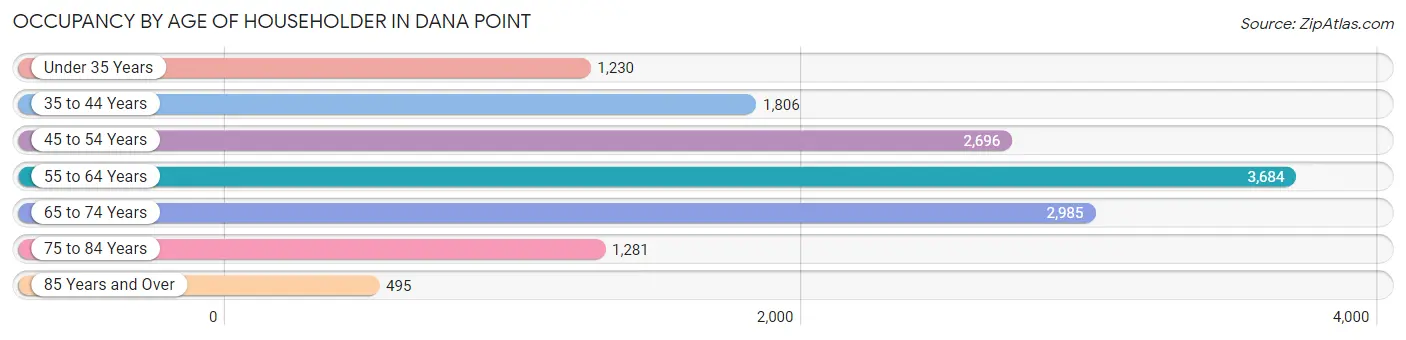
| Age Bracket | # Households | % Households |
| Under 35 Years | 1,230 | 8.7% |
| 35 to 44 Years | 1,806 | 12.7% |
| 45 to 54 Years | 2,696 | 19.0% |
| 55 to 64 Years | 3,684 | 26.0% |
| 65 to 74 Years | 2,985 | 21.1% |
| 75 to 84 Years | 1,281 | 9.0% |
| 85 Years and Over | 495 | 3.5% |
| Total | 14,177 | 100.0% |
Housing Finances in Dana Point
Median Income by Occupancy in Dana Point
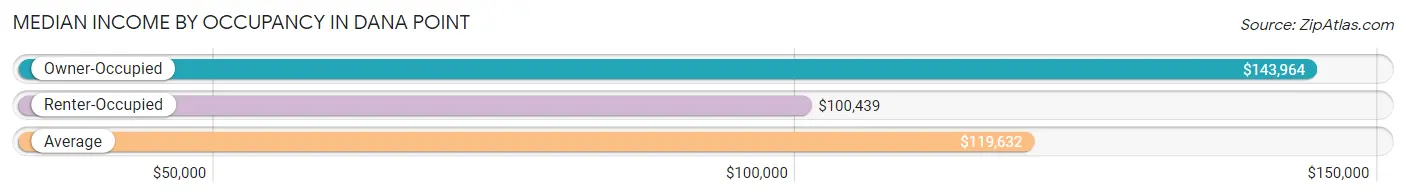
| Occupancy Type | # Households | Median Income |
| Owner-Occupied | 8,925 (62.9%) | $143,964 |
| Renter-Occupied | 5,252 (37.0%) | $100,439 |
| Average | 14,177 (100.0%) | $119,632 |
Occupancy by Householder Income Bracket in Dana Point
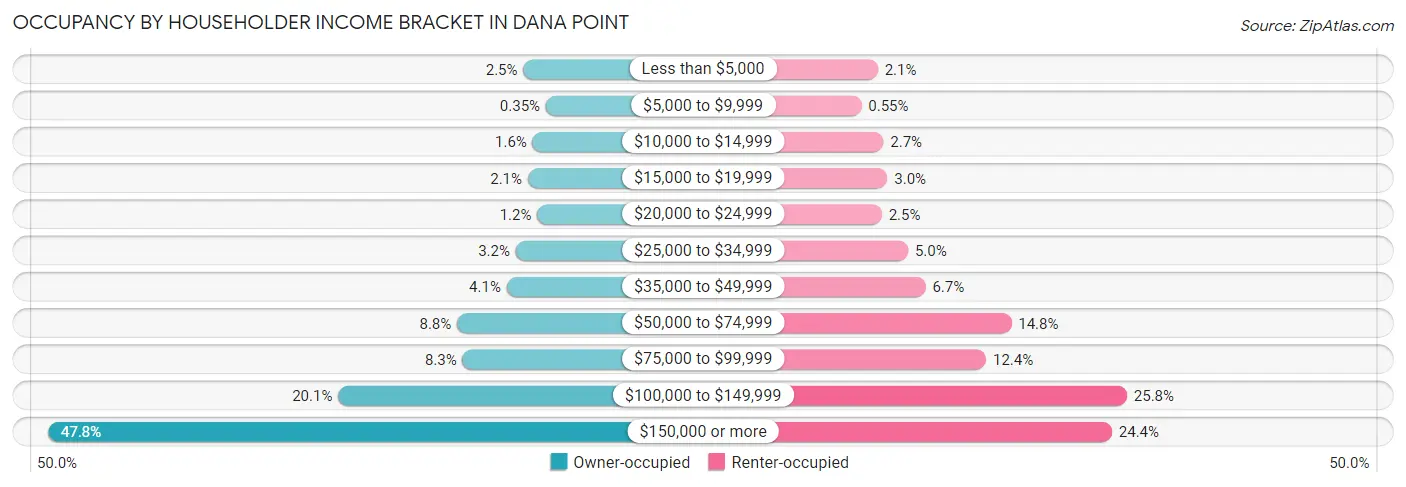
| Income Bracket | Owner-occupied | Renter-occupied |
| Less than $5,000 | 223 (2.5%) | 111 (2.1%) |
| $5,000 to $9,999 | 31 (0.4%) | 29 (0.5%) |
| $10,000 to $14,999 | 144 (1.6%) | 139 (2.6%) |
| $15,000 to $19,999 | 185 (2.1%) | 159 (3.0%) |
| $20,000 to $24,999 | 104 (1.2%) | 131 (2.5%) |
| $25,000 to $34,999 | 287 (3.2%) | 262 (5.0%) |
| $35,000 to $49,999 | 364 (4.1%) | 350 (6.7%) |
| $50,000 to $74,999 | 786 (8.8%) | 779 (14.8%) |
| $75,000 to $99,999 | 740 (8.3%) | 653 (12.4%) |
| $100,000 to $149,999 | 1,797 (20.1%) | 1,357 (25.8%) |
| $150,000 or more | 4,264 (47.8%) | 1,282 (24.4%) |
| Total | 8,925 (100.0%) | 5,252 (100.0%) |
Monthly Housing Cost Tiers in Dana Point
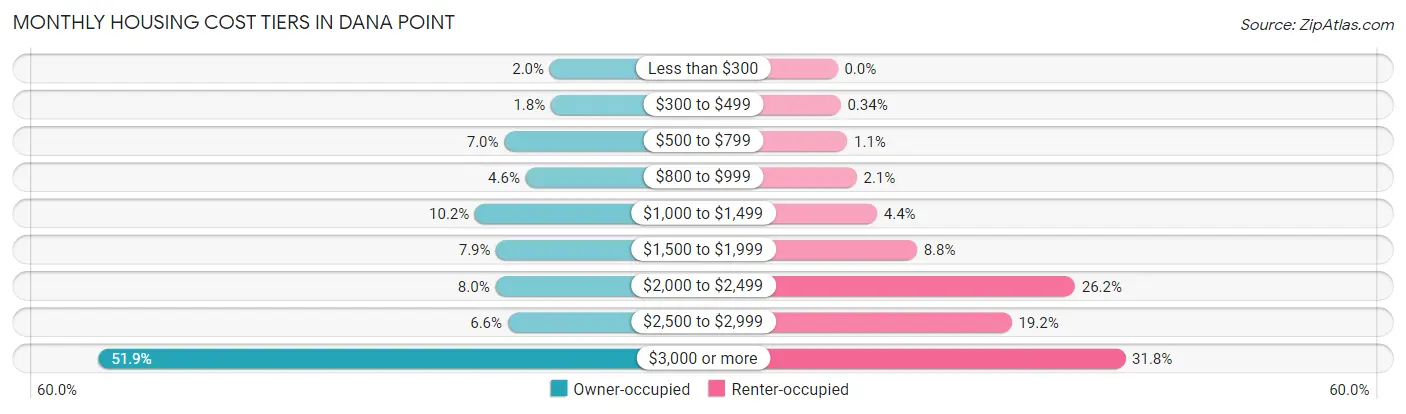
| Monthly Cost | Owner-occupied | Renter-occupied |
| Less than $300 | 176 (2.0%) | 0 (0.0%) |
| $300 to $499 | 164 (1.8%) | 18 (0.3%) |
| $500 to $799 | 625 (7.0%) | 56 (1.1%) |
| $800 to $999 | 414 (4.6%) | 111 (2.1%) |
| $1,000 to $1,499 | 913 (10.2%) | 229 (4.4%) |
| $1,500 to $1,999 | 703 (7.9%) | 460 (8.8%) |
| $2,000 to $2,499 | 712 (8.0%) | 1,377 (26.2%) |
| $2,500 to $2,999 | 590 (6.6%) | 1,010 (19.2%) |
| $3,000 or more | 4,628 (51.8%) | 1,669 (31.8%) |
| Total | 8,925 (100.0%) | 5,252 (100.0%) |
Physical Housing Characteristics in Dana Point
Housing Structures in Dana Point
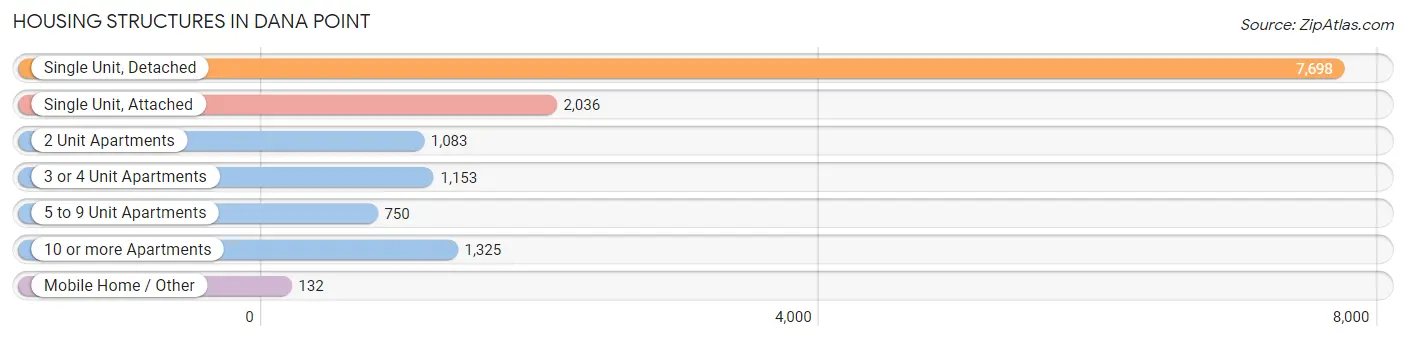
| Structure Type | # Housing Units | % Housing Units |
| Single Unit, Detached | 7,698 | 54.3% |
| Single Unit, Attached | 2,036 | 14.4% |
| 2 Unit Apartments | 1,083 | 7.6% |
| 3 or 4 Unit Apartments | 1,153 | 8.1% |
| 5 to 9 Unit Apartments | 750 | 5.3% |
| 10 or more Apartments | 1,325 | 9.3% |
| Mobile Home / Other | 132 | 0.9% |
| Total | 14,177 | 100.0% |
Housing Structures by Occupancy in Dana Point
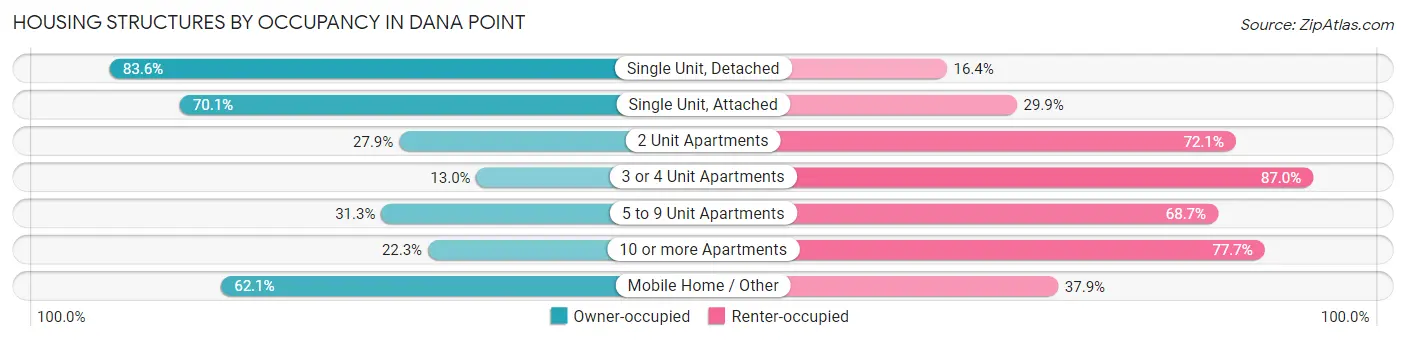
| Structure Type | Owner-occupied | Renter-occupied |
| Single Unit, Detached | 6,433 (83.6%) | 1,265 (16.4%) |
| Single Unit, Attached | 1,427 (70.1%) | 609 (29.9%) |
| 2 Unit Apartments | 302 (27.9%) | 781 (72.1%) |
| 3 or 4 Unit Apartments | 150 (13.0%) | 1,003 (87.0%) |
| 5 to 9 Unit Apartments | 235 (31.3%) | 515 (68.7%) |
| 10 or more Apartments | 296 (22.3%) | 1,029 (77.7%) |
| Mobile Home / Other | 82 (62.1%) | 50 (37.9%) |
| Total | 8,925 (62.9%) | 5,252 (37.0%) |
Housing Structures by Number of Rooms in Dana Point
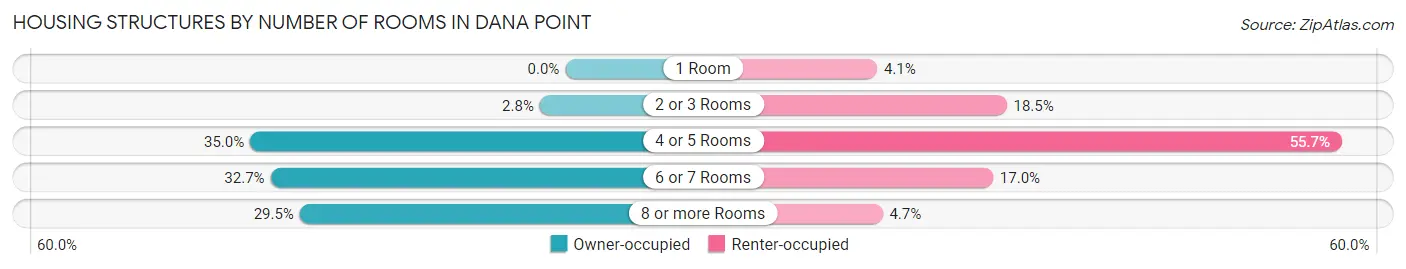
| Number of Rooms | Owner-occupied | Renter-occupied |
| 1 Room | 0 (0.0%) | 216 (4.1%) |
| 2 or 3 Rooms | 253 (2.8%) | 971 (18.5%) |
| 4 or 5 Rooms | 3,122 (35.0%) | 2,925 (55.7%) |
| 6 or 7 Rooms | 2,920 (32.7%) | 892 (17.0%) |
| 8 or more Rooms | 2,630 (29.5%) | 248 (4.7%) |
| Total | 8,925 (100.0%) | 5,252 (100.0%) |
Housing Structure by Heating Type in Dana Point
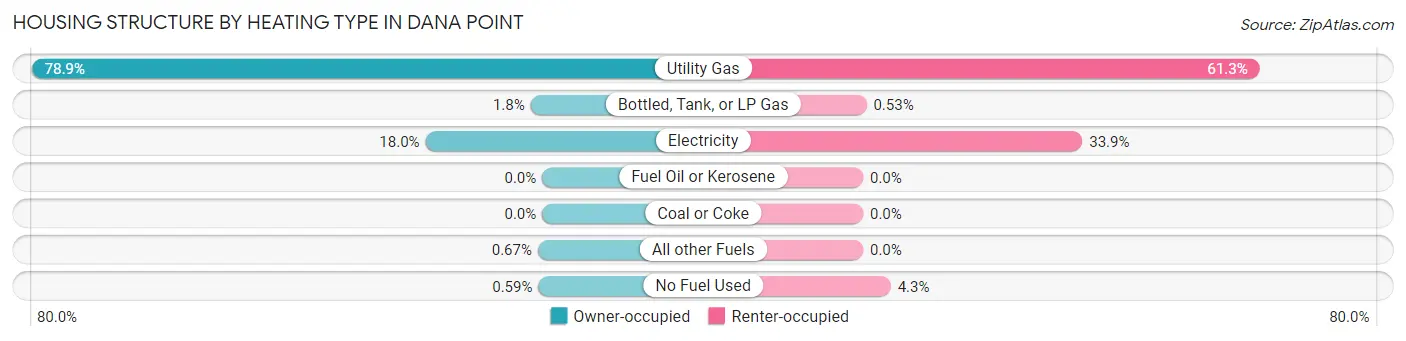
| Heating Type | Owner-occupied | Renter-occupied |
| Utility Gas | 7,043 (78.9%) | 3,219 (61.3%) |
| Bottled, Tank, or LP Gas | 159 (1.8%) | 28 (0.5%) |
| Electricity | 1,610 (18.0%) | 1,780 (33.9%) |
| Fuel Oil or Kerosene | 0 (0.0%) | 0 (0.0%) |
| Coal or Coke | 0 (0.0%) | 0 (0.0%) |
| All other Fuels | 60 (0.7%) | 0 (0.0%) |
| No Fuel Used | 53 (0.6%) | 225 (4.3%) |
| Total | 8,925 (100.0%) | 5,252 (100.0%) |
Household Vehicle Usage in Dana Point
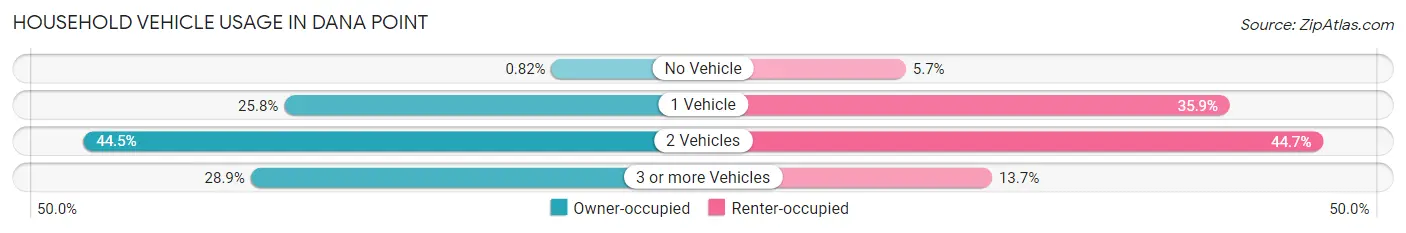
| Vehicles per Household | Owner-occupied | Renter-occupied |
| No Vehicle | 73 (0.8%) | 299 (5.7%) |
| 1 Vehicle | 2,300 (25.8%) | 1,887 (35.9%) |
| 2 Vehicles | 3,973 (44.5%) | 2,345 (44.7%) |
| 3 or more Vehicles | 2,579 (28.9%) | 721 (13.7%) |
| Total | 8,925 (100.0%) | 5,252 (100.0%) |
Real Estate & Mortgages in Dana Point
Real Estate and Mortgage Overview in Dana Point
| Characteristic | Without Mortgage | With Mortgage |
| Housing Units | 2,621 | 6,304 |
| Median Property Value | $1,106,800 | $1,152,600 |
| Median Household Income | $115,491 | $3,253 |
| Monthly Housing Costs | $985 | $4,396 |
| Real Estate Taxes | $7,107 | $34 |
Property Value by Mortgage Status in Dana Point
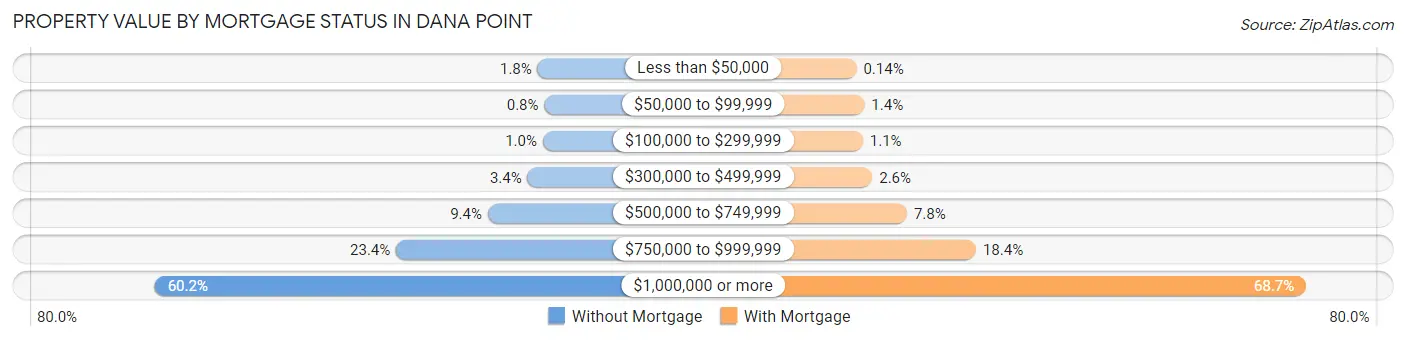
| Property Value | Without Mortgage | With Mortgage |
| Less than $50,000 | 48 (1.8%) | 9 (0.1%) |
| $50,000 to $99,999 | 21 (0.8%) | 85 (1.3%) |
| $100,000 to $299,999 | 27 (1.0%) | 70 (1.1%) |
| $300,000 to $499,999 | 88 (3.4%) | 161 (2.5%) |
| $500,000 to $749,999 | 247 (9.4%) | 494 (7.8%) |
| $750,000 to $999,999 | 613 (23.4%) | 1,157 (18.3%) |
| $1,000,000 or more | 1,577 (60.2%) | 4,328 (68.6%) |
| Total | 2,621 (100.0%) | 6,304 (100.0%) |
Household Income by Mortgage Status in Dana Point
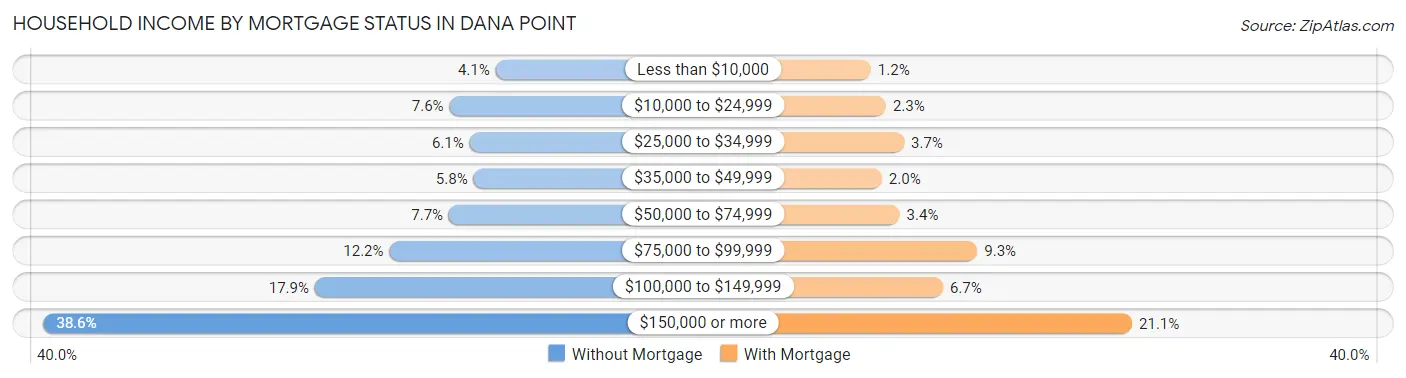
| Household Income | Without Mortgage | With Mortgage |
| Less than $10,000 | 108 (4.1%) | 74 (1.2%) |
| $10,000 to $24,999 | 200 (7.6%) | 146 (2.3%) |
| $25,000 to $34,999 | 160 (6.1%) | 233 (3.7%) |
| $35,000 to $49,999 | 152 (5.8%) | 127 (2.0%) |
| $50,000 to $74,999 | 201 (7.7%) | 212 (3.4%) |
| $75,000 to $99,999 | 320 (12.2%) | 585 (9.3%) |
| $100,000 to $149,999 | 469 (17.9%) | 420 (6.7%) |
| $150,000 or more | 1,011 (38.6%) | 1,328 (21.1%) |
| Total | 2,621 (100.0%) | 6,304 (100.0%) |
Property Value to Household Income Ratio in Dana Point
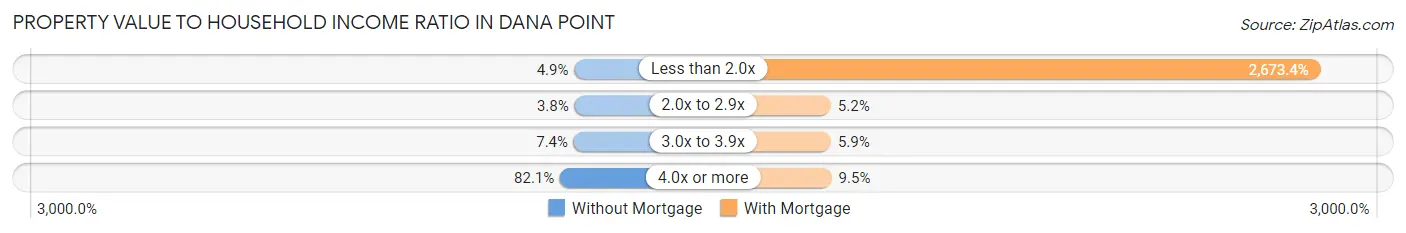
| Value-to-Income Ratio | Without Mortgage | With Mortgage |
| Less than 2.0x | 128 (4.9%) | 168,533 (2,673.4%) |
| 2.0x to 2.9x | 99 (3.8%) | 330 (5.2%) |
| 3.0x to 3.9x | 193 (7.4%) | 371 (5.9%) |
| 4.0x or more | 2,153 (82.1%) | 600 (9.5%) |
| Total | 2,621 (100.0%) | 6,304 (100.0%) |
Real Estate Taxes by Mortgage Status in Dana Point
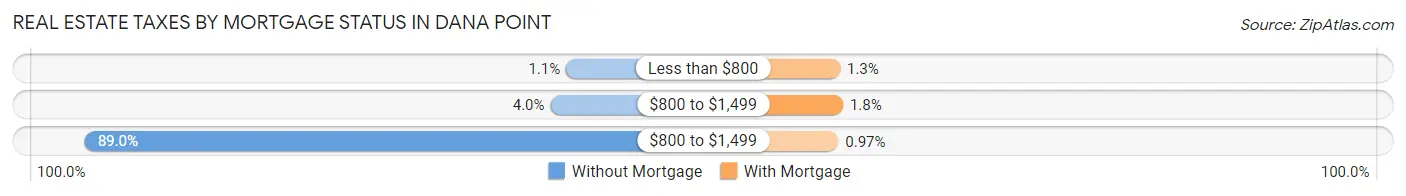
| Property Taxes | Without Mortgage | With Mortgage |
| Less than $800 | 29 (1.1%) | 81 (1.3%) |
| $800 to $1,499 | 104 (4.0%) | 114 (1.8%) |
| $800 to $1,499 | 2,333 (89.0%) | 61 (1.0%) |
| Total | 2,621 (100.0%) | 6,304 (100.0%) |
Health & Disability in Dana Point
Health Insurance Coverage by Age in Dana Point
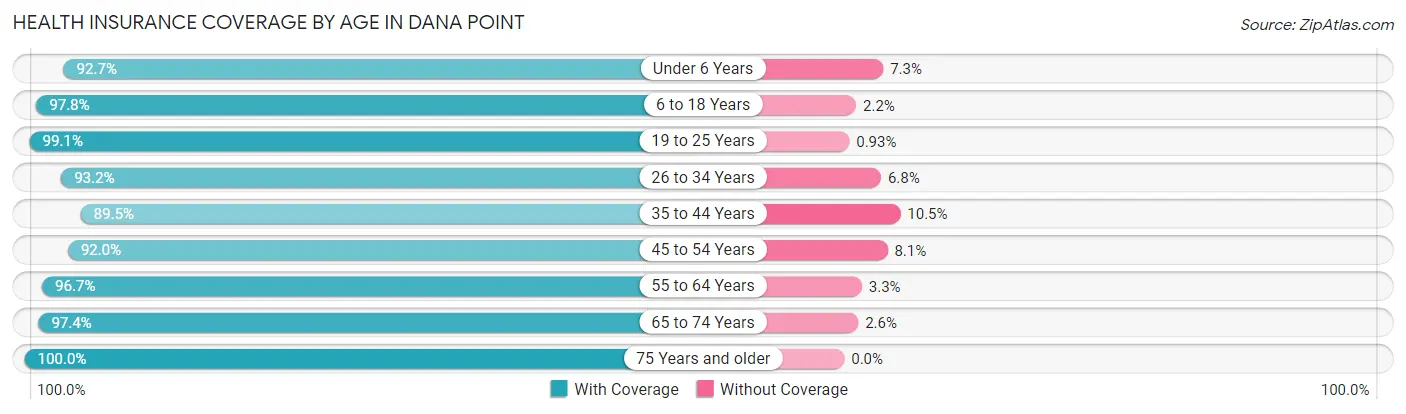
| Age Bracket | With Coverage | Without Coverage |
| Under 6 Years | 1,519 (92.7%) | 119 (7.3%) |
| 6 to 18 Years | 4,488 (97.8%) | 101 (2.2%) |
| 19 to 25 Years | 1,922 (99.1%) | 18 (0.9%) |
| 26 to 34 Years | 2,671 (93.2%) | 196 (6.8%) |
| 35 to 44 Years | 2,884 (89.5%) | 337 (10.5%) |
| 45 to 54 Years | 4,789 (91.9%) | 419 (8.1%) |
| 55 to 64 Years | 5,612 (96.7%) | 190 (3.3%) |
| 65 to 74 Years | 4,655 (97.4%) | 124 (2.6%) |
| 75 Years and older | 2,767 (100.0%) | 0 (0.0%) |
| Total | 31,307 (95.4%) | 1,504 (4.6%) |
Health Insurance Coverage by Citizenship Status in Dana Point
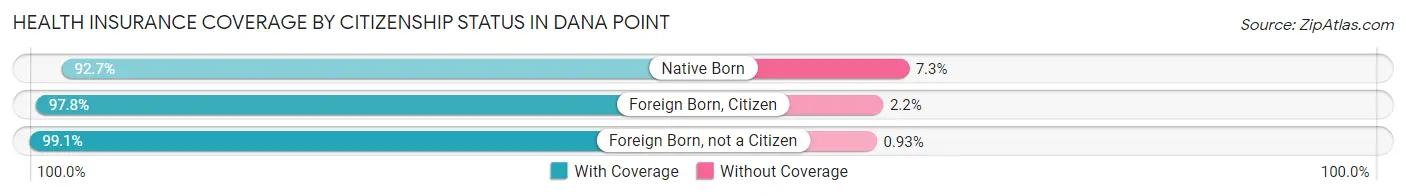
| Citizenship Status | With Coverage | Without Coverage |
| Native Born | 1,519 (92.7%) | 119 (7.3%) |
| Foreign Born, Citizen | 4,488 (97.8%) | 101 (2.2%) |
| Foreign Born, not a Citizen | 1,922 (99.1%) | 18 (0.9%) |
Health Insurance Coverage by Household Income in Dana Point
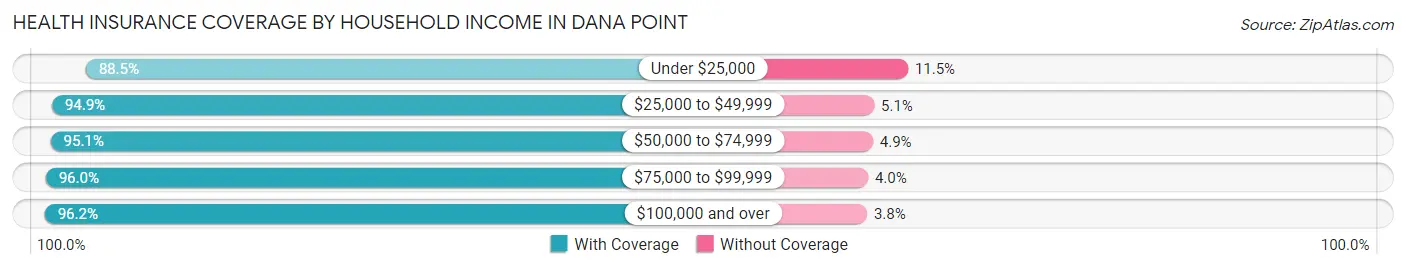
| Household Income | With Coverage | Without Coverage |
| Under $25,000 | 1,792 (88.5%) | 232 (11.5%) |
| $25,000 to $49,999 | 2,058 (94.9%) | 111 (5.1%) |
| $50,000 to $74,999 | 3,295 (95.1%) | 169 (4.9%) |
| $75,000 to $99,999 | 2,634 (96.0%) | 109 (4.0%) |
| $100,000 and over | 21,433 (96.2%) | 843 (3.8%) |
Public vs Private Health Insurance Coverage by Age in Dana Point
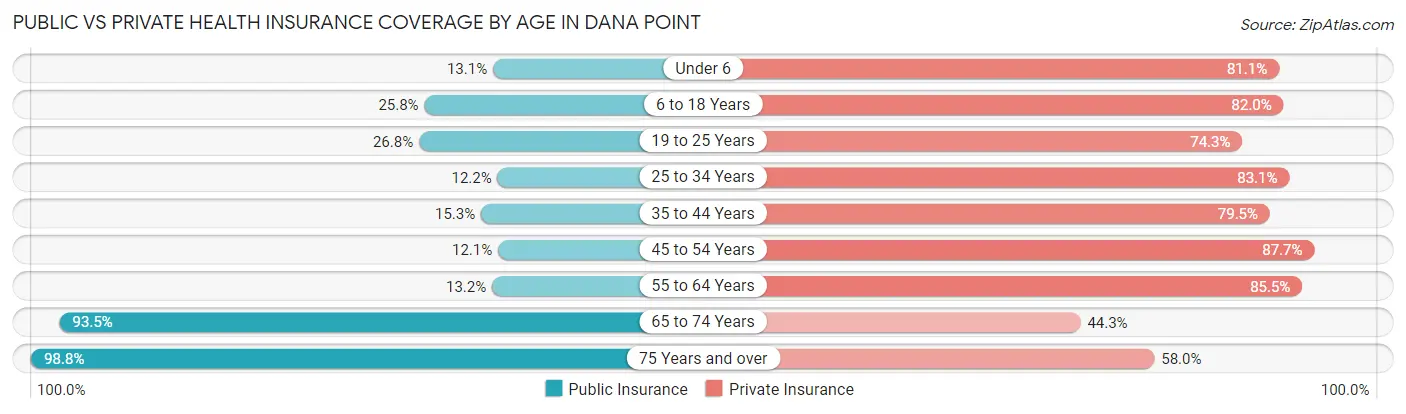
| Age Bracket | Public Insurance | Private Insurance |
| Under 6 | 214 (13.1%) | 1,329 (81.1%) |
| 6 to 18 Years | 1,183 (25.8%) | 3,763 (82.0%) |
| 19 to 25 Years | 520 (26.8%) | 1,442 (74.3%) |
| 25 to 34 Years | 350 (12.2%) | 2,381 (83.1%) |
| 35 to 44 Years | 492 (15.3%) | 2,559 (79.4%) |
| 45 to 54 Years | 631 (12.1%) | 4,567 (87.7%) |
| 55 to 64 Years | 768 (13.2%) | 4,958 (85.5%) |
| 65 to 74 Years | 4,470 (93.5%) | 2,117 (44.3%) |
| 75 Years and over | 2,734 (98.8%) | 1,605 (58.0%) |
| Total | 11,362 (34.6%) | 24,721 (75.3%) |
Disability Status by Sex by Age in Dana Point
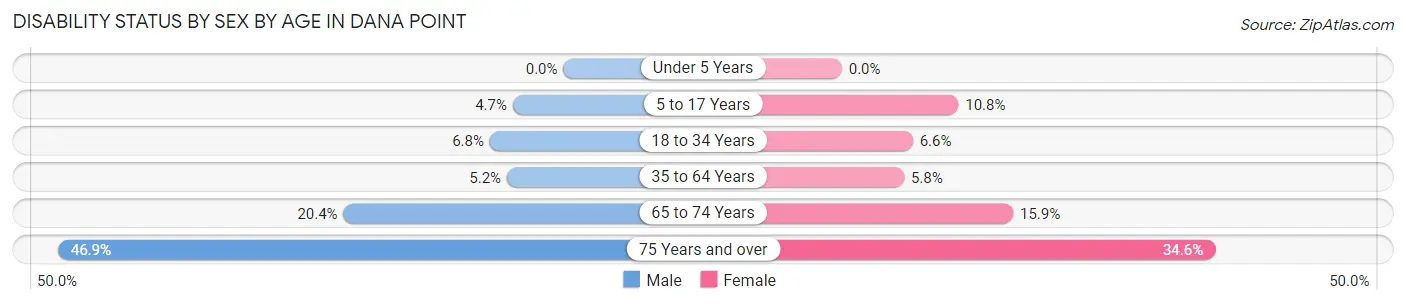
| Age Bracket | Male | Female |
| Under 5 Years | 0 (0.0%) | 0 (0.0%) |
| 5 to 17 Years | 107 (4.7%) | 228 (10.8%) |
| 18 to 34 Years | 164 (6.8%) | 180 (6.6%) |
| 35 to 64 Years | 353 (5.2%) | 432 (5.8%) |
| 65 to 74 Years | 441 (20.4%) | 416 (15.9%) |
| 75 Years and over | 610 (46.9%) | 508 (34.6%) |
Disability Class by Sex by Age in Dana Point
Disability Class: Hearing Difficulty
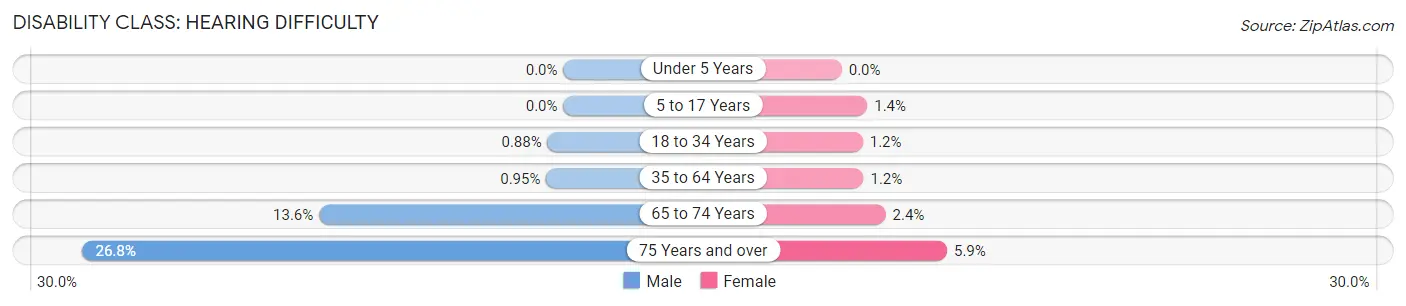
| Age Bracket | Male | Female |
| Under 5 Years | 0 (0.0%) | 0 (0.0%) |
| 5 to 17 Years | 0 (0.0%) | 30 (1.4%) |
| 18 to 34 Years | 21 (0.9%) | 32 (1.2%) |
| 35 to 64 Years | 64 (0.9%) | 91 (1.2%) |
| 65 to 74 Years | 294 (13.6%) | 64 (2.4%) |
| 75 Years and over | 348 (26.8%) | 86 (5.9%) |
Disability Class: Vision Difficulty
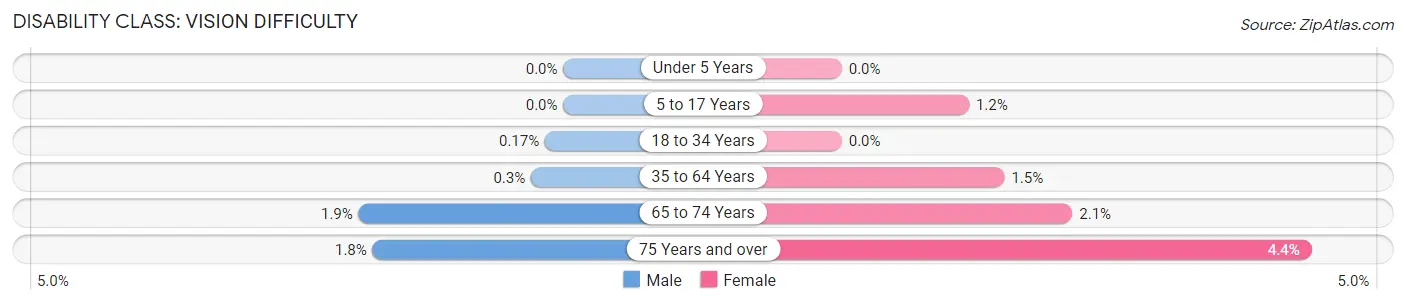
| Age Bracket | Male | Female |
| Under 5 Years | 0 (0.0%) | 0 (0.0%) |
| 5 to 17 Years | 0 (0.0%) | 25 (1.2%) |
| 18 to 34 Years | 4 (0.2%) | 0 (0.0%) |
| 35 to 64 Years | 20 (0.3%) | 113 (1.5%) |
| 65 to 74 Years | 41 (1.9%) | 56 (2.1%) |
| 75 Years and over | 23 (1.8%) | 64 (4.4%) |
Disability Class: Cognitive Difficulty
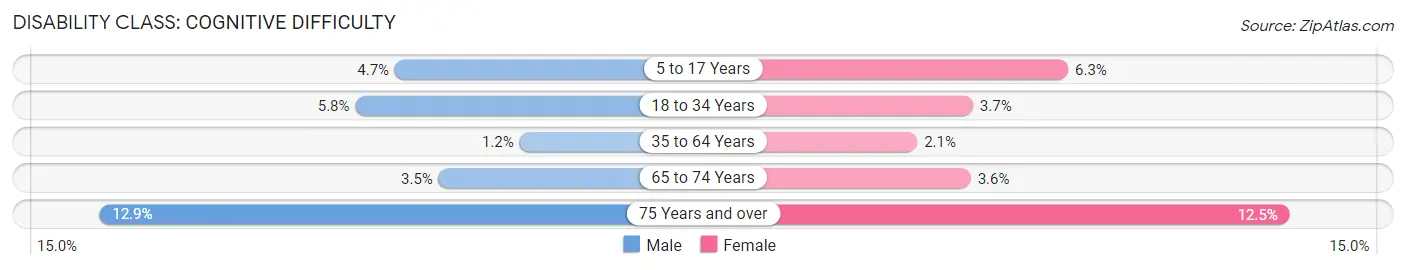
| Age Bracket | Male | Female |
| 5 to 17 Years | 107 (4.7%) | 133 (6.3%) |
| 18 to 34 Years | 139 (5.8%) | 100 (3.6%) |
| 35 to 64 Years | 82 (1.2%) | 157 (2.1%) |
| 65 to 74 Years | 75 (3.5%) | 94 (3.6%) |
| 75 Years and over | 168 (12.9%) | 183 (12.5%) |
Disability Class: Ambulatory Difficulty
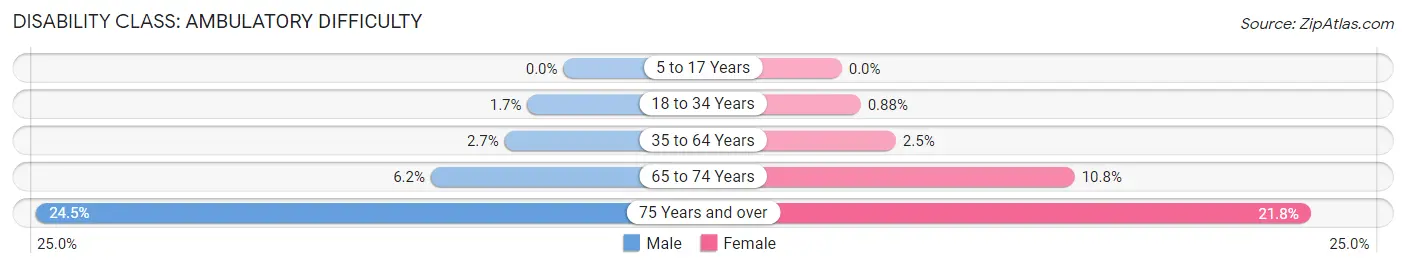
| Age Bracket | Male | Female |
| 5 to 17 Years | 0 (0.0%) | 0 (0.0%) |
| 18 to 34 Years | 40 (1.7%) | 24 (0.9%) |
| 35 to 64 Years | 184 (2.7%) | 188 (2.5%) |
| 65 to 74 Years | 133 (6.1%) | 283 (10.8%) |
| 75 Years and over | 318 (24.5%) | 319 (21.7%) |
Disability Class: Self-Care Difficulty
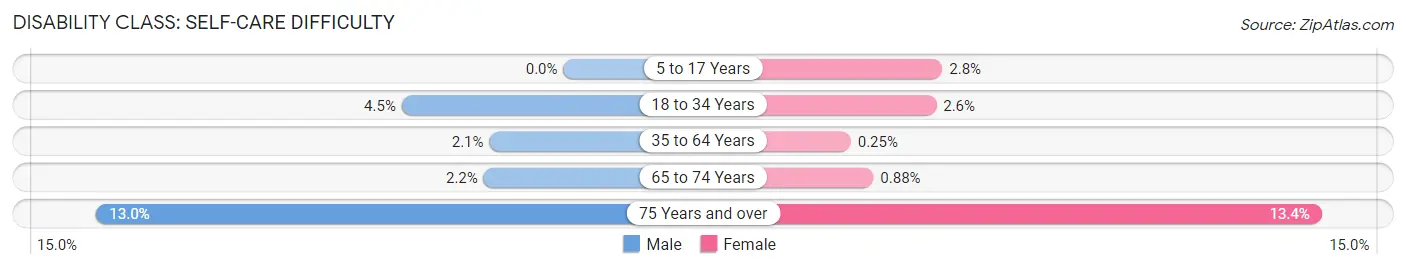
| Age Bracket | Male | Female |
| 5 to 17 Years | 0 (0.0%) | 59 (2.8%) |
| 18 to 34 Years | 108 (4.5%) | 72 (2.6%) |
| 35 to 64 Years | 139 (2.1%) | 19 (0.3%) |
| 65 to 74 Years | 48 (2.2%) | 23 (0.9%) |
| 75 Years and over | 169 (13.0%) | 196 (13.4%) |
Technology Access in Dana Point
Computing Device Access in Dana Point
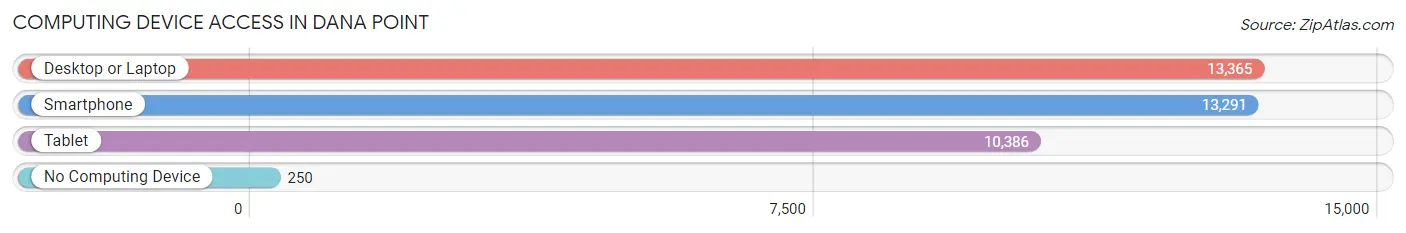
| Device Type | # Households | % Households |
| Desktop or Laptop | 13,365 | 94.3% |
| Smartphone | 13,291 | 93.8% |
| Tablet | 10,386 | 73.3% |
| No Computing Device | 250 | 1.8% |
| Total | 14,177 | 100.0% |
Internet Access in Dana Point
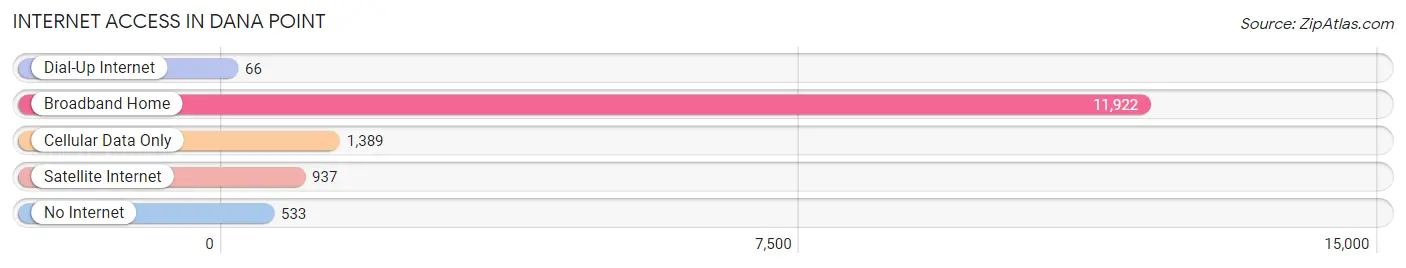
| Internet Type | # Households | % Households |
| Dial-Up Internet | 66 | 0.5% |
| Broadband Home | 11,922 | 84.1% |
| Cellular Data Only | 1,389 | 9.8% |
| Satellite Internet | 937 | 6.6% |
| No Internet | 533 | 3.8% |
| Total | 14,177 | 100.0% |
Dana Point Summary
Dana Point is a city located in Orange County, California, United States. It is situated on the coast of the Pacific Ocean, about halfway between Los Angeles and San Diego. The city is known for its beautiful beaches, harbor, and its picturesque views of the ocean.
History
The area that is now Dana Point was first inhabited by the Acjachemen Native American tribe. The area was named after Richard Henry Dana, Jr., who wrote about the area in his book Two Years Before the Mast. The area was first developed in the late 19th century, when a wharf was built to serve the local fishing industry. The area was incorporated as a city in 1989.
Geography
Dana Point is located in southern Orange County, California, on the coast of the Pacific Ocean. It is situated between the cities of San Clemente to the north and San Juan Capistrano to the south. The city is bordered by the Pacific Ocean to the west and the San Juan Creek to the east. The city covers an area of 8.8 square miles, with a population of 33,351 as of the 2010 census.
Climate
Dana Point has a Mediterranean climate, with mild temperatures year-round. The average high temperature in the summer is around 75°F, while the average low temperature in the winter is around 55°F. The city receives an average of 13 inches of rain per year.
Economy
Dana Point is a popular tourist destination, with its beautiful beaches, harbor, and picturesque views of the ocean. The city is home to several resorts and hotels, as well as a variety of restaurants and shops. The city is also home to a number of marinas, which provide services for recreational boaters. The city is also home to a number of technology companies, including the headquarters of the software company Oracle.
Demographics
As of the 2010 census, Dana Point had a population of 33,351. The racial makeup of the city was 79.2% White, 1.3% African American, 0.5% Native American, 8.2% Asian, 0.2% Pacific Islander, 6.2% from other races, and 4.5% from two or more races. Hispanic or Latino of any race were 17.3% of the population.
The median income for a household in the city was $87,890, and the median income for a family was $103,890. The per capita income for the city was $45,945. About 4.3% of families and 6.2% of the population were below the poverty line, including 8.2% of those under age 18 and 4.2% of those age 65 or over.
Common Questions
What is Per Capita Income in Dana Point?
Per Capita income in Dana Point is $74,878.
What is the Median Family Income in Dana Point?
Median Family Income in Dana Point is $139,567.
What is the Median Household income in Dana Point?
Median Household Income in Dana Point is $119,632.
What is Income or Wage Gap in Dana Point?
Income or Wage Gap in Dana Point is 23.9%.
Women in Dana Point earn 76.1 cents for every dollar earned by a man.
What is Inequality or Gini Index in Dana Point?
Inequality or Gini Index in Dana Point is 0.47.
What is the Total Population of Dana Point?
Total Population of Dana Point is 33,025.
What is the Total Male Population of Dana Point?
Total Male Population of Dana Point is 15,998.
What is the Total Female Population of Dana Point?
Total Female Population of Dana Point is 17,027.
What is the Ratio of Males per 100 Females in Dana Point?
There are 93.96 Males per 100 Females in Dana Point.
What is the Ratio of Females per 100 Males in Dana Point?
There are 106.43 Females per 100 Males in Dana Point.
What is the Median Population Age in Dana Point?
Median Population Age in Dana Point is 49.5 Years.
What is the Average Family Size in Dana Point
Average Family Size in Dana Point is 2.8 People.
What is the Average Household Size in Dana Point
Average Household Size in Dana Point is 2.3 People.
How Large is the Labor Force in Dana Point?
There are 17,448 People in the Labor Forcein in Dana Point.
What is the Percentage of People in the Labor Force in Dana Point?
61.6% of People are in the Labor Force in Dana Point.
What is the Unemployment Rate in Dana Point?
Unemployment Rate in Dana Point is 4.5%.